Is ONDO Gearing Up for a Massive Breakout or Breakdown?Yello, Paradisers! Are you prepared for what’s about to unfold? #ONDOUSDT is at a critical juncture, and the price action is signaling that a major move could be imminent. Will it skyrocket higher or collapse below support? Let’s dive into the analysis.
💎#ONDOUSDT is currently trading within a falling wedge pattern a classic bullish indicator that often hints at a potential trend reversal. The price has been squeezed between a descending resistance line and a strong support level, creating a buildup of tension. At the moment, #ONDO is sitting near the $1.25665 demand zone, a critical level that buyers have historically defended with vigor. If this zone holds, a significant bullish breakout may be on the horizon.
💎Adding weight to the bullish case is the RSI divergence, which indicates that selling pressure is weakening.If #ONDO can break above the wedge’s resistance line, the stage could be set for a rally toward the $1.75–$2.30 range, with the potential to reach $2.50 or higher if bullish momentum continues.
💎However, we must stay vigilant and prepared for the alternative. If the $1.25665 demand zone fails, #ONDO could drop toward an untested historical support level at $1.0995. A break below this level might trigger a liquidation event, as weak hands are flushed out of the market. A deeper correction could then push prices toward $0.90 or even $0.70, invalidating the bullish wedge and likely increasing selling pressure.
Paradisers, this is a prime example of why patience and preparation are the most important tools in a trader’s arsenal. While most traders act on emotions, always focus on planning, waiting for confirmation, and executing smartly.
MyCryptoParadise
iFeel the success🌴
Cryptosignal

Is Solana About to Make a Comeback? Key Levels to Watch NOW!Yello, Paradisers! After tapping its all-time high, #Solana has been stuck in a strong corrective wave lower, leaving many wondering—are the bulls done, or is a reversal around the corner? The good news is #SOLUSDT is finally approaching a critical support zone that could flip the trend back in favor of buyers.
💎The first key level to watch is $180, a strong support zone that previously triggered a powerful upward reaction. Bulls are expected to defend this area aggressively, and any significant bounce from here could mark a shift in momentum. However, if sellers remain in control and push the price lower, the next major support sits between $162 and $157. This zone was once a strong resistance and has now transformed into a robust support level. Bulls will likely step in with force if Solana dips into this region, creating the perfect setup for a potential reversal.
💎On the flip side, Solana faces a tough resistance between $200 and $205. This area is a critical barrier as it combines both horizontal resistance and a descending trendline. Bulls must clear this zone to regain momentum and push Solana back into a bullish trend.
💎If Solana manage to break above $205, we’ll likely see Solana push toward the strong resistance levels at $225 to $230, as the next major targets.
Patience is key, Paradisers. Play it smart, watch these levels, and let the market come to you.
MyCryptoParadise
iFeel the success🌴

Solana’s Big Moment: Will the Ascending Triangle Ignite a Rally?Yello, Paradisers! #Solana is gearing up for action as it charges inside an ascending triangle pattern, inching closer to the critical neckline resistance. If bulls can deliver a convincing breakout here, a trending move could be on the cards, setting the stage for a significant rally.
💎For #SOLUSDT the first test lies at the $197–$198.50 range, a moderate resistance zone that has effectively capped its price since December 19th. A breakout above this level, supported by strong volumes, could signal the start of a trending move, initially pushing the price toward the $210–$212 zone, where some profit-taking is likely to occur.
💎If bullish momentum remains strong beyond this point, Solana could set its sights on the next major resistance at $220–$225.50. This key level has the potential to define the next phase of its upward movement and will be critical for assessing whether the bulls can sustain the rally.
💎On the downside, Solana is supported by the ascending trendline in the $188–$186 range, with additional horizontal support at $186–$183.80. As long as these levels hold, the bulls remain in a strong position to keep the momentum alive.
Paradisers, stay sharp—Solana is at a critical turning point, and the next few moves could be decisive!
MyCryptoParadise
iFeel the success🌴

Is CPOOL on the Verge of a Bullish Breakout?Yello, Paradisers! Could #CPOOL be preparing for a significant bullish reversal right now? What we’re seeing on the chart suggests that bulls may be quietly building momentum—but there’s one key breakout level they need to conquer first. Let’s break it down:
💎#CPOOL is currently trading within a descending channel, but things are starting to get interesting. The price just re-tested a major breakout level, and we’re seeing a strong reaction from that zone. This type of reaction is a classic bullish clue—suggesting buyers may be looking to take back control and push CPOOL higher from here.
💎CPOOL has a strong support presence at the levels of $0.250 and $0.265, this range has already proven its strength. Notice how CPOOL’s recent dip into this area triggered a sharp bounce that erased nearly three days of losses. This reaction from support is a strong indication that buyers are still defending this zone aggressively.
💎Over the next few hours, we could see CPOOL enter a short-term consolidation phase or dip slightly for a minor retest of the $0.30 support level. A clean hold above this zone would be a solid base for bulls to build on.
💎On the other hand, for bulls to really take charge, they must break above the $0.370 resistance level. If they manage to do that, the path opens up to a much more critical level at $0.425—the descending channel resistance. This level is pivotal as break out above this can create a powerful bullish rally pushing straight towards the $0.475 to $0.495 region, where a key 0.618 Fibonacci retracement level is waiting.
💎However, we need to be cautious around this Fibonacci zone. Historically, the 0.618 level often triggers profit-taking and temporary pullbacks. It’s a level where both bulls and bears tend to battle it out—so watch for potential hesitation or rejection in that area.
Patience and discipline are key here, Paradisers. The market often tests both bulls and bears before making decisive moves, so stay vigilant.
MyCryptoParadise
iFeel the success🌴

XLMUSDT: Bullish Setup or Reversal on the Horizon?Yello, Paradisers! Are you ready to capitalize on XLMUSDT’s next big move? Let’s break it down!
💎XLMUSDT has been consolidating within a well-defined descending channel, a classic retracement pattern that often sets the stage for a bullish breakout.
💎If XLMUSDT breaks and closes a candle above the resistance level, it would strongly increase the probability of a bullish move, opening the door to significant upside potential.
💎On the flip side, if the price dips to shake out weak hands, key support zones will be crucial. A bounce from these areas, coupled with a bullish I-CHoCH (internal change of character) or reversal patterns like a double bottom (W) or an inverse head and shoulders, would signal strength and increase the probability of a sustained rally.
💎However, discipline is key! If the price breaks down and closes a candle below the support zone, it invalidates the bullish setup. In such a scenario, it’s wiser to wait for clearer and more favorable price action to unfold rather than rushing into a trade.
🎖 This market rewards patience and preparation. Always remember, the goal is consistency, not chasing impulsive moves. Stay disciplined, Paradisers, and let’s crush these markets with sound strategies and precision!
MyCryptoParadise
iFeel the success🌴

RAREUSDT: Is a Bullish Breakout on the Horizon?Yello Paradisers! Could RAREUSDT be gearing up for a strong bullish move, or will a breakdown catch traders off guard? Let’s dive into the critical price action signals you need to watch!
💎RAREUSDT has recently shown good signs of a bullish reversal. The pair took out inducement levels and formed a double-bottom-like structure, a classic signal that increases the probability of an upward move from here.
💎If price retraces further or triggers panic selling, a bounce from the strong support zone below remains a high-probability scenario.To solidify the bullish case, we need to see a bullish I-CHoCH (Internal Change of Character) on the lower timeframes, confirming buyers are stepping in with strength.
💎If RAREUSDT breaks down and closes a candle below the strong support zone, the entire bullish structure will be invalidated. In that case, it’s wiser to remain patient and wait for a better, higher-probability setup to form.
🎖Remember, Paradisers, sustainable trading is about being disciplined and strategic. Waiting for confirmations is always better than chasing trades on shaky grounds. The market rewards those who master patience and trade smartly.
MyCryptoParadise
iFeel the success🌴

TAO Breakout Imminent? Watch These Crucial Levels Closely!Yello, Paradisers! Is #TAO gearing up for a powerful breakout, or are the bulls about to hit a wall? Let’s break this down step by step because this could be the turning point for TAO!
💎#TAOUSDT has reversed strongly after grabbing liquidity at lower levels, and it’s now shaping into an inverse head-and-shoulders pattern—one of the most promising bullish structures. If the breakout confirms, TAO could target the unfilled inefficiencies above. But will the bulls carry this momentum all the way?
💎Currently, TAO is testing the neckline of this pattern, with resistance sitting at the $460–$470 zone. A clean breakout and successful retest of this level as support could ignite further bullish momentum, pushing TAO toward $540–$550. This zone is critical as it holds the 61.8% Fibonacci retracement and aligns with the descending resistance, making it a significant hurdle for the bulls to conquer.
💎Should TAO break through $550, the next target lies at $620–$640—a region where the pattern target completes. However, be cautious here. This level could trigger aggressive profit-taking, and we know how markets react when the herd gets too excited.
💎On the flip side, TAO’s immediate goal is to flip the $460–$470 range into support. If this happens, it could act as a major catalyst for continued bullish momentum. If the bulls fail to hold this level, strong support lies below at the $430–$415 zone—a key area with the strength to absorb short-term selling pressure.
Patience and discipline are key here, Paradisers. The market often tests both bulls and bears before making decisive moves, so stay vigilant.
MyCryptoParadise
iFeel the success🌴

WIF/USDT: A Breakout is Brewing – Are You Ready? Yello Paradisers! Have you been tracking #WIFUSDT lately? If not, you're at risk of missing what could be a massive move will it skyrocket or collapse? Let’s break it all down.
💎#WIFUSDT has just broken out of a falling wedge pattern, a classic bullish indicator that often signals a trend reversal. Following this breakout, the price retested the key support at $1.707 and held its ground, showing clear strength from buyers. This zone, extending as low as $1.432, has been a crucial demand area that has repeatedly proven itself over the past few weeks.
💎If the price stays above this key support, we could witness a strong push toward $2.93, a minor resistance level that must be cleared to fuel sustained bullish momentum. A clean break above $2.942 would open the doors for WIF to target its major resistance zone between $4.63 and $4.80. Historically, this level has been a significant ceiling, but if breached, it could trigger an explosive rally.
💎 On the flip side, if the price fails to hold the $1.432 demand zone, it could result in a bearish breakdown, potentially dragging the price below $1.00.
💎#WIFUSD is at a critical crossroads. Bulls need to reclaim higher levels, while bears are closely watching for any signs of weakness to exploit. As Paradisers, this is a time for patience and discipline. Don’t rush into a position wait for clear confirmations of a breakout or breakdown before making any moves.
Stay focused, play it smart, and remember, Paradisers: the market rewards those who are disciplined and prepared!
MyCryptoParadise
iFeel the success🌴

Critical Moment for TIAUSDT: Bullish Reversal or Breakdown?Yello, Paradisers! Are you watching TIAUSDT closely? It’s at a critical juncture, and what happens next could shape the next major move. Let’s break it down!
💎Currently, TIAUSDT is holding its bullish market structure on the higher timeframes, which is an encouraging sign for the bulls. After taking inducement, the pair has also formed a classic "W" pattern, accompanied by a bullish divergence—a combination that significantly boosts the probability of a bullish reversal from these levels.
💎However, caution is always key. If the price retraces further or we see panic selling, we might still find a bounce from the support zone. For this scenario to play out, we’ll need to wait for a bullish I-CHoCH (Internal Change of Character) to confirm the reversal on lower timeframes. Without this confirmation, entering prematurely could expose us to unnecessary risk.
💎On the flip side, if the price breaks down and closes a candle below the support zone, this would invalidate the current bullish idea. In that case, it would be prudent to wait for new, stronger price action to develop before considering re-entry.
🎖This is why patience and discipline are your best allies in trading, Paradisers. Emotional decisions or rushing into trades without confirmations can lead to costly mistakes. Stick to robust strategies and always wait for high-probability setups to unfold. Remember, long-term consistency is what separates the winners from the herd.
MyCryptoParadise
iFeel the success🌴

EGLDUSDT: A Bullish Breakout or a Trap?Yello, Paradisers! Are we standing at the start of a major bullish run for EGLDUSDT, or is this just a fakeout waiting to catch over-enthusiastic traders off guard? Let’s dive in!
💎EGLDUSDT is showing signs of a potential bullish reversal after a recent retracement, and the double bottom structure combined with bullish divergence is giving us some strong clues. So far, price action is leaning bullish, but let’s not get ahead of ourselves — key confirmation levels still need to hold!
💎EGLDUSDT has successfully broken through a key resistance trendline, which was previously capping upward moves. This breakout is a positive sign for bulls.
💎We’ve spotted a bullish I-CHoCH on the chart — this is a solid early indicator that momentum may be shifting to the upside. The move came after an inducement, which swept weak hands before bouncing from a support zone. This adds credibility to the breakout, increasing the odds that EGLDUSDT could push higher from here.
💎In case of another retracement or panic selling, we’ll be looking for EGLDUSDT to bounce from strong support zone. But here’s the critical part — we need to see another bullish I-CHoCH at this level to reinforce the bullish narrative. Without it, this whole setup could crumble.
💎If EGLDUSDT fails to hold that strong support zone and closes a candle below it, that’s our warning sign to step aside. At that point, it’s better to wait for a fresh bullish structure to form rather than trying to catch a falling knife.
💎Right now, EGLDUSDT is giving us some good signals for a bullish move, but don’t rush in blindly. We need to see follow-through at key levels to confirm this breakout. If the market pulls back further, patience will be essential.
🎖 Strive for consistency, not quick profits. Treat the market as a businessman, not as a gambler.
MyCryptoParadise
iFeel the success🌴

Are ONDO Bulls Preparing for a Major Comeback?Yello, Paradisers! Is the recent breakdown in #ONDOUSDT just a trap to shake out weak hands? The price action is hinting at a potential manipulation move, and if bulls can reclaim a key level, we could be in for a speedy reversal. Let’s dive into the key areas that will make or break this move.
💎A few days ago, #ONDO breached a key support level, but interestingly, this breakdown didn’t trigger any major sell-off. This lack of follow-through from sellers is an early clue that this could be a deviation—a classic shakeout move to trap shorts before sending the price higher.
💎Now, ONDO is about to test a critical resistance zone between $1.30 and $1.34. If bulls can reclaim this level, the deviation will be confirmed, and we could see a strong bullish reversal kick in.
💎If bulls manage to break above $1.34 level, then a quick move towards the $1.60 level is highly likely, followed by a move towards the strong resistance zone between $1.70 and $1.75. This upper resistance zone is key because it aligns with the 0.618 Fibonacci retracement level, which is known to trigger heavy profit-taking. We’ve seen it time and time again—this level tends to attract sellers, so caution is warranted if the price approaches this area.
💎On the downside, ONDO currently has strong support between $1.10 and $1.15, a zone that has consistently attracted buyers. The repeated reactions from this support suggest that buyers are actively defending this level, which could give bulls the confidence to push through the immediate resistance above.
Paradisers, this setup is looking very promising—but don’t forget, discipline and patience are key in this market.
MyCryptoParadise
iFeel the success🌴

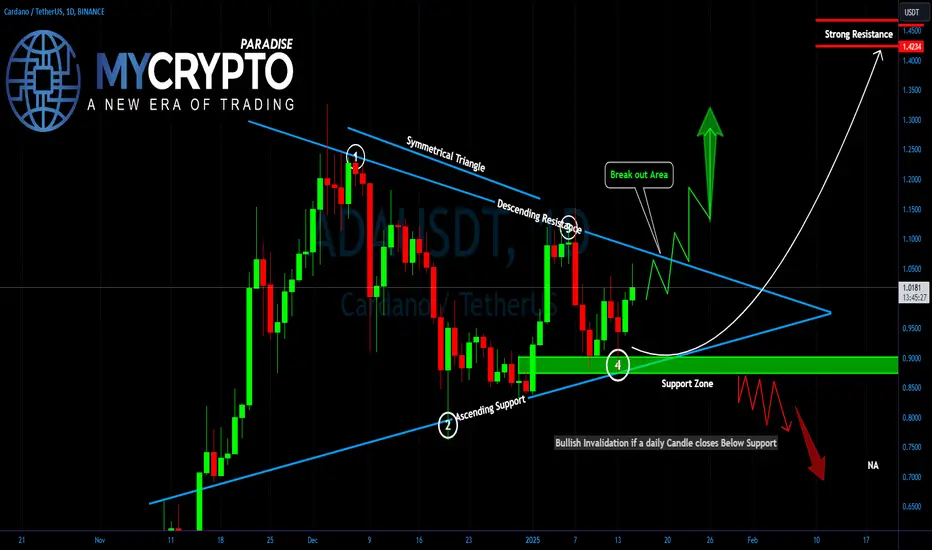
Is ADA About to Explode or Collapse? Key Levels You Can't IgnoreYello Paradisers! Are you watching Cardano (ADA)? If not, you might miss one of the most decisive moments in recent weeks. The symmetrical triangle forming on the daily chart is nearing its breaking point, and when it does, we could see an explosive move.
💎#ADAUSDT is currently trading within a symmetrical triangle, a classic pattern that indicates market indecision. The price is compressing between an ascending support line and a descending resistance line, creating a tightening range. This formation suggests that a breakout or breakdown is imminent, and Paradisers should be prepared for either scenario.
💎On the bullish side, the resistance zone between $1.0660 and $1.0774 is the key level to watch. A breakout above this range, confirmed by a daily close and increased volume, could ignite a powerful move toward $1.25, $1.35, and even the $1.4469 region, where we see significant historical resistance. Such a breakout would confirm bullish momentum and potentially attract new buyers.
💎Conversely, the support zone between $0.8970 and $0.8756 is a critical level for the bulls to defend. A breakdown below this zone would invalidate the bullish triangle and open the path for a sharper decline.Wait for a clean break of either resistance or support before committing to a position, and always trade with a proper risk management plan in place.
Discipline, patience, and a clear strategy will always set you apart from the herd. Let the market reveal its direction, and act decisively when it does. Be a pro, Paradisers!
MyCryptoParadise
iFeel the success🌴
ENAUSDT — Double Top Breakdown: Is a Bigger Drop Coming?Yello, Paradisers! Have you spotted the double top pattern on #ENAUSDT? Let’s break it all down clearly.
💎#ENA is showing a double top breakout, which is a strong bearish signal. The price recently broke below the support neckline and is now retesting that same level, which has turned into a resistance zone around $0.85 to $0.91. This area is key. If the price gets rejected here, it’s likely to continue its downward move toward the next support at $0.68. There’s even a chance it could drop lower into a stronger support zone if the selling pressure increases.
💎However, if ENA manages to reclaim this resistance zone, the price could push higher and target the supply zone between $1 and $1.08. In this case, it would grab liquidity before continuing its downward trend. Keep in mind that this move wouldn’t necessarily signal a full reversal — it could just be a temporary bounce.
💎The key level to watch for bearish invalidation is $1.08. If we see a daily close above $1.08, it would suggest that the bearish structure has broken and the price could shift back into a bullish trend.
Remember, consistency is what separates successful traders from the rest. Stay focused, Paradisers.
MyCryptoParadise
iFeel the success🌴

LINK on the Brink: Is a Deeper Dive Coming?Yello, Paradisers! Are we about to see #LINK take a nosedive? The once-reliable November ascending support is showing cracks, and an ominous inverse head-and-shoulders pattern is now on the radar. Could this signal a deeper correction on the horizon?
💎#LINKUSDT is at a critical juncture as the price inches closer to the $19.80 neckline support. If this crucial level breaks, it could trigger a deeper correction, aligning perfectly with the inverse head-and-shoulders pattern target. A breakdown would likely send LINK tumbling into the $17.35–$16.60 range—a zone of strong support that could ignite significant short-covering activity.
💎While this area has the potential to act as a solid bottom, but make no mistake—if the bulls want this region to act as a solid bottom, they’ll need to bring their A-game with a prolonged consolidation effort to soak up the remaining selling pressure.
💎On the flip side, resistance is mounting. LINK faces immediate resistance at $22.00, a level that recently flipped from support to resistance. However, the real challenge lies further up at the $27–$28 zone—a stronghold that continues to keep the bulls in check and make their task increasingly daunting.
Patience and discipline are key here, Paradisers. The market often tests both bulls and bears before making decisive moves, so stay vigilant.
MyCryptoParadise
iFeel the success🌴

Is FET About to Bounce or Break Down Completely?Yello, Paradisers! FETUSDT is at a make-or-break point right now. The recent retracement looks healthy, and the pair has taken out liquidity (inducement) from weaker hands. But can it hold this support zone and bounce?
💎If we start seeing bullish signs such as a bullish I-CHoCH (internal change of character) or reversal patterns like a W pattern or an inverse head and shoulders on the lower timeframes, the probability of a bullish move significantly increases.
💎However, be prepared for more retracement or panic selling. If that happens, the next strong support zone could trigger a bounce, but again—we need to see bullish confirmations on lower timeframes to consider entering long positions.
💎If the price breaks below the key support zone and closes candles underneath it, the entire bullish idea will be invalidated. In that case, it’s best to stay patient and wait for better price action to form before making any moves.
🎖Patience and discipline are the keys here, Paradisers. Always wait for the highest probability setups to reduce risk and increase your edge. Remember, it’s not about predicting the market—it’s about reacting to what the market gives you.
MyCryptoParadise
iFeel the success🌴

Will SAND Make a Comeback or Sink Lower? Yello, Paradisers! Are you ready for what could be a make-or-break moment for SAND? Let’s dive into the details to ensure you don’t get caught on the wrong side of the market.
💎#SANDUSDT is approaching a key support level at $0.4787, a zone that has historically acted as a springboard for bullish momentum. This level has been tested multiple times, showcasing its strength. However, if this support fails to hold, it could trigger a wave of selling pressure, potentially dragging the price down to the next significant demand zone at $0.3754.
💎If SAND manages to hold above the 100-day EMA and regains bullish momentum, a retest of the $0.7463 resistance zone becomes highly likely. A successful breakout above this level could pave the way for a rally toward $1.00 or higher.
💎Volume is another critical factor to monitor. A rebound from the $0.4787 support level accompanied by strong buying interest could signal a quick bullish reversal. On the other hand, a breakdown below $0.3754 with increasing volume would likely intensify selling pressure.
💎This is a pivotal moment for #SANDUSD, Paradisers. The market is setting up for a decisive move, one that could shake out weak hands before the real trend emerges.
Stay patient, wait for confirmation, and always manage your risk. Trading isn’t about being emotional; it’s about being strategic. Only those who remain disciplined and focused will succeed in the long term.
MyCryptoParadise
iFeel the success🌴
CPOOL on the Brink: Will Sellers Trigger a Massive Drop?Yello, Paradisers! #CPOOL has enjoyed a solid bullish leg recently, but things are starting to look heavy. The price is currently moving inside a major triangle pattern, a typical structure that signals a potential corrective phase. While bulls still hold their ground, there are clear signs that sellers could take control if key support levels are broken.
💎The first major neckline support sits between $0.3800 and $0.3620, and this is where the real battle is happening right now. It’s a critical zone for #CPOOLUSDT, as bulls will need to defend it to avoid further downside pressure. If this level holds, we could see consolidation within the current range, giving bulls another chance to regain control.
💎However, if sellers manage to break through this support, it’s likely to trigger a corrective wave that could push the price toward the next lower support zone between $0.2995 and $0.2850. This region is particularly significant because it aligns with the triangle pattern target, making it a logical area for a reaction. Buyers stepping in aggressively here could lead to a sharp “slingshot” rebound.
💎On the flip side, bulls face a strong descending resistance level at $0.4720, which also aligns with horizontal resistance. This zone will be a tough one to break, and until CPOOL clears it, any bullish moves will remain capped.
Paradisers, this setup is looking very promising—but don’t forget, discipline and patience are key in this market.
MyCryptoParadise
iFeel the success🌴

Bearish Warning for MORPHOUSDT! Is a Bigger Drop Coming?Yello, Paradisers! Could #MORPHOUSDT be setting up for a bigger drop, or is it just a short-term pullback? Let's break it down.
💎#MORPHO recently broke its bullish support trendline, which is a clear bearish signal. However, before we see further downside, there’s a high chance the price will retest the $2.90 to $3.10 resistance zone. This is a key area to watch.
💎If the price gets rejected at that resistance, the most likely scenario is a continued move downward toward the demand zone around $2.30 to $2.20. This demand area may cause a brief pullback, but if it fails to hold, we could see the price drop further to the stronger support zone below.
💎For the bearish outlook to be invalidated, the price would need to break above $3.66 and close a daily candle above it. If that happens, we’ll likely see a bullish continuation instead of further downside.
💎This is a critical moment for MORPHOUSDT. Be patient and wait for confirmation before making any moves. Remember, the market often tricks impatient traders before revealing its true direction.
Stay patient, stay disciplined. The next big move will reward those who wait for confirmation.
MyCryptoParadise
iFeel the success🌴

Is STXUSDT Setting Up for a Big Move? Don’t Miss These Key LevelYello, Paradisers! Is STXUSDT quietly building momentum for a major breakout? Let’s dive into the current market structure to see if we’re on the verge of a bullish opportunity — or if caution is the smarter play.
💎STXUSDT is showing bullish I-CHoCH (Internal Change of Character) and BOS (Break of Structure) on higher timeframes — a good sign that buyers are gaining control. The current retracement adds more weight to this setup, making it an attractive opportunity if we see further confirmation on lower timeframes.
💎The double-bottom pattern forming is another bullish signal. However, instead of jumping in early, it’s smarter to wait for a bullish I-CHoCH confirmation on lower timeframes to increase the probability of success.
💎If we get a deeper retracement or sudden panic selling, our focus will shift to the strong support zone below. This is where we expect a bounce, and once again, we’ll be watching for bullish I-CHoCH on lower timeframes to confirm the reversal.
💎If STXUSDT respects that support, we’re in a good position. But...
💎If the price breaks down and closes a candle below the strong support zone, that will invalidate the entire bullish idea. In that case, we step back and wait for better price action to form. No need to rush — the market will always give more opportunities if you stay patient and disciplined.
Play It Smart, Paradisers! At this point, it’s all about waiting for confirmation and avoiding emotional trades. The crypto market loves to punish impatience, but the disciplined traders always win in the end.
MyCryptoParadise
iFeel the success🌴

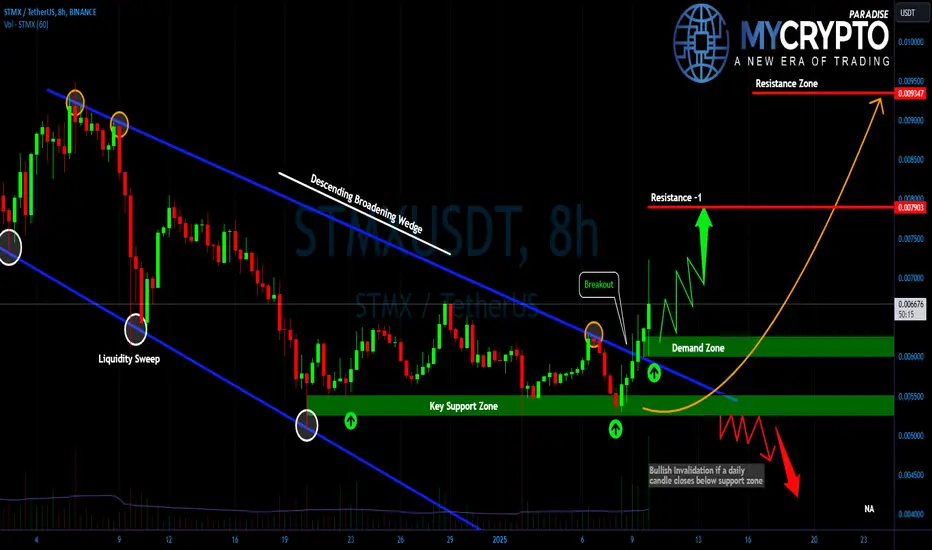
Is #STMX Ready for a Breakout? Don’t Miss This Move!Yello, Paradiser! Are you ready for what’s brewing with #STMX? The setup on the charts could be pointing to a big move don’t miss this critical update!
💎#STMXUSDT is currently displaying a bullish reversal structure that demands attention. A descending broadening wedge, recognized as a bullish pattern, has already confirmed its breakout. Before this breakout, a liquidity sweep near the wedge’s lower boundary suggested stop hunting behavior, a move often followed by significant directional momentum.
💎With the breakout in place, the demand zone between 0.006015 and 0.006256 now plays a pivotal role. This area could act as a springboard for upward momentum, with the price targeting 0.007893as the first resistance level. If bullish momentum persists, the next significant level lies around 0.0093, potentially marking an extended rally.
💎On the downside, if the demand zone fails to hold, it could trigger heightened selling pressure, dragging the price down to support at $0.005270. A close below this level would invalidate the bullish structure and open the door for further declines.
💎Volume remains a critical factor here. A surge in volume would lend confidence to directional moves, while lowvolume breakouts in either direction should be approached with caution, as they are often indicative of fakeouts.
💎The demand zone at $0.006015 offers a logical area for risk defined entries, aligning with the overall bullish continuation thesis. While the current outlook favors a gradual advance toward resistance levels, traders must stay vigilant for potential macroeconomic shocks or sudden market reversals.
Trade smart and keep your focus on the bigger picture!
MyCryptoParadise
iFeel the success🌴
DASHUSDT: Is a Big Move Brewing? Yello, Paradisers! Are we on the brink of a significant breakout or another leg down for DASH? Let’s dive into the chart and uncover what’s next for this coin. Stay sharp this analysis could save you from making the wrong move at the wrong time.
💎#DASHUSDT is currently approaching a key support level around $30.87, a zone that has consistently acted as a springboard for bullish momentum in the past. This level has been tested previously, showing signs of strength. However, if the support fails to hold, it could spark a cascade of selling pressure, potentially dragging the price down to the next lower demand at $25–$26.
💎Currently, the price is under the influence of a descending trendline, with repeated rejections clearly visible. This pattern has kept the bearish structure intact, making a breakout above this trendline a crucial signal for any shift in momentum.
💎A failure to hold the demand zone at $25–$26 could trigger a sharp move downward, leading to bullish invalidation with bearish targets around $16–$20. This would bring #DASH to an untested historical support level and possibly lead to a liquidation event, clearing out weak hands from the market.
💎The RSI, currently in a neutral range, will be critical to watch. A move above 50 on the RSI could support a bullish breakout, while a drop below 40 would reinforce bearish sentiment.
The market is at a tipping point, and taking action without confirmation at this stage could lead to unnecessary losses. Stay patient, disciplined, and wait for clear signals before taking action.
MyCryptoParadise
iFeel the success🌴

CHZUSDT: Bullish Breakout or Breakdown? Key Levels to Watch!Yello, Paradisers! Is CHZUSDT about to break out into a bullish rally, or will the support zone crumble and invalidate the setup? We’re at a critical decision point, and how price reacts at key levels will be crucial. Let’s break it down.
💎CHZUSDT has formed a W-pattern at a key support zone, which is a classic bullish reversal structure. This pattern increases the probability of an upward move, but it still requires confirmation. Without a proper breakout above resistance, the bullish setup remains incomplete.
💎To validate the W-pattern and increase the chances of bullish continuation, CHZUSDT needs to break through the resistance level and close a candle above it. A confirmed breakout at this level would signal strength from buyers and could lead to a significant upward move.
💎However, if the price pulls back instead of breaking out, there’s still hope for the bullish case. In the event of a retracement, we can expect a bounce from the strong support zone. But to increase the probability in our favor, it’s essential to watch for bullish signals on lower time frames. These include an Internal Change of Character (I-CHoCH) or familiar patterns like a smaller W-pattern or an inverse head and shoulders. Seeing any of these will reinforce the bullish outlook.
💎On the other hand, if the price breaks down and closes a candle below the strong support zone, the bullish idea becomes invalid. In that case, it’s better to step back and wait for cleaner price action to form before making any new decisions. It’s never a good idea to force a trade when the market is unclear.
Patience is key here. The market rewards those who wait for high-probability setups rather than chasing moves without confirmation. Discipline and a clear strategy will always keep you ahead.
MyCryptoParadise
iFeel the success🌴

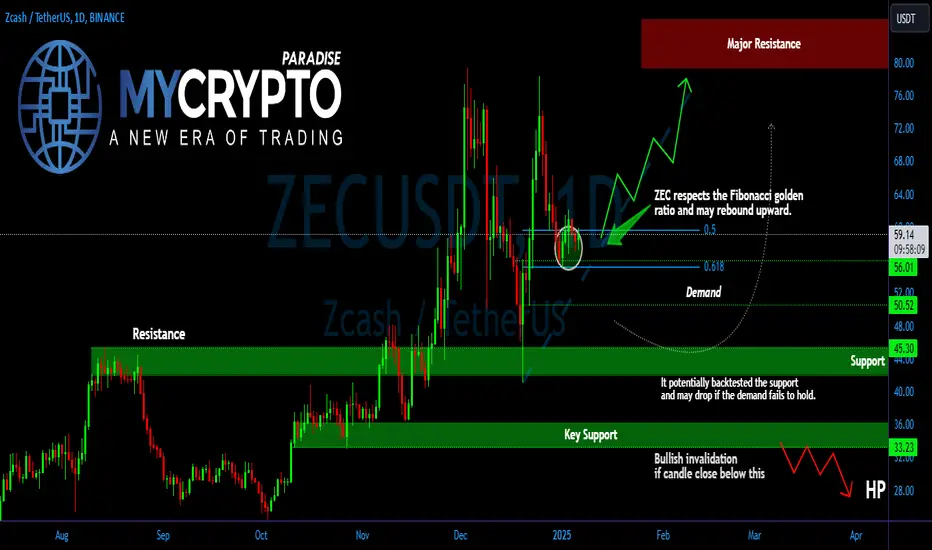
ZECUSDT: Is the Rebound Real, or Are We Heading Lower? Key LevelYello, Paradisers! Are we witnessing a genuine rebound for #ZECUSDT, or could this move be a trap before a deeper correction? Let’s take a closer look at what’s happening and the critical levels you should have on your radar.
💎#ZEC has shown respect for the golden ratio of the Fibonacci retracement, suggesting a potential bounce to the upside. However, the key question is whether the price can sustain above the crucial demand zone between $56 and $50.20. If ZEC holds this level, the upward momentum could continue, with the next target being a retest of the strong resistance area.
💎But what happens if ZEC fails to hold above this demand zone? In that case, the price could drop back to the $45.30 support area, a level that has historically triggered significant rebounds. This zone has acted as a strong base in the past, and it’s likely that any dip toward this level could see buyers stepping in once again.
💎The risk increases if ZEC breaks below this support and closes below $33.20. If this happens, we could see a much deeper correction, potentially pushing the price even lower. A candle close below this level would invalidate the bullish outlook and indicate further downside ahead.
Stay disciplined, Paradisers. Consistency in trading comes from managing risk and staying patient.
MyCryptoParadise
iFeel the success🌴
Is ARCUSDT Gearing Up for a Breakout?Yello, Paradisers! #ARCUSDT has been regaining strength after a corrective phase, showing promising signs of a rebound. Recently, the price formed a double bottom, a bullish pattern that often signals a trend reversal. Momentum is building as the price begins to break above this key structure, setting the stage for a critical test ahead.
💎The spotlight now is on a descending resistance at $0.04120, which has consistently capped #ARC’s upside potential. A breakout above this level could be the game-changer bulls are waiting for, paving the way for a bullish rally targeting $0.0510 to $0.0540. These levels align with moderate resistance zones and the double bottom's projected pattern target, where profit-taking might emerge.
💎If the bullish momentum remains strong, ARC could aim even higher, testing the next major resistance around $0.0630 to $0.0650. This range represents a robust supply zone that traders should keep on their radar.
💎On the downside, the neckline breakout level at $0.0370 to $0.03550 is a critical support zone. Any retest here is likely to attract significant buying interest, bolstered by the protective cushion of the EMA-200 and EMA-100. This confluence adds an extra layer of confidence for bulls preparing for the next move.
Patience and discipline are key here, Paradisers. The market often tests both bulls and bears before making decisive moves, so stay vigilant.
MyCryptoParadise
iFeel the success🌴
