Doge | Big Breakout | Want Perfect Entry? Dogeusdt
Daily Time-frame Breaking Falling Wedfge pattern also look like formed double buttom
Incase of successful Breakout Expecting Massive Bullish Move
Note : Always Manage Risk & Do Your Own Research
Dogeusdtanalysis

Dogeusdt Getting Ready For Bullish Impulse Dogeusdt
Breaking Falling Wedge In Higher Time-frame
Forming Descending Channel In 4h Time-frame
Double Bottom Pattern in 12h Time-frame
Expecting Massive Bullish Move Incase Of Succesful Breakout.
Do Your Own Research | Always Wait For Confirmation

DOGEUSDT likely to hit daily support before moving upDOGEUSDT hast been trending down for a while after getting rejected from the daily resistance DR2 and then DR1. Now it is trading between weekly resistance WR1 and daily support DS1. The likelihood of the price to visit daily support DS1 is high. If the price hits that support, it should have a good bounce from there. A predictive path of the price action for this trade to play out has been depicted on the chart. Lets target first the price to hit DS1 and then we update this idea regarding the long paths of this trade.

DOGE/USDT - Long / Mid Term [LONG]
When the candles pass through the red rectangle (provided that the candles are fixed above the rectangle).
You can apply for a #LONG position.
The possible goals for BINANCE:DOGEUSDT are:
* First Target => $0.11000
* Second Target => ~$0.14000
Important: Always do your own research (DYOR) before buying or selling.

DogecoinHello . Dogecoin currency. be a model. head and shoulders Is it the beginning of the collapse!?

DOGEUSDT heading up for next resistance around 0.08425 zoneDOGEUSDT seems to be showing strength as it started trading above the 4h resistance 1 zone. This opens the path towards 4h resistance 2 zone, The price may follow L1, S2 and L3 path.

DOGEUSDT trading inside weekly support zone but move up likelyThe price is consolidating inside the weekly support zone. I think the price has a higher probability to follow the path indicated in this post. The price is likely to hit first the small support zone marked by path S1 and then follow the path L2 also marked on the chart.

DOGEUSDT heading down towards weekly support areaThe price has hit the second 4h support area and is likely to break it. From the price action it seems that there is a high probability of price aiming towards the daily + weekly support area around 0.08100.

DOGEUSDT ranging between daily resiatnce and daily supportThe price did hit the daily resistance as expected. Though there was repeated retest of the daily+weekly support before moving up and hitting the marked resistance. The price got pushed back by the resistance and currently ranging between the daily resistance and daily support. Where to go from here, I will publish in a new post.

DOGEUSDT heading for daily resistance zoneThe price seems to be heading to daily resistance zone 0.08950 - 0.09250. That resistance zone is definitely going to push price down at least on the first attempt by price to break it. We will see how strongly the price reacts to that resistance level and then reevaluate the probability of price action.

DOGEUSDTDogecoin has recently displayed some promising technical patterns, including breaking through the bearish corner pattern on the weekly time frame and forming a cup and handle pattern, as well as experiencing increased trading volume and earning a high ranking on the website coinglass.com. Furthermore, Elon Musk's continued support for the cryptocurrency has also been a notable factor. Based on these observations, it is believed that there may be a neutral trend currently at $0.09, followed by potential growth in the form of a rally or pump until reaching a specific point B.
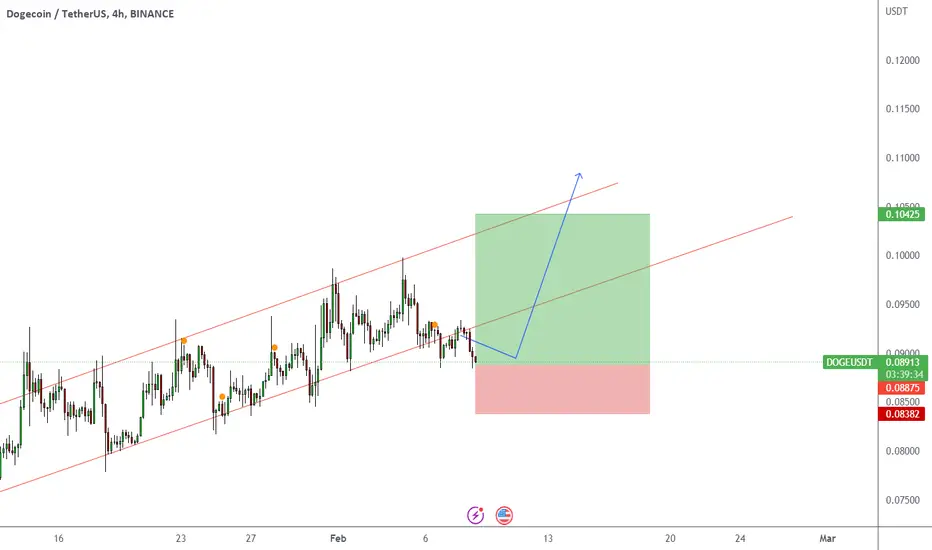
DOGEUSDT bouncing off daily support. Likely to head higher.The price almost hit the daily support area. It will likely move upward now and pass through the above resistance in this go.
Next resistance for this move up would be the monthly resistance range 0.1330-0.13790.
Overall price direction is just depiction of a possible path how it might play out. But the idea of the direction is likely to be this. Anyway, the post will be updated after the first step to tap to weekly resistance has been achieved and a new direction and analysis will be provided.

DOGEUSDT heading for daily supportAs mentioned in the last post, price moved up and touched the weekly resistance before moving down.
Now it seems price might be headed for the daily support region as marked in the chart. This daily support has already been tested after the breakout from that level.

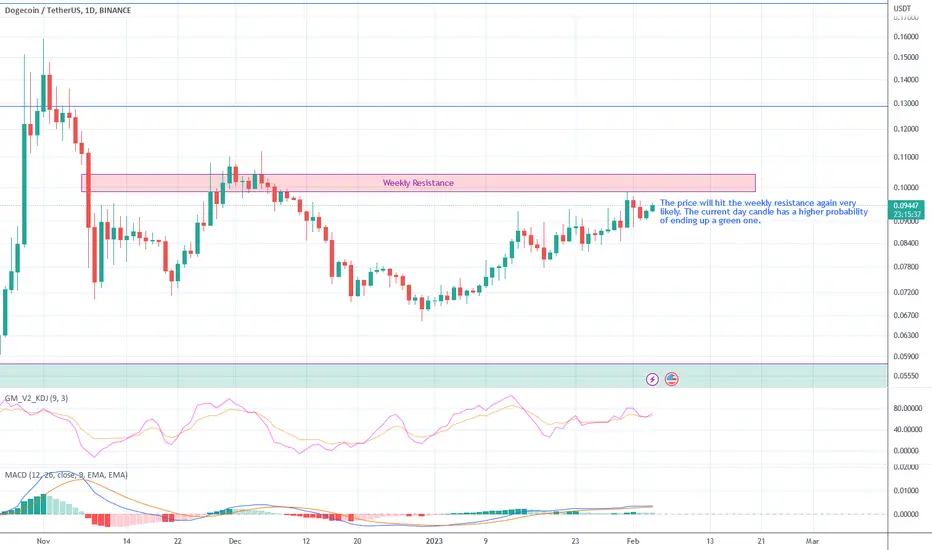
DOGEUSD current 1D candle has a higher probability to be a greenThe price will hit the weekly resistance again very likely. The current day candle has a higher probability of ending up a green one.
Dogecoin - Elon Musk pushed volumes- Elon Musk has planted volumes.
- The level that is 0.92
- The trading triangle (which I highlighted with flags).
- If the market maker does not break the blue flag, it will be a strong buy signal, especially if the bitstock spills and this scam will stand.
if you like the idea, please "Like" it. This is the best "Thanks!" for the author 😊 P.S. Always do your own analysis before a trade. Put a stop loss. Fix profits in installments. Withdraw profits in fiat and please yourself and your friends.

Doge Coin Price Forecast Possible Buy?In this 4h chart of Doge Coin Price Forecast you can see price has broken the resistance level of $0.09 and now it is trying to retest as a support. Possible buying place in my opinion

DOGE/USDT. A bullish wedge was found on the H4 timeframe. A classic pattern that works
well in the crypto market.
Let's enter a small volume into the transaction.

DOGEUSDT: Elliot Price action 4hrHello my friend. I see that we in the "abc" correction and "c" wave move to complete . The 5th wave of "c" be formed and move to downtrend to create .I expected sell/short position at 0.1163

Doge Bullish Cup and Handle, High .10s-.11s possible.Hi Tradingview,
BINANCE:DOGEUSDT
Doge has formed a BULLISH Cup and Handle pattern as we can see. For those unfamiliar with the pattern we can see that the purple highlighted
area makes a cup shape, and the red and blue highlighted area makes up a handle. We can also see a double bottom at the .382 Fibonacci line
I have drawn out support lines in red, and resistance lines in green, also the red box is also a resistance just to clear up any confusion.
I am looking to enter this trade around .1000-.1015 with a stop loss below .098
My take profits are as follows:
TP1: .104786
After this, I will take profit at .10787
Then I will let the rest run

Dogecoin DOGE price will rise But don't expect fast & easy moneyToday we consider the DOGEUSDT price chart
After Musk bought Twitter, he again took up the Dogecoin pumping. Probably wants to sell out profitably, because he did not sell all at the previous manipulations)
He, "by all sorts of truths and lies", hints that Doge will soon be integrated into Twitter.
We would like to warn you that in the coming months, even he will find it difficult to organize a pumping of the DOGEUSD price by hundreds of % upwards, as it was in previous years.
After all, two powerful liquidity zones will be waiting for us above, in which people bought more than a year ago, because they hoped for continued growth, and the price fell and the deposit sank.
Now, when the price will reach the orange and red liquidity zones, those who have been sitting in the drawdown for more than a year will sell their DOGE "by zero" just to get rid of this bondage. This is how human psychology works.
But , if you are patient, you can try to buy Dogecoin in your long-term investment portfolio closer to $0.073-0.083
And then waiting, waiting, waiting...)
_____________________
Did you like our analysis? Leave a comment, like, and follow to get more

DOGE Short 🤫here is Doge analysis where you can get an idea 🚀
Doge shows Triangle lets hit the target 💥
Stoploss is Must

Trading opportunity for DOGEUSDTBased on technical factors there is a Short position in :
📊 DOGEUSDT
🔴 Short Now 0.07850
🧯 Stop loss 0.09741
🏹 Target 1 0.06755
🏹 Target 2 0.05350
💸RISK : 1%
We hope it is profitable for you ❤️
Please support our activity with your likes👍 and comments📝

DOGE Reversal Support we broke down from our triangle , and didn't hold above the 0.11$ that's we we going to test the strongest support above the 0.088$, we should see a reversal there and retest our current resistant around the 0.11$.
any price between the 0.11$/0.088$, is consolidation and accumulation area , if we broke the resistant we enter a bull run again, if we broke the support we enter a bearish moment down .
