DXY Dollar Index: Approaching reversal pointDXY Dollar Index
Long Term
We've been aggressively bearish of the Dollar since that first
break below 98.5 back in early May last year. Down another
11% since then it's coming time finally to think about reversing
back long again soon. DXY has already hit and bounced from
the support line at 88.44. Below here lies a long term dynamic
support line which has effectively stalled all Dollar declines
since 2011. It lies at 87.70 and even if DXY suffers one last
decline from here it should halt at 88.44 and at absolute
worst at 87.70 during the course of this week - we should see
the final low put in this weekcoming , and likely by the
following week at latest if we don't hit the bottom this week.
Look to close out most shorts across the dollar pairs into this
final selling climax if we see it materialise over the next few
days. Swing traders should now, finally, be looking to follow
suit too.
DXY Shorter Term
Last week DXY made a new low at 88.44 before bouncing 1%
to 89.51 resistance line with a high at 89.53...The 88.44 level
is one of two likely levels to look for a reversal in trend, the
other being the longer term dynamic support line, at 87.70
now. If the first level is to be the reversal point DXY will
continue rallying from here and not break below the tiny
rising dynamic directly under price right now...then comes
the bigger test: it has to break above the upper parallel and
break 89.53 and then hold on the retest - that would flip DXY
back to near term positive and send it back to 92.62 and the
falling dynamic resistance line shown on the chart above,
where it's next major challenge will most likely lie. Follow
that break if we see it materialise at any point this week
Downside
If in the alternative DXY loses the little dynamic holding it up
and then falls below 88.88 it will fall back to 88.44 again and
if it cannot base there and make a double bottom it will fall
away to the second key level at 87.70 - at which point it
should start to find some support. If so start closing out dollar
shorts and look to build longs from here. Otherwise, the
safer/less risky option for swing traders is to forget about
bottom fishing wait to see at what point DXY finally exits the
upper parallel of this impulse wave - which has, so far,
controlled all upside potential for DXY throughout this
current down-wave - and follow that break when it eventually
comes, looking for 92.60 initially.
Dollar-index

US DOLLAR INDEX -> 87.62 - 87.78 = TURNING POINT?Is it time for the US Dollar to start regaining its strength?
Strictly judging by my own technicals I'm seeing a potential reversal point around the 87.62-87.78 range where we see a strong confluence of a the 50.0% Fib retracement and 161.8% Fib extension.

The deceptive US DollarThe DXY has found some support following a recent dramatic fall. This seems more like a retracement in a primary downtrend rather than a reversal and I wouldn't go long at this point unless:
1. it breaks through the major resistance line and stays above it AND
2. breaks through and stays above the supply zone

DXY weekly target to 84 DXY is still running in down channel, it will drop to 84 level to seek support, if fail, next target will be 76.

Dollar Index AnalysisMy outlook on the TVC:DXY , negative USD News really hurt the dollar, we can expect some sort of a pullback or price can continue dropping. we'll have to wait longer in the week to find out

US INDEX - GLOBAL FORECAST 2018Hello Traders!
Accurately suppose, that the "Flat" model and Bull's "Cumulation Balance", will be on US index the whole 2018 year.
So... Based on intermarket correlation, it gives the opportunity for downtrend on EURUSD, GBPUSD, AUDUSD, NZDUSD and uptrend for USDJPY, USDCAD,USDCHF.
Best regards, team traders ''Powerful Traders".

Dollar Index AnalysisPatiently waiting on the daily gap to be filled. Strong biais on the downside but will be wise to wait on your trading system to give you a sell signal.

DXY Dollar Index Trying to put up a stand at 91.76 supportDXY Dollar Index
The Dollar Index has fallen to the next blue line of support
91.76 after an intra-day low at 91.75. It's trying to hold here.
It's still trapped in a near term downwave and struggling to
escape. It's already made one attempt to escape the down-trend
and is trying again now. There are pins forming below the low
and above it too on the 2 hour chart, denoting conflict/confusion
here. For the bulls to win some respite they need to force
DXY above 91.95 and hold it there (and no lower than 91.92
on a retest once 91.95 is taken) to attract more buyers up to
92.05-92.12 range where DXY will likely turn back down again.
For DXY to show it's turning back up from that point it will have to
take back 92.12 and then turn 92.04 into support when tested
from above. Will need to see something like this kind of price
action to convince that DXY has more upside to 92.49-92.55
On the downside the next support below 91.76 lies at 91.52 with major support/maximum likely downside target at 91.02. A move below any blue line by more than a couple of pips is likely to trigger further weakness back to the next one.


DXY Dollar Index Trying to Base hereDXY Dollar Index Update Near Term Neutral but Dollar Trying to Base
DXY did come off from where it was meant to last week but
has put up more than just a fight so far in the 92.74-92.50
range. The fight back was to be expected, but it's doing
better than envisaged so far here - and these conclicting
signals urge caution now ...no interest in getting involved in a
battle of whipsaw here but will look to back the winner again
here when one emerges...DXY has gapped up today, double
bottomed and left a pin bar lying around in the space
between the two blue lines of fixed support shown on
chart...bullish signals. But it's still trapped within the
parallels which are trying to force price lower. Something has
to give here soon. ...A break above the upper parallel would
be the next bullish signal from DXY - look to get long DXY on the
next retest of the parallel from above, once broken to upside,
and get long USDEUR and short Gold on this development too.
On downside DXY has to stay under the upper parallel for the
bears to keep control from here - then they have to force DXY
down to fill the gap today at 92.89 and then push it below
92.55 again for DXY to turn negative again from here. As it
stands the bears are beginning to lose this battle, not enough
fire-power to force DXY lower from here by the look of the chart.
Early hours of this battle, still, but increasingly the bulls are
beginning to wrest back control here. Confimation will come
when the upper parallel is broken and survives the next retest.
At that point we look to short gold (if signals there are not
already given) and get long USDEUR.

DXY: Dollar Index Update DXY Dollar Index Update
The limit of DXY strength was meant to be 93.49 - it was
actually 93.51. Close but no cigar.
That should be it for the dollar rally now. It should start
falling away down to 91.05 but will likely put up a fight at
92.74-92.50 range as it declines. Good for Gold from here -
look to buy on weakness (next comment)
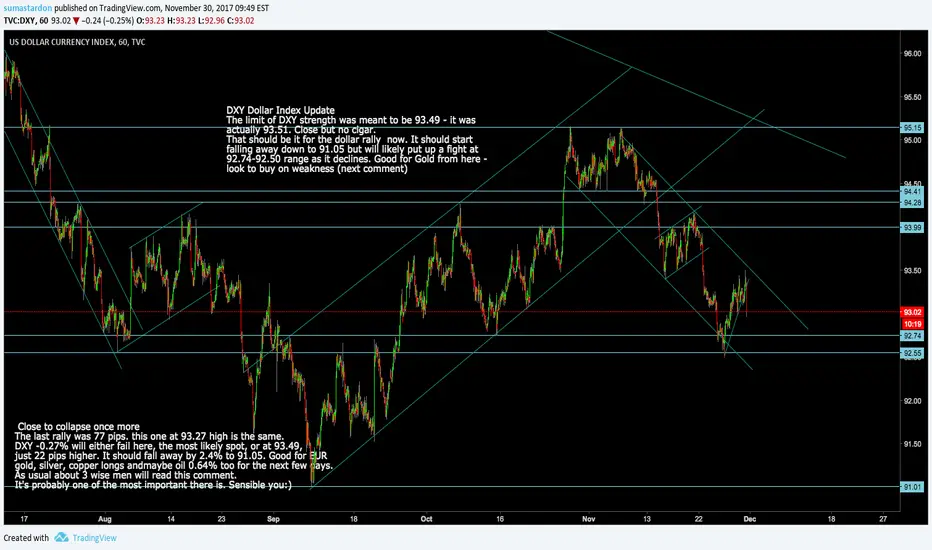
DXY Dollar Index Close to collapse againDXY Dollar Index Close to collapse once more
The last rally was 77 pips. this one at 93.27 high is the same.
DXY will either fail here, the most likely spot, or at 93.49, just
22 pips higher. It should fall away by 2.4% to 91.05. Good for EUR
gold, silver, copper longs and baby Alts who need a break and
maybe oil too for the next few days. Asusual about 3 wise
men will read this comment.
It's probably one of the most important there is. Sensible you:)

Dollar Index: DXY Update and Key levels for next breakDollar Index: DXY
So far DXY is displaying precisely the kind of technical price
action you'd expect of something in the process of breaking
down lower...the tiny continuation pattern with a bearish
upwards slope, every move contained within the parallels that
control this inverted flag formation. The dollar will try to rally
from the lower parallel of the flag so we need to step off the
gas around now if shorting USD across the pairs. Contrarians
may look to go long USD again here but be careful if you
do...at some point soon DXY is going to fail, breaking below
the lower parallel - the point to go aggressively short USD
again and to go long Gold once more, looking for 92.62 on DXY
and 1305 on Gold.

USD Index - Advance Into Resistance ExpectedWe start the week with price having rejected from the previous area of resistance turned support at 94.030 and is now looking to test next key resistance at 95.270. Next major resistance to the upside after 95.270 sits at 96.695.

USD Index - Breakout Hints At Further AdvancesWe start the week with the USD Index above key resistance of 94.030 hinting at further advances in the USD Index. A pullback and re-test of the 94.030 will provide a great chance to look for Bullish formations and patterns towards the target and next key area of resistance at 95.270

DOLLAR INDEX DXY DAILY BUY IDEADollar Index Daily chart - I see a buy opportunity here for dollar pairs from this level we can also see a pull back is due on monthly chart. Daily structure is also bullish

DOLLAR READY FOR BULL RUNINDEX:DXY
USD ready for bull run after failing to close below support and forming reverse H&S
Looking for long opportunities coming into the new year.

Gold Rollover expectedTVC:GOLD
Gold closed below 1300.00 and is expected to rollover. Will be looking for short opportunities

USD Index - Breakout Of Resistance Hints At Further AdvancesWe start the week with the USD Index above key resistance at 93.455 leading to a Bullish bias in this market next week. A failure of resistance would pave the way for a re-test of support at 92.635 however as long as we remain above 93.455 we will only be looking for longs in the USD Index next week.


USD Index - Inverse Head & Shoulder BreakoutThe USD Index confirmed the breakout of the Inverse Head & Shoulder pattern last week clearing the way for further advances towards the 93.635 and 94.630 areas of resistance to the upside. A re-test of the broken resistance area of 92.565 turning support would provide a great area to look for long opportunities. Advances in the USD Index should drive USD Strength across the board next week.
