#DOT/USDT#DOT
The price is moving within a descending channel on the 1-hour frame, adhering well to it, and is heading for a strong breakout and retest.
We are seeing a bounce from the lower boundary of the descending channel, which is support at 4.40.
We have a downtrend on the RSI indicator that is about to be broken and retested, supporting the upward trend.
We are looking for stability above the 100 Moving Average.
Entry price: 4.43
First target: 4.50
Second target: 4.57
Third target: 4.64
DOTUSDT

PolkaDot DOT Has Just Confirmed The Huge Reversal!Hello, Skyrexians!
Recently we made analysis on BINANCE:DOTUSDT where pointed out that the reversal is likely, but not confirmed. Now we have the reversal signal even on weekly. Moreover, we know that you don't like DOT and argue when we draw the unbelievable targets. Toady we will show you the realistic one.
Let's take a look at the weekly chart. We can see two confirmed green dots on the Bullish/Bearish Reversal Bar Indicator . Moreover there bars have the great angle with the Williams Alligator. Even if we will not count Elliott waves it's enough to have an idea that bull run is starting now. The realistic target is located at 0.61 Fibonacci zone approximately at $30-$35.
Best regards,
Skyrexio Team
___________________________________________________________
Please, boost this article and subscribe our page if you like analysis!

DOT - Time to buy again!The price has formed a Triangle on the 4h time frame, and if it breaks out, it can drive the price up to around $6 .
Give me some energy !!
✨We spend hours finding potential opportunities and writing useful ideas, we would be happy if you support us.
Best regards CobraVanguard.💚
_ _ _ _ __ _ _ _ _ _ _ _ _ _ _ _ _ _ _ _ _ _ _ _ _ _ _ _ _ _ _ _
✅Thank you, and for more ideas, hit ❤️Like❤️ and 🌟Follow🌟!
⚠️Things can change...
The markets are always changing and even with all these signals, the market changes tend to be strong and fast!!

#DOT/USDT#DOT
The price is moving within a descending channel on the 1-hour frame, adhering well to it, and is heading for a strong breakout and retest.
We are seeing a bounce from the lower boundary of the descending channel, which is support at 4.22.
We have a downtrend on the RSI indicator that is about to be broken and retested, supporting the upward trend.
We are looking for stability above the 100 Moving Average.
Entry price: 4.30
First target: 4.37
Second target: 4.46
Third target: 4.57

DOT/USDT: Consolidation Expected After Recent Bounce The DOT/USThe DOT/USDT market has recently rebounded from a previously tested level from November. Following this bounce, the price appears to be forming an ABC pullback, moving towards the channel boundary.
Historical price action shows that the market has consistently respected the resistance zone, reinforcing the prevailing bearish trend. Given this setup, the market is likely to enter a consolidation phase, with price stabilizing within the 4.88 to 4.00 range. The next key target lies at the support zone around 4.100

DOT/USD "Polkadot vs U.S Dollar" Crypto Market Heist Plan🌟Hi! Hola! Ola! Bonjour! Hallo! Marhaba!🌟
⚔Dear Money Makers & Thieves, 🤑 💰✈️
Based on 🔥Thief Trading style technical and fundamental analysis🔥, here is our master plan to heist the DOT/USD "Polkadot vs U.S Dollar" Crypto market. Please adhere to the strategy I've outlined in the chart, which emphasizes long entry. Our aim is the high-risk Red Zone. Risky level, overbought market, consolidation, trend reversal, trap at the level where traders and bearish robbers are stronger. 🏆💸Book Profits wealthy and safe trade.💪🏆🎉
Entry 📈 : "The vault is wide open! Swipe the Bullish loot at any price - the heist is on!
however I advise to Place buy limit orders within a 15 or 30 minute timeframe most recent or swing, low or high level. I Highly recommended you to put alert in your chart.
Stop Loss 🛑:
Thief SL placed at the recent/swing low or high level Using the 4H timeframe (3.800) swing trade basis.
SL is based on your risk of the trade, lot size and how many multiple orders you have to take.
Target 🎯:
🏴☠️Target 1 - 4.700 (or) Escape Before the Target
🏴☠️Target 2 - 5.600 (or) Escape Before the Target
🏴☠️Target 3 - 6.600 (or) Escape Before the Target
🧲Scalpers, take note 👀 : only scalp on the Long side. If you have a lot of money, you can go straight away; if not, you can join swing traders and carry out the robbery plan. Use trailing SL to safeguard your money 💰.
DOT/USD "Polkadot vs U.S Dollar" Crypto Market is currently experiencing a bullish trend,., driven by several key factors.
📰🗞️Get & Read the Fundamental, Macro Economics, COT Report, On-Chain Analysis, Sentimental Outlook, Future Trend Move:
Before start the heist plan read it.👉👉👉
📌Keep in mind that these factors can change rapidly, and it's essential to stay up-to-date with market developments and adjust your analysis accordingly.
⚠️Trading Alert : News Releases and Position Management 📰 🗞️ 🚫🚏
As a reminder, news releases can have a significant impact on market prices and volatility. To minimize potential losses and protect your running positions,
we recommend the following:
Avoid taking new trades during news releases
Use trailing stop-loss orders to protect your running positions and lock in profits
💖Supporting our robbery plan 💥Hit the Boost Button💥 will enable us to effortlessly make and steal money 💰💵. Boost the strength of our robbery team. Every day in this market make money with ease by using the Thief Trading Style.🏆💪🤝❤️🎉🚀
I'll see you soon with another heist plan, so stay tuned 🤑🐱👤🤗🤩


PolkaDot DOT Has a Chance, But Still In Danger!Hello, Skyrexians!
Recently we have already made analysis on BINANCE:DOTUSDT before the dump, where pointed out that wave 5 to the downside ahead. Asset has finally reached the minimal target at $3.8 and now we have a question if it's going to reverse or $2 is next.
Let's take a look at the daily time frame. We can see the Elliott waves structure and wave 5 can be finished anytime now. Our best practice to find the reversals is the green dot on the Bullish/Bearish Reversal Bar Indicator and the divergence with Awesome Oscillator. Now we can see all these conditions, but bullish reversal bar is still unconfirmed, while it's high is going to be broken, the danger will be melted, but now we still have a chance to go down.
Also wanna notice the false signals on the indicator. All of them are placed inside the range and cannot be counted as valid. Take it into account when use it.
Best regards,
Skyrexio Team
___________________________________________________________
Please, boost this article and subscribe our page if you like analysis!


DOTUSDT at a Make-or-Break Level – Big Move Incoming?Yello, Paradisers! Is DOTUSDT on the verge of a breakout, or will the bears crush the momentum? Read on this is a critical moment!
💎#DOTUSDT is showing strong bullish momentum, bouncing off the demand zone above $4.582, signaling that buyers are stepping in and defending key levels. The market structure remains favorable for the bulls, but a crucial test is ahead.
💎The price is trading above both the 50 EMA and the 200 EMA, which is a strong indication that the uptrend is intact. Volume is increasing near demand zones, suggesting that buyers are actively supporting the price. This reinforces the strength of the trend, with green candles showing a strong buying push and minimal wicks, indicating low selling pressure.
💎If POLKADOT successfully breaks and holds above $5.00 with strong volume, the next upside target is $5.30, a major resistance zone. A decisive breakout here could open the door for an even stronger rally. However, if DOT fails to break $5.00 and retraces, the lower demand zone at $4.465 will be a key area to watch for a potential bullish rebound. A close below $4.215 would invalidate the bullish setup and shift momentum in favor of the bears.
Patience is key, Paradisers! If we see a confirmed breakout, we act. If not, we wait. Discipline is what separates traders from gamblers. Stay sharp and trade smart! 🎖
MyCryptoParadise
iFeel the success 🌴

Polkadot 8X Trade-Numbers (6,280% Potential)One is theory, the other one is practice.
One is the analysis and the other one the numbers.
Technical analysis and trading numbers.
Here we go again with Polkadot (DOTUSDT). This time around we are not focusing on the analysis but the full trade-numbers for a leveraged trade. Still, let's consider the chart briefly and what it has to say.
The black lines... Previously, the black lines showed the drop and the incoming bear-market. High prices and All-Time High = bearish. A long-term double-top, the highest ever, led to the strongest ever bear-market.
Now, the black lines signal support. The market bottom. All-Time Lows and bottom prices = bullish. A long-term accumulation phase with higher lows will kick off the next bullish market. We are in, we are live and we are green.
The market moves in cycles and within this cycles we have waves...
We are going from a neutral, sideways market to a bullish market. The neutral sideways market produces the same highs and the same lows. The bullish market will produce higher highs and higher lows. This is were we are going next.
Notice that we use lower targets for the leveraged trades compared to spot trades. This is because leverage carries higher risk. We are happy with a win and with big profits but not greedy. In this market, greed will get you killed. Financially speaking.
Full trade-numbers below:
____
LONG DOTUSDT
Leverage: 8X
Entry levels:
1) $4.60
2) $4.30
3) $4.40
Targets:
1) $4.92
2) $5.62
3) $6.77
4) $7.70
5) $8.63
6) $9.96
7) $11.6
8) $14.66
9) $16.52
10) $19.53
11) $21.68
12) $24.41
13) $32.30
14) $40.19
Stop-loss:
Close weekly below $4.00
Potential profits: 6280%
Capital allocation: 4%
____
Disclaimer: I love you and I am deeply grateful for your continued support.
You are a diving human being, you can do whatever you want.
It is your life, it is your body, it is your money, it is your soul.
Trade, drink, eat, sleep; it is your choice.
Namaste.


Polkadot Crypto- nothing will happen until we break this channelPolkadot has been in a descending channel for quite some time now. No bullish action can occur until this channel breaks either up or down.
If it breaks down $3.6 is a major support that will probably be bought heavily
If we break out and close above $5.75 altcoin season has probably begun.
Remember first bitcoin goes up, then big marketcap alts like Ethereum, Solana, XRP, BNB. Next are the medium cap alts like chainlink, LTC, and polkadot.
If polkadot is able to release Polkadot 2.0 there could be a a lot of hype and maybe polkadot can reach all time highs but thats only if the altcoin market pumps into 2026 otherwise JAM speculation will hit as the altcoin bear market begins.
Exciting price action to come.

DOT Reaching Oversold Levels – Buy the Dip?DOT/USDT is currently trading within a well-defined range, with a key support zone around $3.50 - $4.00 and a major resistance zone near $10 - $11. The price has bounced multiple times from support and faced repeated rejections at resistance, highlighting a strong consolidation phase.
The Stochastic RSI is oversold, indicating that a potential reversal from support could be in play. If buyers step in at this level, DOT may attempt another move toward the resistance zone.
DYOR, NFA

#DOT/USDT#DOT
The price is moving in a descending channel on the 1-hour frame and is expected to continue upwards
We have a trend to stabilize above the moving average 100 again
We have a descending trend on the RSI indicator that supports the rise by breaking it upwards
We have a support area at the lower limit of the channel at a price of 4.50
Entry price 4.60
First target 4.72
Second target 4.85
Third target 4.99

Polkadot 2025 Bull-Market: Long-Term Accumulation Zone ActiveThis is one of the easiest trades to take.
Polkadot (DOTUSDT) is now activating a long-term, bottom range, support and accumulation zone. Each time this price range becomes active what follows is a bullish breakout.
Here is the interesting part. This zone was first activated in late 2022, as part of the previous bull-market correction or bear-market.
In 2023 we had the recovery year so the growth period was very small compared to 2021. 2024 is the same, the "initial bullish breakout" and this is very small compared to 2021 and what happens now, 2025.
2025 is different. 2025 is bull-market year and goes in the same proportion with 2021 but much higher.
Why would 2025 end up producing much higher prices compared to 2021 rather than the same levels? Because the market is bigger now. Because the market is evolving and everything that is related to Cryptocurrency is being globally accepted. There are so many positive developments that it is hard to mention but let's give it a try.
The USA is now favorable towards the Cryptocurrency market. This might be the biggest development of all. Other countries that were unfavorable are following the USA and changing their policies.
Many countries are considering a "Bitcoin reserve." Unique dynamics developing now.
There are many new companies, many new projects and global adoption continues to expand. Crypto is now mainstream and legal all across the world.
This can make the 2025 bull-market the biggest bull-market in the history of Crypto. If it doesn't, well, prices are going up and that's more than enough for us to be bullish and to go LONG.
Polkadot is now going bullish. Prices will go literally off this chart.
We will visit the 2025 ATH potential in a new publication.
If you want the information now, you can always visit my profile and type DOTUSDT.
Thanks a lot for your continued support.
Let's trade together long-term.
Namaste.


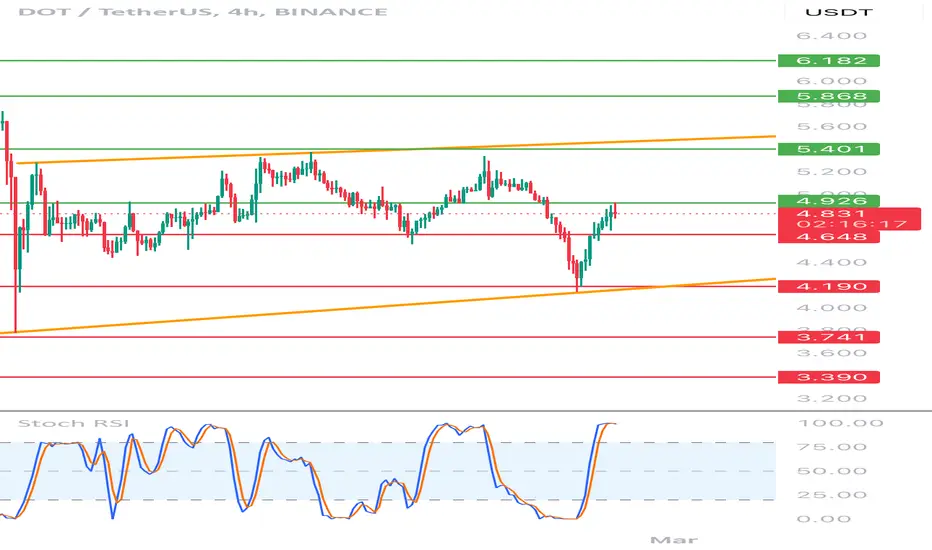
DOT/USDT 4H chart reviewHello everyone, let's look at the 4H Dot chart to USDT, in this situation we can see how the price moves in the local growth trend channel. However, let's start by defining goals for the near future the price must face:
T1 = $ 4.93
T2 = $ 5.40
Т3 = $ 5.87
T4 = $ 6.18
Let's go to Stop-Loss now in case of further declines on the market:
SL1 = 4.65 $
SL2 = 4.19 $
SL3 = $ 3,74
SL4 = $ 3.39
Looking at the RSI indicator, you can see the traffic above the upper limit of the range in the place where the price relief could be observed earlier.
PolkaDot DOT Needs To Crash More Hello, Skyrexians!
As you know, globally we are very bullish on BINANCE:DOTUSDT and our previous analysis on the weekly time frame is still valid, but locally it still has not reached the bottom. Current value of fear and greed index is extreme fear and it will not allow DOT to drop immediately, some bounce is anticipated, but after that bears can take control again.
Let's take a look at the daily chart. We can suggest you this Elliott waves counting, may be it's not 100% correct, but the only one thing we need to know. The drop, which we have seen on February 3 was the wave 3 according to minimum Awesome Oscillator value. While it has not crossed zero line price is in wave 4. Yesterday we had a chance to finish this night mare, but price is pumping again and it looks like it's going to reach $5.50 max and then continue printing wave 5 to the final target $1.9-$3.2. The key points for reversal is the appearing of green dot on Bullihs/Bearish Reversal Bar Indicator and divergence on AO.
Best regards,
Skyrexio Team
___________________________________________________________
Please, boost this article and subscribe our page if you like analysis!

DOT Eyes 170% Breakout as Nasdaq Sets to List Grayscale PolkadotPolkadot (DOT) is on the verge of a massive breakout as institutional interest in altcoin-based exchange-traded funds (ETFs) gains momentum. With Nasdaq officially submitting a filing to the U.S. Securities and Exchange Commission (SEC) to list and trade shares of the Grayscale Polkadot Trust (DOT), the stage is set for DOT to witness significant capital inflows, potentially driving a 170% rally.
Nasdaq Files to List Grayscale Polkadot ETF
The cryptocurrency investment landscape is undergoing a major shift as traditional financial institutions increasingly embrace digital assets. In a recent filing, Nasdaq submitted Form 19b-4 to the SEC, requesting approval to list and trade shares of the Grayscale Polkadot Trust. If approved, this move will provide investors with a regulated and institutional-grade avenue to gain exposure to DOT.
Grayscale Investments, the asset management firm behind the proposed ETF, has been aggressively expanding its crypto product offerings. Alongside the Polkadot ETF, the firm has filed for a spot Cardano ETF and an XRP Trust conversion. Other potential digital asset ETFs, including those tracking Solana (SOL), Dogecoin (DOGE), and Litecoin (LTC), are also being considered.
This filing follows a broader trend of growing institutional interest in crypto ETFs. In late January, asset manager 21Shares also applied for a spot Polkadot ETF, signaling heightened confidence in DOT’s long-term potential. The SEC now has 45 days to review Nasdaq’s application, after which it can approve, deny, or extend the decision-making process.
Technical Indicators Signal a 170% DOT Breakout
As of the time of writing, Polkadot is trading at $4.40, up 1.4% on the day. The technical outlook for DOT presents a highly bullish scenario, with the asset forming a textbook falling wedge pattern—a historically reliable setup that has preceded major upward price movements.
A closer examination of DOT’s price action reveals striking similarities to its March 2024 trading pattern, where the token surged 170% following a breakout from a similar wedge formation. Historically, DOT has exhibited a strong tendency to rally after breaking out of falling wedge patterns, making this a key inflection point for traders.
Momentum indicators further reinforce the bullish outlook. DOT’s Relative Strength Index (RSI) currently sits at 37, indicating that the asset remains in oversold territory with significant upside potential. With buyer accumulation increasing and selling pressure waning, DOT appears poised to capitalize on this dip before an explosive breakout takes place.

Polkadot - Macro VisionAs you can see, we have a macro range in construction.
The new Higher was very little low from the previously, but the good think its the Lower its higher from the recent one, so about this we have good and bad signs.
In that case, we need to wait for mor clarification, 1st that we need its a new Higher High on 4h tf, until that, we can retest demand zone like in 4 november, ant thats not good at all beacause will be to much pressure for the buyers , they acctually stressed a lot because a lot of them, didnt sell what they'v accumulated in the first Low from last year so, they are kind of desperate now for the liquidity and a new low can activate them to sell in loss , also because under 3.5 , there is a chance to visit 1.8 , and that means another -50% for their bags.
Offcourse, this is the bearish scenario.
The bullish one is that we have on daily a rejection from demand zone, this zone was bought very fast from buyers so , we need to see a recovery, a fast one to add optimism in market. Also , everyone , one month ago said that February its a bullish month , and this time looks different so, many of theese investors, now , are confused a lot. A bullish weekly close can activate them again , but until then, they will be very precaute.
My case: Im bullish bettwen 3.5 and actual price for accumulaton on SPOT.
On trading , i will not do nothing for now.

DOT ANALYSIS📊 #DOT Analysis : Update
✅There was a formation of Falling Wedge Pattern on daily chart🧐
We could expect a bounce from its major support zone.
👀Current Price: $4.930
🚀 Target Price: $6.400
⚡️What to do ?
👀Keep an eye on #DOT price action and volume. We can trade according to the chart and make some profits⚡️⚡️
#DOT #Cryptocurrency #TechnicalAnalysis #DYOR
