Time to long - RSI is above 60, this is a bull signal for my strategy.
- Price is above 200 EMA.
- There is a clear Reversal head & shoulder pattern.
If all works, we're ready to go.
TP1 and TP2 are on chart.
Follow Red trend line for SL ( follow 4h close price)
Dowjonesindustrial

Dow sell. Lower high post breakoutHere we have a lower high on the 1hr chart on the dow after a breakout of the rising wedge on the daily. Nice engulfing pattern too on the 1 hr candle. Its currently trading above the 200HMA but with all other moving averages are crossed under so its good value for a short here. We could expect some selling pressure here in overbought territory and a test in the first instance of the rising trend line and maybe lower. 4 Hr 200MA is still sloping downwards and daily MA's are still bearish. I'l be looking to scale out some profits at the rising trend line and a break of the swing low on the hourly charts.

DJI ideaH&S within a rising wedge on the hourly. Higher high has not been made and a reversal candle has formed on the hourly (Confirmed on the 15 min)

#Dow30 - 1929 vers. 2020? #US30USD #DJIIn 2020 everything went much faster than in 1929 but could the Dow30 go through the same structure?
If in 2020 the A = C becomes the same as in 1929, then the Dow still has room for 25,558 points in the short term.
Maybe the Dow will do something completely different and climb to new all-time highs, because everything is only half as bad and the world is back to the "old" on Monday and everything is back to normal.
However, this structure should be observed more intensively at least in the coming weeks.
Greeting
Stefan Bode
#Dow30 - 1929 vers. 2020? #US30USD #DJI

dow slow down !Here u can see price isoving in decending chanel, where risk reward ratio might great.
and you can think to buy put,for short term.
close down to 50 ema ,and rsi divergin is showing downtrend,as well mass index .

DJI may face the greatest crash..... DJI had broke down from the 200EMA. Base on Fibo 1.618 the target is in the range of the yellow box, coincidentally collide with the historic support...jobs are loss from all over the world...not just USA alone. Prepare for the worst...

Dow Jones Index Mark UpToday we're analyzing the US30!
Bias: Neutral
I would like to start off by saying that I'm in the middle due to me leaning more bearish than bullish. Why? Price Action is rallying back towards the high end of the curve where an untouched HTFZ ($27325-$29594) is waiting, but on the other hand I'm bullish with P.A's current movement for obvious reasons. I would expect price to repel off the PPZ ($24561) only to find support underneath at the continuation zone ($23197-$23634) and from there to print new HLs & HHs.
Confluence *Bull's Favor* (3 or more):
1. Interesting Price Action activity around the $18000 level. *Let me know what you think about this one*
2. Order Block formed ($20607-$25149) right before breaking above PPZ ($22127).
3. Price Action closed above Weekly 200MA. Significant.
4. Bullish Order Block formed ($23197-$23634) right below Weekly 200MA. Massive support.
5. 'V' shape return. *If unaware of this pattern be sure to research it*
I'm more bullish IF there's a B.A.R. of the $29594 level, but if price manages to reach the Order Block at the high end of the curve then expect it to be there for a minute considering it's size. We shall see.

US30 DOW JONES ANALYSIS DJI BUY OR HUDGElook at this magnificent bullish divergence with confirmation of the breakout of the RSI50 and the breakout and correction on the FIBO 50%
Very tight stop loss and TP1: 25018 TP2: 25698
possibility of hudge

Dow ready to come back to earth! The market has been rallying on positive news of antivirals and re-opening the economy. Could this be the time to go short. Is this rally over? I think so. To me it seems reasonable to believe that we will either retest the lows or make new lows and follow this EW pattern that I have outlined.

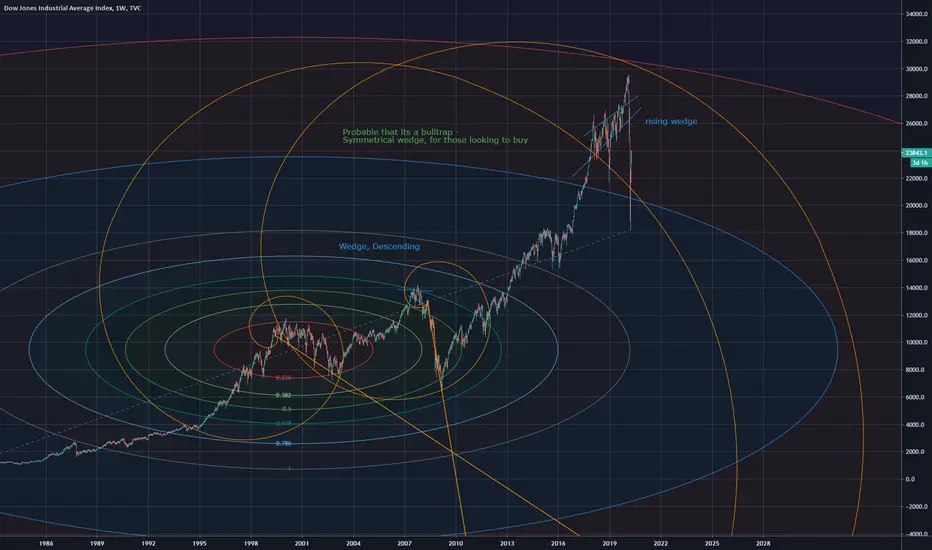
Dow Jones Fibonacci SpiralsInteresting Dow fib spiral showing three bottom points, will the symmetrical wedge be a bulltrap? we will see.
Wall Mart vs Dow : Bottom Indicator to watchWall Mart NYSE:WMT is making new all time highs - interesting to monitor the WMT / DIA ratio as a potential long term equity lows indicator. Close but still not there.

Dow Jones - Macro OutlookWelcome to the first of my macro market ideas. My goal is to have a post for each market sector to give you a long term perspective of the given asset class, so that you are able to drill down to smaller time frames and make wise and calculated trades.
The Dow Jones Industrial Average has market data on TradingView going all the way back to 1915. Since the Dow is the most mature index for US stocks, it is inherently the market leader. Having a long term grasp on where the Dow Jones is headed will tell you where we are in the market cycle, and help you understand when it is a good time to long or short stocks.
I will update this thread on a monthly and sometimes weekly basis with my current perspective on where price is headed.
While there are many political and economic factors that impact the Dow, I will do my best to keep this thread purely technical in nature.
Please feel free to leave a comment below with any questions at all. I am happy to answer.
Best Regards,
Micah J Miller

Dow Jones counter trend rally might reach 25300 Dow Jones remains bearish against 29600 levels in the long run and the recent counter trend rally should not be mistaken as an uptrend. The earlier drop between 29600 and 18200 was an impulse, labelled as Wave (1) or (A). Ideally, a 5 wave move is followed by a corrective 3 waves in the opposite direction. The rally since 18200 lows is corrective, A-B-C and has managed to retrace up to 50% of the earlier drop. A potential Wave (2) could be in place around 23700/800 levels or it could reach fibonacci 0.618 retracement around 25300. Either ways, Dow Jones is looking to terminate Wave (2)/B around current levels or a bit higher before resuming Wave (3)/(C) lower again.
Strategy:
Sell between 23800 and 25300, stop above 29600, target below 18000.
Legal Disclaimer: This article is not investment advice. The data provided is for marketing material purposes and is not intended to confuse nor guide our clients on trading decisions. Any investment activity performed is perceived to be a self-directed decision. Exclusive Markets is not liable for losses that may occur because of a decision made after reading the information published on our research page or any other media.
Risk Warning: Trading the capital markets is risky therefore further knowledge and experience may be required. Apply appropriate risk and money management always and ensure the implementation of safe leverage.


Dow. H+Shoulders. DivergenceDivergence on the dow hourly MACDH. Possible head and shoulders, watch out for a fakeout breakout

Daytraders, Are You Ready? (DJI)Symbol: DJI
This post is for all the day trading junkies out there. I am showing the 30 min time frame with a cross over to the downside. If I double that timeframe and go to the hourly, I'm at a tipping point in thr market. We would enter to short till 30 min and hourly line up to go back to the upside. We are putting our money on red. We will watch closely on the market open . If we see a change in our indicator and strategy than we will have to play break to top. But, for the most part we are short here.
----------------------------------------------------
Want to level up your trading skills?
We just realesed our new course! Follow our tradingview page and visit the link in our bio if you are looking for new strategy to add to your arsenal.
Also checkout our trading indicator available in the link on our page.
---------------------------------------------------
Thank you for your continued support, God bless.
- Major League Trader

DOW JONES in 2020?This chart is the Dow divided by the Unemployment rate of the U.S.
I'm not sure if this means anything or not, but it is interesting to look at. I immediately picked out a wedge.... and a gloomy looking one too...
October 2020 anyone?


Dow JonesSymbol: DJI
Who said major recessions couldn't be predicted?
Buy green
Sell red
I'm just sayin.... 🤫
----------------------------------------------------
Want to level up your trading skills?
We just realesed our new course! Follow our tradingview page and visit the link in our bio if you are looking for new strategy to add to your arsenal.
Also checkout our trading indicator available in the link on our page.
---------------------------------------------------
Thank you for your continued support, God bless.
- Major League Trader

Dow JonesSymbol: DJI
Could be an opportunity to short monday.
We will have to wait and see on the open.
Be prepared.
----------------------------------------------------
Want to level up your trading skills?
We just realesed our new course! Follow our tradingview page and visit the link in our bio if you are looking for new strategy to add to your arsenal.
---------------------------------------------------
Thank you for your continued support, God bless.
- Major League Trader

Long Dow I have a buy order at 22550 on Dow, RSI shows strong rebound and last huge rejection was under 22500. Let's see what happens :)

DOW JONES - DJI - critical junctureDJI declined 23% in the first quarter of the year. This was the worst first quarter in 135 years of history of the index. In the next two days we may have a clearer reading if DJI is already in an intermediate wave 3 down that should be more disastrous than the first wave down from February or if DJI is finishing a minor wave B that would have a minor wave C up as the next move. Keep tuned ! FOLLOW SKYLINEPRO TO GET UPDATES.

Dow Jones Futures Rally Into ResistanceThe Dow Jones is currently up nearly $840(3.9%) to $21,785 after holding at the 23.6% Fib level upon futures market open last night. Price is currently testing the downtrend resistance line which for now is still acting as price resistance. This move comes as President Trump and VP Pence had an upbeat tone during Sunday evening’s press conference while touting declines in new cases and deaths reported out of New York and Italy which appears to be giving traders hope that the worst is over. Earlier in the weekend the next two weeks were referred to as our “Pearl Harbor” and “9/11” moment as the Surgeon General said to prepare for the worst in new cases and deaths in the U.S. Traders appear to still be trading from news headline to news headline rather than the big picture while ignoring the coming earnings apocalypse and what is expected to be another massive unemployment claims data release on Thursday. Futures markets have not been a good indication of what to expect during actual spot market trading lately so all eyes are on the Wall Street open and whether or not traders can push price above the downtrend resistance line and from there the 38.2% Fib level as those are the two key resistance levels that price needs to beat in order to break the bearish trend in price.
