ENDING DIAGONAL : ELLIOTT WAVE ( ELLIOTT BABA)ENDING DIAGONAL : ELLIOTT WAVE ( ELLIOTT BABA)
Ending diagonals consist of 5 waves, labeled 1-2-3-4-5. Each wave subdivides into threes. Waves 1 and 4 overlap in price. Wave 3 can not be the shortest among waves 1, 3 and 5. Wave 1 is usually the longest, but not necessarily. Wave 5 of an impulse and wave C of an A-B-C correction are the places, where you should be looking for an ending diagonal. Since it is the final movement of the sequence, after an ending diagonal prices are expected to go back to the level, where the pattern had started. A real-life example of an ending diagonal with all its features is given on the chart of AUD/USD below.
Ending Diagonal

Bitcoin technical analysis (bearish, weekly)Bitcoin shows major signs of weakness at this moment on the weekly chart. We have a bearish divergence on the RSI indicator, which cannot be ignored. Also, we have a shooting star candle, which is probably the most bearish candle that exists in the price action. This bearish candle will be confirmed if we break the low of it, which is 41500.
How deep can bitcoin dive? There are 2 major supports on the weekly chart. The first is the POC of the previous market structure in confluence with the strong liquidity point at 36707 (stop losses of others). The second support is the start of the major gap at 34025. If these 2 support fail for some reason, the next support would be 28000, which is the end of the major gap.
I am bearish on Bitcoin, and this is my current outlook on the weekly chart. Let me know what you think about my analysis, and please hit boost and follow for more ideas. Trading is not hard if you have a good coach! Thank you, and I wish you successful trades.

Solana, another 100% pump in the next weeksSolana is very bullish. The uptrend is strong, and continuation to the upside is very likely because the ascending parallel channel holds the current price. I do not want to see a breakdown below this channel because that would be a very bearish sign on the other side. From the Elliott Wave perspective, we need to complete the impulse wave 12345. I am expecting a final wave (5) with a 100% profit in the next few days or weeks. Let me know what you think about my analysis, and please hit boost and follow for more ideas. Thank you, and I wish you successful trades!
Solana is a highly functional open source project that banks on blockchain technology’s permissionless nature to provide decentralized finance (DeFi) solutions. While the idea and initial work on the project began in 2017, Solana was officially launched in March 2020 by the Solana Foundation with headquarters in Geneva, Switzerland.
To learn more about this project, check out our deep dive of Solana.
The Solana protocol is designed to facilitate decentralized app (DApp) creation. It aims to improve scalability by introducing a proof-of-history (PoH) consensus combined with the underlying proof-of-stake (PoS) consensus of the blockchain.
Because of the innovative hybrid consensus model, Solana enjoys interest from small-time traders and institutional traders alike. A significant focus for the Solana Foundation is to make decentralized finance accessible on a larger scale.

AVAXUSDT| Wave Projection| Potential Ending Diagonal 5-WaveTFD Wave Analysis / Projection - 5 wave ending diagonal pattern? Normally the opposite of previous wave if wave 1 was ABC uptrend, the correction could be 5 wave down
> A potential 5 wave pattern correction downtrend bullish scenario with 5-3-5-3-5 pattern after finishing uptrend ABC wave pattern 5-3-5
> 1-wave - 5 wave downtrend correction retraced previous ABC uptrend or major 1 wave at 0.5 fibonacci level
> 2-wave - ABC uptrend retraced 0.786, 3-wave extended 1.272 of 1-wave, and currently making 4-wave at 0.5-0.618 of 3-wave at falling channel / 50MA resistance but should not rise beyond 2-wave.
> The projected 5-wave downtrend at the target previous DOUBLE TOP pattern expected at 0.5 - 0.786 extension of 3-wave, making a false breakdown with a bullish divergence signal.
Long Entry: 200MA re-breakout zone after the bullish divergence in TFD

Bitcoin - bearish divergence on the weekly chart (RSI)Bitcoin does not look good on the RSI indicator on the weekly chart. We have a bearish divergence! This is one of the strongest bearish signal that can occur on the bitcoin market. Also, Elliott Wave impulse (3) is complete. We are ready for wave (4) correction. Let me know what you think about my analysis, and please hit boost and follow for more ideas. Thank you, and I wish you successful trades!
What is divergence?
Divergence refers to a situation when a currency pair price diverges from the trend that the technical indicators are showing. So if the technical indicators are making a lower high but the currency pair price witnesses a higher high, it indicates that there is a price divergence in the market.
What is a bearish divergence?
In a bearish divergence, the currency pair prices make a new high in the market, but technical indicators mark a lower price. This signals that bulls in the market are no more in control and bears are getting stronger, indicating a bearish reversal after the uptrend ends. At this point, traders can place short orders to benefit from the decreasing market prices.

Bitcoin is ready to go higher, next pump is comingBitcoin is still bullish and is ready to go higher! My ultimate target is 48600 USD, which should be hit probably very soon. What is really important for the price is that the blue horizontal line must hold for the continuation - the price is currently above it. From the Elliott Wave perspective, we need to finish the last wave 5 of the impulse wave. Let me know what you think about my analysis, and please hit boost and follow for more ideas. Thank you, and I wish you successful trades!
Historical facts about Bitcoin:
Bitcoin’s original inventor is known under a pseudonym, Satoshi Nakamoto. As of 2021, the true identity of the person — or organization — that is behind the alias remains unknown.
On October 31, 2008, Nakamoto published Bitcoin’s whitepaper, which described in detail how a peer-to-peer, online currency could be implemented. They proposed to use a decentralized ledger of transactions packaged in batches (called “blocks”) and secured by cryptographic algorithms — the whole system would later be dubbed “blockchain.”
Just two months later, on January 3, 2009, Nakamoto mined the first block on the Bitcoin network, known as the genesis block, thus launching the world’s first cryptocurrency. Bitcoin price was $0 when first introduced, and most Bitcoins were obtained via mining, which only required moderately powerful devices (e.g. PCs) and mining software. The first known Bitcoin commercial transaction occurred on May 22, 2010, when programmer Laszlo Hanyecz traded 10,000 Bitcoins for two pizzas. At Bitcoin price today in mid-September 2021, those pizzas would be worth an astonishing $478 million. This event is now known as “Bitcoin Pizza Day.” In July 2010, Bitcoin first started trading, with the Bitcoin price ranging from $0.0008 to $0.08 at that time.
However, while Nakamoto was the original inventor of Bitcoin, as well as the author of its very first implementation, he handed the network alert key and control of the code repository to Gavin Andresen, who later became lead developer at the Bitcoin Foundation. Over the years a large number of people have contributed to improving the cryptocurrency’s software by patching vulnerabilities and adding new features.
Bitcoin’s source code repository on GitHub lists more than 750 contributors, with some of the key ones being Wladimir J. van der Laan, Marco Falke, Pieter Wuille, Gavin Andresen, Jonas Schnelli and others.

Ethereum is bullish and expecting a 27% riseEthereum is very bullish, in my opinion. We see that the price went below the parallel channel, but there is no bearish follow-through. In my opinion, this is a bear trap, and we will continue to go higher. 27% pump is my net target; take profit at the top of the trendline, as you can see in the picture. The good news is that the ABC correction has been completed successfully. It is starting, guys. Let me know what you think about my analysis, and please hit boost and follow for more ideas. Thank you, and I wish you successful trades!
Ethereum has pioneered the concept of a blockchain smart contract platform. Smart contracts are computer programs that automatically execute the actions necessary to fulfill an agreement between several parties on the internet. They were designed to reduce the need for trusted intermediates between contractors, thus reducing transaction costs while also increasing transaction reliability.
Ethereum’s principal innovation was designing a platform that allowed it to execute smart contracts using the blockchain, which further reinforces the already existing benefits of smart contract technology. Ethereum’s blockchain was designed, according to co-founder Gavin Wood, as a sort of “one computer for the entire planet,” theoretically able to make any program more robust, censorship-resistant and less prone to fraud by running it on a globally distributed network of public nodes.
In addition to smart contracts, Ethereum’s blockchain is able to host other cryptocurrencies, called “tokens,” through the use of its ERC-20 compatibility standard. In fact, this has been the most common use for the ETH platform so far: to date, more than 280,000 ERC-20-compliant tokens have been launched. Over 40 of these make the top-100 cryptocurrencies by market capitalization, for example, USDT, LINK and BNB. Since the emergence of Play2Earn games, there has been a substantial increase in interest in the ETH to PHP price. Let me know what you think about my analysis, and please hit boost and follow for more ideas. Thank you, and I wish you successful trades!

CHFJPY: Thoughts and Analysis Today's focus: CHFJPY
Pattern – Ending Diagional
Support – 167.50
Resistance – 169.40
Hi, and thanks for checking out today's update. Today, we are looking at CHFJPY on the daily chart.
Today's video asks if CHFJPY will continue to move lower after breaking out of an ending diagonal pattern. These patterns are seen as reversal patterns. We have broken down the trend structure and what we are looking for to see a confirmation of the pattern.
The Key for us will be move-through support. If Sellers fail at support, look for a new move back through resistance, which could cause a failed pattern trend continuation.
What do you think? Could this be a reversal?
Good trading.


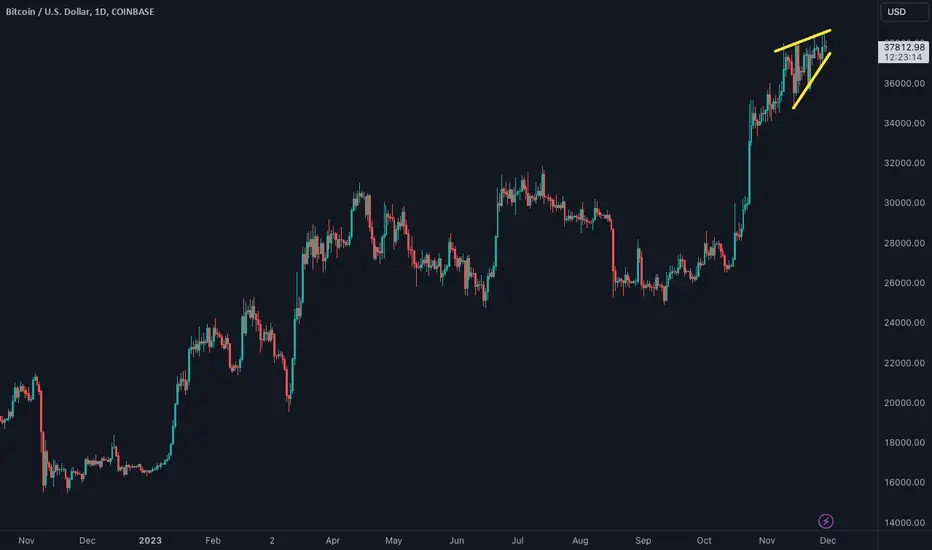
ending diagonal pattern ?bitcoin price are up this year
gold collapsed two times this year in big way but bitcoin has been very strong
if ending diagonal lower trend line breakout then you can say trend has peaked
Gold's price is squeezing into 2065 +/-. 27/Nov/23XAUUSD. Beware of major reversal when its price getting tightened toward major resistance/ liquidity zone @ 2065 +/- as its price probably forming an ending diagonal pattern /structure.

Aussie can be bottomingAussie is bearish since the start of the year, with a higher degree A-B-C decline with wave C coming to an end as the price turns out of a wedge pattern this week, after the FOMC policy announcement yesterday. It looks like pair completed the ending diagonal so more gains should follow. Well, from an Elliott wave perspective and minimum objective, I think that recovery can be in three waves at least back to former wave (4) to 0.6530 area.

Topglov new quarter result was worse than last quarter? 1/Nov/23Topglove''s latest "quarterly" report "disappointed" again. Not just "investors", "traders" are "hardworking" individual as well who do check their positions not just "quarterly" but everyday beside reading on each stock's Intrinsic value, ROE, P/E, Forward Free Cash Flow, Profit Margin etc "quarterly" OR reading "market news" "once a while"...

Ending Diagonal As Wave C?As nerely a perma-bear, I post this that could be merely a copium.
Just a memo.
If it seems this is valid, I will elaborate on it later.

BTCUSDT 5th wave downward of an ending diagonalAccording to my wave count, BTCUSDT is finishing an 5th wave expanded in an ending diagonal to complete wave 5 of the actual bearish impulsive wave of this cyclical bear market.


BNBUSDT Price, time & divergences.As a update about my current bear position on CZ coin as you can see by the link below.
The price action is heading one leg downward to complete a wave 5 of a contracting ending diagonal, according to the Wave Principle. That seams a breakdown can be expected to the local demand, as we can see clearly on this chart. After broken, the trendline tends to be retested. All my projections are displayed.
Technicals:
* Chaikin Money + 100EMAx100MA cross;
* ESCGO_LB;
This H4 chart is showing a lot of correlations about price, time and divergences on Chaikin Money Flow in in conjunction of 100EMA & 100MA moving averages crossover plus regular and hidden divergences, which is my system I've used to finding turn-points. If in parallel with RSI, is possible to note a lot of divergences that only Chaikin oscillator can display.
* In addition, an ABCD reciprocal (0.886:1.128) projection as an alternative projection.

BTC Update.This count is based on my assumptions so anything can happen not a trading or financial advice just for educational purposes only kindly do your own ta thanks trade with care good luck.

MY THOUGHTS ON GBP/USDIn my analysis on the 2 HOUR CHART, price is moving BEARISHLY, forming a Barrier Triangle Ending Diagonal. Price is currently at 1.25498, I forecast that Wave A may move to price 1.23957 which is 100% of Wave A. Then to price 1.23013 which is 1.50% of Wave A. and finally to price 1.22800 which is 1.618% of Wave A. I used the Elliott Wave and Fibonnaci for my analysis. FX:GBPUSD


SPX 500 Futures: Analyzing Price Movements and Predicting TrendsAs a trader, keeping an eye on market trends and understanding how to interpret them is crucial to making informed decisions. In this article, I'll explore the price movements of the S&P 500 (SPX) futures since the beginning of February 2023. Whether you're a beginner or an intermediate trader, this analysis will provide insights into the market's behavior and hopefully help you make better decisions for your portfolio.
The Roller Coaster Ride: February to March 2023
At the beginning of February 2023, the ES futures hit a high near 4200, marking the start of a steep decline. The descent was impulsive, and prices dropped to almost 3800, stopping short by about 30 points. There are two ways to interpret the downward movement: either as a 5-wave structure or a 3-wave structure. The choppiness and overlap of the moves make it difficult to determine the exact structure, but one thing is clear: a significant bottom was reached around March 13, 2023, the same date as the bottom in 2020 .
The Rebound and the Big Question
Since that bottom, the ES futures have rebounded, practically returning to their starting point at 4200. Now, we face a critical question: what happens next? From a trading standpoint, it appears that we're in a rising wedge , forming an ending diagonal with multiple 3-wave structures. If the lower trendline is breached, the market could be on its way to testing 4000, or even lower . However, if the upper trendline is broken and the market surpasses 4200, a slow grind up to 4300-4500 is possible, although I'd give it a 20% chance at this point.
Key Trendlines and Moving Averages
Beneath the current market level, two significant trendlines exist . The first, originating from the October lows, sits around 3925 , while the second, from the COVID-19 lows, hovers around 3775 . Interestingly, the latter trendline coincides with the 200-week simple moving average .
Making Bets: Bull or Bear?
Regardless of whether you're bullish or bearish, it's evident that the market is in a compressing wedge , which will eventually break in one direction or the other. The decision you need to make is whether to place your bets now or wait for a break to occur. It's worth noting that while the market has risen significantly, it could fall just as quickly. Conversely, after a challenging 2022 for investors, the market could continue to rise. The key to longer-term upside potential lies in the VIX, which needs to stay below 20 for the slow grind rise .
By examining the recent history of the SPX 500 futures and their current position within a compressing wedge, you can better prepare for potential shifts in the market. Whether you choose to place your bets now or wait for a break, staying informed and adaptable is crucial to successful trading.


Swing trade about to happen on CZcoin BNBUSDTBNBUSDT is about to finish the 5th wave of a contracting ending diagonal. 12% drawdown can be expected as illustrated on this 1D chart. Price action on intraday below volume POC.
According to my wave count, BNBUSDT is likely to be enter in a 5-wave swing-downward correction to made a lower low amid 160 USDT price @ least extending down 1.618 from the ABCD reciprocal harmonic pattern displayed.
In a Wickoff method perspective, the price tends to enter in a SOW phase, breaking-down this triangle structure, but a rally of relief can be expected as a potential growth of BTCUSDT for the next month open.
Oscillators:
*Fisher Transform;
*ESCGO_LZ (smoothed stochastic);
*Chaikin Money Flow.
This strategy was published for an educational study of the cycles of BNBUSDT market. You can see more of my progression on this short position by my previous posts.
