Trading Engulfing bars or Outside barsDefinition: An engulfing bar is a bar whose trading range totally encompasses or engulfs that of its predecessor such that it has a higher high and lower low. They develop after both down- and uptrends and represent exhaustion. They could be bullish engulfing bars which close higher than the open, or bearish engulfing bars which close lower than the open. A bullish engulfing bar forms at bottoms while a bearish engulfing bar forms at tops. Below is a gold chart illustrating a bullish engulfing bar. Notice how it has a higher high and lower low.
Determining the significance of engulfing bars: The following factors are used to determine the significance of an engulfing bar. If at least 3 points are satisfied, I consider the setup a high probability one.
1. The wider the engulfing bar is relative to the preceding ones, the stronger the signal: This arises from that fact that the engulfing bar or outside bar is supposed to reflect a change in the balance between buyers and sellers.
2. The sharper the trend preceding the engulfing bar, the more significant the bar: This is because the engulfing bar represents change, therefore there must be something to change. Therefore, the stronger the preceding trend, the stronger the implied sentiment dominating that trend.
3. The more bars encompassed, the better the signal: In most situation, only one bar is encompassed. However, when it encompasses several bars, the signal that the balance has shifted from buyers to sellers at a top, or from sellers to buyers at a bottom, becomes that much stronger. The encompassed bars become a small price pattern in themselves.
4. The nearer the price closes to the extreme point of the bar that is away from the direction of the previous trend, the better: For example, if the previous trend was down and the price closes near the high, this is more favorable than if it closes near the low, and vice versa. This is because the engulfing bar is supposed to signal a reversal in the sentiment and a change in trend. The fact that the closing in this example develops near the high emphasizes the strength of the buyers, thereby adding to the validity of the signal. Note: If the close develops near the high in a rising trend or near the low in a falling trend, then the engulfing bar is not consistent with a change in psychology. In this case, it has become a consolidation, and not a reversal pattern. Notice the same gold chart that had a huge rally. See how it closed near its high.
5. The engulfing candle should be of the opposite color from the candle it engulfs.
An important question to ask yourself when considering any bar pattern is: “What is the price action of this bar telling me about the underlying psychology?”
Note: Not all engulfing patterns result in a reversal in trend. Some, for example, may be followed by a change in trend which can be seen after a pullback as price consolidates or has a correction. In this case, the engulfing pattern becomes a continuation pattern.
Sometimes, after an engulfing bar is signaled, price can do a retracement before continuing in the direction indicated by the engulfing bar. This usually gives low risk and higher risk:reward ratio but this occasions are rare and if the retracement is more than 50%, then it is a case for concern.
How to trade engulfing bars: Use pending orders.
1. Place a pending order a few pips above the high of the bullish engulfing bar and a few pips below the low of a bearish engulfing bar.
2. Stop Loss (SL) is safely a few pips beyond the opposite end of the engulfing bar. That means, if a bullish engulfing bar, a few pips below the low of the bar, and if bearish engulfing bar, a few pips above the high of the bar. This strategy gives the trade room to breathe.
3. The take profit (TP) should be on the next key level of support and resistance, or when a candlestick reversal pattern opposing the position is found.
Example 1: Where to set entry parameters for a bullish engulfing bar.
Example: Where to set entry parameters for a bearish engulfing bar.
Engulfingpattern

Short opportunity on AUDJPY with bearish engulfing barA bearish engulfing bar has formed at the resistance of the AUDJPY on 4Hr. The bearish engulfing pattern has momentum behind it as it is reversing a sharp uptrend that shows signs of exhaustion. Good trade. Have to watch it though because there might be some traffic along the way down.
Place pending order according to entry strategy. Use due risk and money management.

LTCUSD may be bearishHead & shoulders might be forming now (but still unconfirmed: must close below the neckline). Some other bearish indications we can see in the chart ("old" resistance, engulfing bearish pattern etc). I would not buy now.
Visit my site lookintotrade.com for:
- free articles!
- trading software
- trading ideas

EURNZD Sell SignalEURO has rejected to break the key resistance level against Kiwi. Besides, it has created a Bearish Engulfing Bar which is a sure sell signal that can be supported by any technical indicator to pull the trigger. I would recommend the H1 timeframe to pull the trigger.

NZDUSD [SHORT]Hello traders,
EP: 0.59700
+ Trendline breakout
+ Fibonnaci 50% level retracement + Bearish engulfing candles
+ Monthly support breakout
+ MACD bearish
Comment bellow what your opinion is on this pair!!
+ Follow me to stay updated on my setups

LTCUSD At The UTL With Bullish Engulfing CSFLitecoin looks almost identical to Ethereum,its at the up trendline with a bullish engulfing candlestick formation.
go back to my ETHUSD post to see more in depth why I like this setup

SPX500: Engulfing Candlestick Pattern on Daily ChartAs we can see, the SPX500 price created engulfing candlestick pattern.
We can see how the last trading day engulfed the previous one.
It indicates for reversal opportunity.
I'll look for sell position at 3318.00 zones.
The first target will be the support level below and the final target is the demand at the bottom.

ETHUSD - Building out a bullish bottoming patternETHUSD continues to throw small bullish signals as price meanders around the 120-140 area. Just reading the price action tea leaves we can see that price was able to break above the strongly bearish trend line a few days ago. There have been numerous attempts at breaking back below this trend line but each time it has been rejected. At least on two of those occasions price has strongly bounced off of the trend line and produced a bullish engulfing bar. The next step to watch for a potential bottom to be in place is price to break and hold above the overhead resistance level of around 137.
While it's not wise to go long during a strong bear market for short term trades, if you are in this for the long term then this may give some confidence a bottom is finally forming. But as I have said before, this market still has a lot to prove.


2nd trade with my new strategyI am currently testing my new wngulfing strategy, i have confirmation and trend support so im not just looking for engulfing pattern and trading off of this.

Engulfing Pattern+ COnformations(classified4now)IF 12:00 Candle will be green
and as long as the green candle before(prefrrably smallre than the engulfing bullish), i will buy after 12:00
I am currently testing new strategy.

AMBUJACEM LOOKING BEARISHAmbujacem trading in a triangle pattern and made bearish engulfing candle
BELOW 214 MAY TARGET 197--190--185

GBYJPY Weekly AnalysisLooking to short GBYJPY . Reason : Bearish Engulf Candle on weekly TF and price already break support level 139.450.
Selling point at 139.445
FX_IDC:GBPJPY
TP1 : 138.692
TP2: 138.200
TP3: 137.905
SL : 140.300

Rebound1)Long term support-turned-resistance; towards the long term trend.
2)Spinning top candles, engulfing candles.


USDCAD Long bounce on trendline with Bullish engulfingDate Pair Direction Trade Trend Level Signal Entry
2019-10-22 USDCAD Long Counter Trend Side Dynamic Engulfing break

Why EUR USD will continue its upward trend? EUR/USD closed below 1.1120 with a
bearish engulfing graph. The graph has
not been confirmed, as long as it does
not close below this graphical low, the
currency pair has the possibility of going
up. The pair can close between 1.1120
and 1.1185 in the following week, so it is
expected to continue its upward trend.
Key levels to focus
Support: 1.1000, 1.0900
Resistance: 1.1120,1.1185

BITCOIN MASTER CHART #10Finally here is the # 10!
Yesterday we saw a capital increase in the crypto world, important projects are developing towards decentralization.
Here we see a BULLISH ENGULFING, the market has been in a strong downtrend, the first candle is bearish, the second is bullish, the bullish candle is bigger than the first. This pattern is a clear reversal signal.
Stay tuned for more updates ;)

GBPJPY - Engulfing on Supply Level - SELLHi traders,
I found an engulfing candlestick pattern confirmation on a supply level. I take a SELL trade on this.
I place a SL just above the high of the confirmation candle.
Entry: 134.244
SL: 135.908
TP: 128.106
On the way to the target are 2 weak demand levels, bur I belive they get broken. I'm giving daily updates on that trade. Stay tuned!
Please always use proper money management!
I recommend a max. risk of 2%

Trade Ideas Position: EURJPY 5-0A Bullish 5-0 pattern staging for a bigger trade setup. An opportunity for me to engage on a longer-term trade, however, I do need a bullish engulfing candle to close to engage.
Do note tomorrow is a non-farm payroll data release. Traders who aren't comfortable should wait out for the news and usually, I will engaged 15-45mins after the release of non-farm payroll.

GBPJPY Engulfing Bullish Candlestick.Im using monthly timeframe and I've spotted a double bottom formation with resistance and support has the unfinished W shaped which could be a good buy from this position.

EURUSD Long counter trendAmazing trading activity today.
I got out of my short on EURUSD with 2R profit as ECB lowered interest rates to be even more negative.
Absolute madness if you ask me, but I will trade it happily, while I buy physical could.
Anyway, right after I was out of the trade EURUSD rallied higher forming a huge engulfing candle.
I will be looking to trade this countertrend entering on the 50% retrace of the candle.
Fundamentally lower interest rates should mean downward pressure on the euro, but then again, it is total madness.
I trade it as I see it. The fundamentals may play out over a longer period.
Date Pair Direction Trade Trend Level Signal Entry
2019-09-12 EURUSD Long Counter Trend Down Static Engulfing retrace

AUDUSD Long on bullish engulfer on supportDate Pair Direction Trade Trend Level Signal Entry
2019-09-03 AUDUSD Long Counter Trend Down Horizontal Support Engulfing retrace

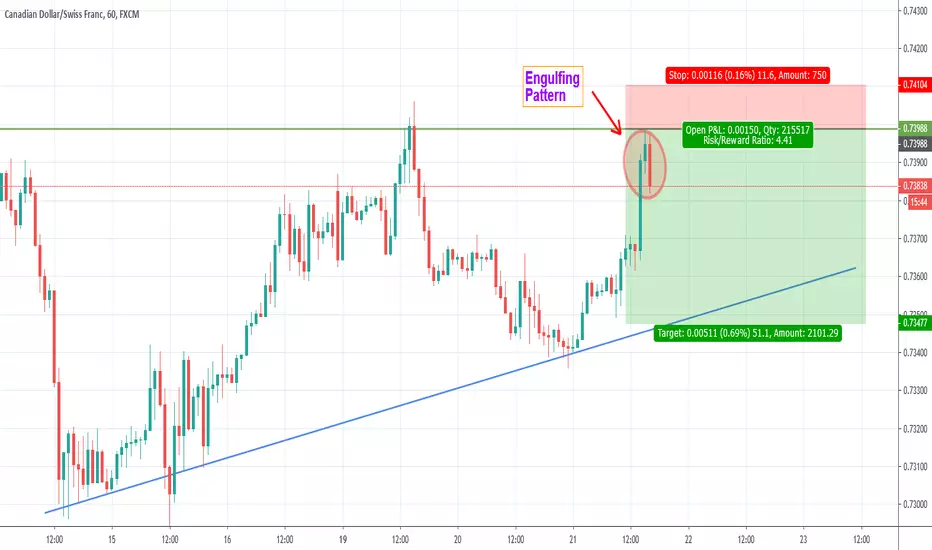
CADCHF - Pullback Trade (Engulfing confirmation)Hi Traders!
As you can see the market was very bullish in the last few candles.
Now it reached the resistance and formed the engulfing pattern.
So, when this candle closes, we have our confirmation to sell.
Thanks and good luck!