belive or not ... ETC gonna make +500% profits 🚀 🚀right now as we can see ETC confirmed a first breakout for the last resistance it bounced from , we can see a daily candle will be closing above it.
however let us take a look on the situation from a longer time, we can realize that ETC is not a garbage coin as we all thought it was just consolidating for a huge movement in 2021 !
as per the chart the main resistances hasn't been broken yet since the bullish cycle started which indicates for amazing potential will be coming out , ETC will be exploding remember my words
MIDTERM SIGNAL TRADE
✅ Buy: 16.70 - 18.30 ✅
🎯TARGETS:
1- $22.25
2- $36.00 (WILL BE REACHED IN APRIL 2021) - take profit for small portion maybe 15% - 20%
3- $61.57 (take profit for 40% - 45%)
4- $106.0 (take profit for 30% - 35%)
5- $122.1 ( preferable not to wait, small possibility to reach there before 2022 )
💵 Trade Size: 7% - 10% of Portfolio
🚫Invalidation(SL): daily candle close below $10
Please click LIKE button and Appreciate my hard work.
Must follow me for latest crypto real time updates.
thank you
Etcusdlong

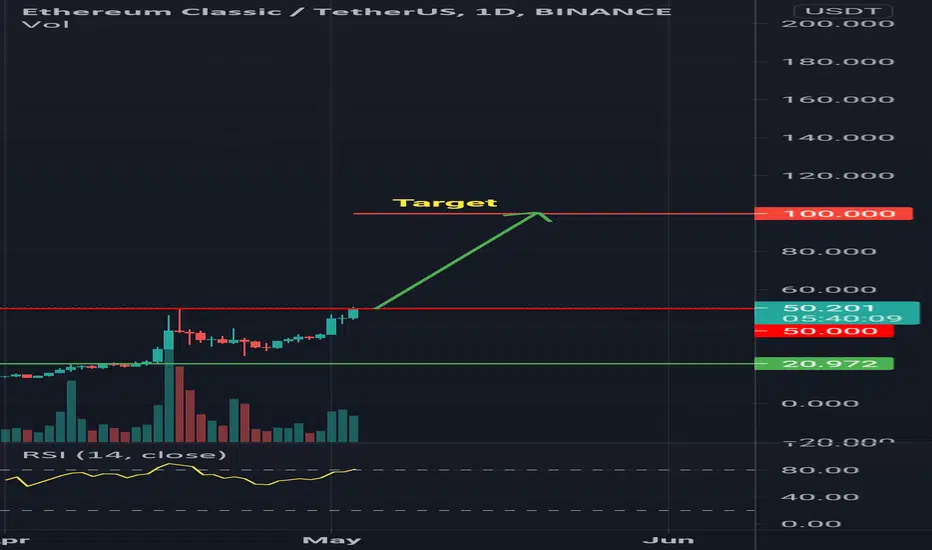
100 ETC is on the wayEtc is on track to go to $100. Once it breaks this $50 resistance it is ready to go.
ETC: potential to breakoutEthetum Classic has to breakout to get bullish.
Considering the position of ETH, a strong bullish momentum is possible.

ETCUSDT (Channel Breakout)ETCUSDT (1H Chart) Technical Analysis Update
Descending channel breakout
ETC/USDT currently trading at $0.1335
Buy-level: $35.75- $37.00
Stop loss: $31.60
Target 1: $41.75
Target 2: $46.00
Target 3: $50.00
Max Leverage: 3X
ALWAYS KEEP STOP LOSS...
Follow Our Tradingview Account for More Technical Analysis Updates, | Like, Share and Comment Your thoughts.

Ethereum Classic (ETC) Trading Setup & MomentumWhat Is Ethereum Classic (ETC)?
Ethereum Classic (ETC) is a hard fork of Ethereum (ETH) that launched in July 2016. Its main function is as a smart contract network, with the ability to host and support decentralized applications (DApps). Its native token is ETC.
Since its launch, Ethereum Classic has sought to differentiate itself from Ethereum, with the two networks’ technical roadmap diverging further and further from each other with time.
Ethereum Classic first set out to preserve the integrity of the existing Ethereum blockchain after a major hacking event led to the theft of 3.6 million ETH.
Who Are the Founders of Ethereum Classic?
Ethereum Classic is in fact the legacy chain of Ethereum, and its true creators are therefore the original Ethereum developers — Vitalik Buterin and Gavin Wood.
A contentious hard fork on Ethereum occurred in July 2016, when participants disagreed over whether to revert the blockchain to cancel out the effects of a major hack. This impacted The DAO, a decentralized autonomous organization (DAO) which had raised approximately $150 million in an initial coin offering (ICO) several months earlier.
Ethereum Classic came into being as the network which did not revert the chain. Developers state that there is no “official” team attached to the project, and that its “global development community is a permissionless 'do-ocracy,' where anyone can participate.”
What Makes Ethereum Classic Unique?
Ethereum Classic’s main aim is to preserve the Ethereum blockchain as it originally was, without artificially countering the DAO hack.
Its appeal was first to those who disagreed with Ethereum’s response, but the legacy network has since gained a wider fan base, which include major investors such as Barry Silbert, former CEO of investment firm Grayscale.
Reasons of trade:
Old project, as usual, I've been trading in the past.
Serious team coming from ETH, with a fan base which includes Barry Silbert.
Trade valid as long as S2 holds.
Current closed trades (with success!):
Chiliz
Digibyte
BAT
SC #1
SC #2
SC|BTC
StormX
Perlin
For details comment at any time!
Don't forget to like and follow if you find this helpful!

ETCUSDT - ETCBTCENTRY - STL - TP on picture
TP of me . And TP of you , i don't know
You can buy more if price lower entry
" High risk scaling consider when entering orders "
Wait to entry no buy price now if price done TP2 , We cancel this order !
THIS SHITCOIN BUY 20% $ TOTAL ACCOUNT
I am fomo following the recent pump dump events

#ETCUSDT #1H #ethereumHi guys..its the latest analyze chart of ETCUSDT in 1H time frame(folowers Requested analysis) .if you are interested any crypto that you want analyze with me and any questions please do not hesitate and comment below the chart!
if u like it press like-comment and folow me.thx


ETC Price in Triangle | Ethereum ClassicEthereum Classic price is now in triangle breakout above 7.5$
Price at trend line support must hold above the below trend line support

20$ EtcEtc can go to $20, if it invalidates h&s pattern. Look for it to go above the top resistance line and next stop is rightat $20.

ETC Looking BullishHi Guys
Another big cap project is ETC which was dumping from Feb 2020, so rightnow here is looking bullish and many things are here which are indicates that we can take long position from here.
The first is on 4hr chart we can see IHS pattern and also double bottom and the SL will be 0.0003050 if 4hr close below is this level.
Short term trader also can take long position from it level. TP will be 0.000405

ETCUSDT - Fast onccoming speed.Price sharply oncoming to the level without range and kickbacks. A good signal in the price movement will be:
1. The closing price of the next day's candle is higher than the High of the previous day"s candle.
2. Candles have short shadows.
3. The price moves inside the channel, quickly overcoming the distance from High to Low of the channel.
4. The price has left the channel and is moving towards a strong level.
Friends, push the like button, write a comment, and share with your mates - that would be the best THANK YOU.

ETC vs USDT ---LONG--- 30.09.20#ETCUSDT
Buy at: 5.20 - 5.30
SIZE: 3% from deposit
Target:
1) 5.65
2) 5.99
3) 6.30
SL: below 4.93


ETC Bullish Flag BrokenAll necessary Levels Are on the chart . Remember only Open Position After a Candle on Lower Time Frame close above 6.186$. Good Luck!

ETCUSD: Analysis using Ichimoku 22/07/2020H4
On D1, the cloud is directing upward, indicating an uptrend. You can visually see how the triangle price correction model is forming.
Conclusion:
We recommend selling from the upper line of the triangle pattern when the RSI reaches the overbought level again.
Also, we recommend to close sell and open buy when the price reaches the range of $5,8 - $5,5, and the RSI reaches the oversold level.
H1
At H4, the cloud is directing upward, indicating an uptrend. RSI is in an undefined state.
Conclusion:
You can try to sell with a short stop loss when the RSI H1 reaches the overbought level. However, it should be borne in mind that the upward movement may be higher for H1. A great option is to sell according to the H4 scenario from the upper line of the triangle.
In the medium term, we should expect the price to rise to the level of $8, possibly higher.

ETC is looking for head and shoulders patternETC is going to retrace back after being rejected from weekly level on 1st test at 7252.
The candles followed three levels. ( Middle Trend Line, Bottom Trend Line and Monthly Horizontal Level).
The middle trend line acted as resistance throughout the downward trend, where as bottom trend line as well as at times monthly level acted as a support.
We can call bottom trend line and monthly level as DUAL SUPPORT for ETC.
Once Monthly support level broken on 07 may 2020, it became resistance, as on breaking monthly level candle has to find a support, which in this case was weekly support at 6383.
Current Condition
From 27 June 2020 to 05 July 2020, ETC was in accumulation zone, mean bullish move ahead was on cards, and it happened. During that bullish move, it broke the weekly level at 6383, and it had to find a new resistance which was the next weekly level at 7252.
ETC has found a new zone of support and resistance between two weekly levels, 7252 (Weekly Resistance) and (6383 Weekly support).
Weekly resistance and weekly support has been tested both for the first time, and right now we may see some retracement back to 7252 level.
If you want to enter the trade on daily candles, during the next week 10 to 12 percent rise is expected. You can trade long but must excite before 7252, as it can retrace back. making HEAD AND SHOULDERS PATTERN.
Lookout for Head and Shoulders pattern for now in coming 10 days.
Trade according to the pattern.

ETCUSD: Analysis using Ichimoku 12/07/2020H4
On D1, the cloud is directing upward, indicating an uptrend. The price also broke the downtrend line at D1.
Conclusion:
Locally, we recommend buying when the RSI reaches an oversold level on the H4 near the Fibonacci level of 61.8%.
H1
At H4, the cloud is directing upward, indicating an uptrend. The RSI is not far from the overbought level, indicating a possible continuation of the correction. Also, the divergence has formed on H1 between price and RSI.
Conclusion:
Selling ETC looks risky, since the correction model may take the form of a “triangle”, but you can use this setup and sell ETCUSD when RSI reach overbought level at H1. Stop loss must be set at 6.8.
Also, we recommend buying when the RSI reaches an oversold level on the H1 near level of 6.2.

Cryptocurrency Ethereum Classic buy signals.Ethereum Classic (ETC/USD), daily timeframe: Support line + Side of Bollinger bands + Harami + Dragonfly doji

ETC: Analysis using Ichimoku 06/06/2020H4
The visually visible upward channel, the borders of which in the near future will be tested by the price.
The ETC price is trading below the Ichimoku cloud, indicating a local correction.
RSI is near the oversold level, indicating the possibility of a change in trend.
Conclusion:
We recommend buying from the key Fibonacci support levels of 50% and 38.2%.
H1
Visually, the border of the downtrend is clearly visible.
The price slowly declines below the Ichimoku cloud.
The RSI is near the oversold level, indicating a possible end to the downward movement.
Conclusion:
We recommend buying when the RSI of the oversold level is reached, and also continuing to buy after the price is fixed above the downtrend line.
Good luck!
