EUR/CAD BEARS ARE STRONG HERE|SHORT
EUR/CAD SIGNAL
Trade Direction: short
Entry Level: 1.565
Target Level: 1.558
Stop Loss: 1.569
RISK PROFILE
Risk level: medium
Suggested risk: 1%
Timeframe: 3h
Disclosure: I am part of Trade Nation's Influencer program and receive a monthly fee for using their TradingView charts in my analysis.
✅LIKE AND COMMENT MY IDEAS✅
Eurcad!

EURCAD - Overextended and Ready to Reverse?The EURCAD pair is showing clear signs of exhaustion in its bullish trend on the monthly chart, with an overextended price that has already liquidated a significant high. Futures market analysis confirms the accumulation of short positions, suggesting a potential bearish movement driven by institutional players. On the daily chart, the price has shifted to a clear downtrend.
Technical Analysis:
🔹 Monthly Chart:
The price has reached overextended levels, signaling a possible reversal.
A key high has been liquidated, indicating potential demand exhaustion.
🔹 Futures Market Data:
Short positions are accumulating, showing that major market participants are positioning for a bearish move.
Commercial market conditions reflect a weakening bullish sentiment.
🔹 Daily Chart:
Structural change confirms a bearish trend.
Possible selling opportunities on pullbacks to recent resistance levels.

Bearish drop?EUR/CAD has reacted off the pivot which is a pullback resistance and could reverse to the 1st support which acts as a pullback support.
Pivot: 1.57044
1st Support: 1.54315
1st Resistance: 1.57990
Risk Warning:
Trading Forex and CFDs carries a high level of risk to your capital and you should only trade with money you can afford to lose. Trading Forex and CFDs may not be suitable for all investors, so please ensure that you fully understand the risks involved and seek independent advice if necessary.
Disclaimer:
The above opinions given constitute general market commentary, and do not constitute the opinion or advice of IC Markets or any form of personal or investment advice.
Any opinions, news, research, analyses, prices, other information, or links to third-party sites contained on this website are provided on an "as-is" basis, are intended only to be informative, is not an advice nor a recommendation, nor research, or a record of our trading prices, or an offer of, or solicitation for a transaction in any financial instrument and thus should not be treated as such. The information provided does not involve any specific investment objectives, financial situation and needs of any specific person who may receive it. Please be aware, that past performance is not a reliable indicator of future performance and/or results. Past Performance or Forward-looking scenarios based upon the reasonable beliefs of the third-party provider are not a guarantee of future performance. Actual results may differ materially from those anticipated in forward-looking or past performance statements. IC Markets makes no representation or warranty and assumes no liability as to the accuracy or completeness of the information provided, nor any loss arising from any investment based on a recommendation, forecast or any information supplied by any third-party.

Bearish drop off pullback resistance?EUR/CAD is reacting off the resistance level which is a pullback resistance that lines up with the 38.2% Fibonacci retracement and could drop from this level to our take profit.
Entry: 1.56797
Why we like it:
There is a pullback resistance level that line sup with the 38.2% Fibonacci retracement.
Stop loss: 1.58016
Why we like it:
There is a pullback resistance level.
Take profit: 1.54362
Why we like it:
There is a pullback support level that aligns with the 100% Fibonacci projection.
Enjoying your TradingView experience? Review us!
Please be advised that the information presented on TradingView is provided to Vantage (‘Vantage Global Limited’, ‘we’) by a third-party provider (‘Everest Fortune Group’). Please be reminded that you are solely responsible for the trading decisions on your account. There is a very high degree of risk involved in trading. Any information and/or content is intended entirely for research, educational and informational purposes only and does not constitute investment or consultation advice or investment strategy. The information is not tailored to the investment needs of any specific person and therefore does not involve a consideration of any of the investment objectives, financial situation or needs of any viewer that may receive it. Kindly also note that past performance is not a reliable indicator of future results. Actual results may differ materially from those anticipated in forward-looking or past performance statements. We assume no liability as to the accuracy or completeness of any of the information and/or content provided herein and the Company cannot be held responsible for any omission, mistake nor for any loss or damage including without limitation to any loss of profit which may arise from reliance on any information supplied by Everest Fortune Group.

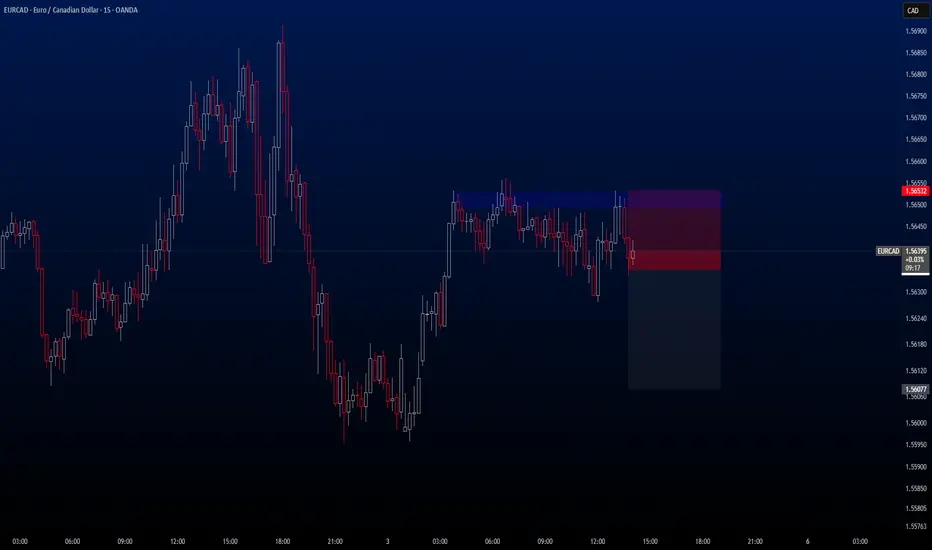
EURCADThere’s a solid opportunity for a sell trade on EURCAD. Although it's a relatively volatile pair, I'm planning to take the trade.
🔍 Criteria:
✔️ Timeframe: 15M
✔️ Risk-to-Reward Ratio: 1:1.50
✔️ Trade Direction: Sell
✔️ Entry Price: 1.56350
✔️ Take Profit: 1.56077
✔️ Stop Loss: 1.56532
🔔 Disclaimer: This is not financial advice. It's a trade I’m taking based on my own system, shared purely for educational purposes.
📌 If you're also interested in systematic and data-driven trading strategies:
💡 Don’t forget to follow the page and subscribe to stay updated on future analyses.

EURCAD Will Go Lower From Resistance! Sell!
Please, check our technical outlook for EURCAD.
Time Frame: 1h
Current Trend: Bearish
Sentiment: Overbought (based on 7-period RSI)
Forecast: Bearish
The price is testing a key resistance 1.567.
Taking into consideration the current market trend & overbought RSI, chances will be high to see a bearish movement to the downside at least to 1.565 level.
P.S
Overbought describes a period of time where there has been a significant and consistent upward move in price over a period of time without much pullback.
Disclosure: I am part of Trade Nation's Influencer program and receive a monthly fee for using their TradingView charts in my analysis.
Like and subscribe and comment my ideas if you enjoy them!

EURCAD Set To Fall! SELL!
My dear followers,
This is my opinion on the EURCAD next move:
The asset is approaching an important pivot point 1.5672
Bias - Bearish
Technical Indicators: Supper Trend generates a clear short signal while Pivot Point HL is currently determining the overall Bearish trend of the market.
Goal - 1.5648
About Used Indicators:
For more efficient signals, super-trend is used in combination with other indicators like Pivot Points.
Disclosure: I am part of Trade Nation's Influencer program and receive a monthly fee for using their TradingView charts in my analysis.
———————————
WISH YOU ALL LUCK

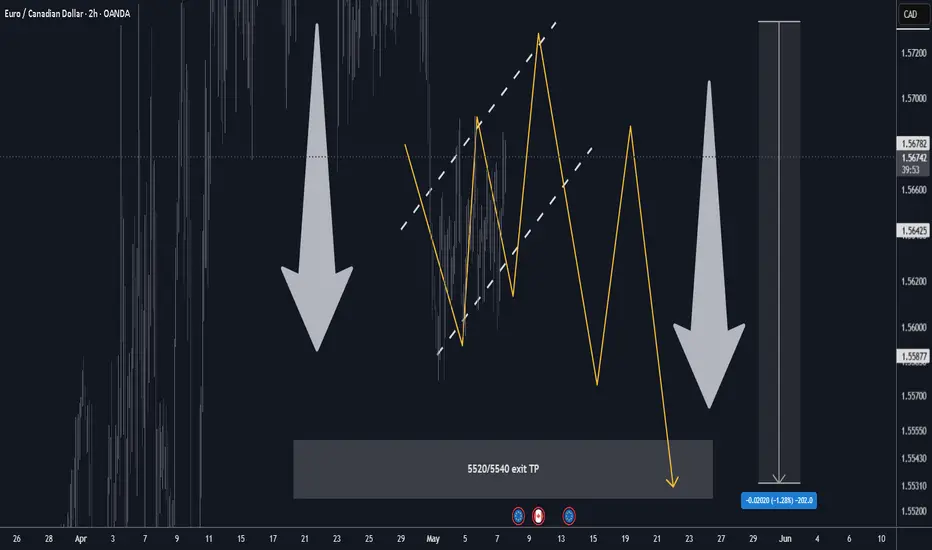
EURCAD H2 Best Level to SHORT/HOLD +100/+200 pips🏆 EURCAD Market Update H2 chart
📊 Technical Outlook
🔸broke down on high vol
🔸compression BEAR FLAG
🔸Mid-term: BEARS 5500
🔸Status: compression/dump
🔸5710/5720 heavy S/R BEARS
🔸5520/5540 key s/r zones below
🔸Price Target Bears: 5520
🔸final pump possible
🔸strategy: SHORT SELL 5710/5720
🔸SL 40 pips TP1 +100 pips TP2 +200 pips
🔸swing trade setup for patient traders
📊 Forex Market Update (May 7, 2025)
🇪🇺 EUR/USD
📉 Price: \~1.1370
USD strength ahead of Fed dampens Euro
German HCOB Services PMI fell in April; ECB rate-cut bets rising
Key Levels: Support 1.1320 | Resistance 1.1380
🇬🇧 GBP/USD
📉 Price: \~1.3320 (slid from recent highs)
Modest USD buying ahead of Fed decision
BoE policy caution keeps Pound in check
Key Levels: Support 1.3300 | Resistance 1.3400
🇺🇸 DXY (US Dollar Index)
📈 Price: \~99.39
Supported by rising U.S. yields and Fed rate-cut delays
Pressured by strategic uncertainty and trade tensions
Key Levels: Support 98.00 | Resistance 100.00
EURCAD Is Very Bearish! Short!
Here is our detailed technical review for EURCAD.
Time Frame: 1D
Current Trend: Bearish
Sentiment: Overbought (based on 7-period RSI)
Forecast: Bearish
The market is trading around a solid horizontal structure 1.561.
The above observations make me that the market will inevitably achieve 1.529 level.
P.S
Please, note that an oversold/overbought condition can last for a long time, and therefore being oversold/overbought doesn't mean a price rally will come soon, or at all.
Disclosure: I am part of Trade Nation's Influencer program and receive a monthly fee for using their TradingView charts in my analysis.
Like and subscribe and comment my ideas if you enjoy them!

EUR-CAD Will Keep Falling! Sell!
Hello,Traders!
EUR-CAD is going down
Now and the pair broke
The rising support line
Made a retest and is going
Down again now so we are
Bearish biased and we will
Be expecting a further
Bearish move down
Sell!
Comment and subscribe to help us grow!
Check out other forecasts below too!
Disclosure: I am part of Trade Nation's Influencer program and receive a monthly fee for using their TradingView charts in my analysis.

EUR_CAD BEARISH BREAKOUT|SHORT|
✅EUR_CAD made a bearish
Breakout of the support
Cluster of the rising and
Horizontal support lines
Around 1.5672 and the
Breakout is confirmed so
We are bearish biased and
We will be expecting a
Further bearish move down
SHORT🔥
✅Like and subscribe to never miss a new idea!✅
Disclosure: I am part of Trade Nation's Influencer program and receive a monthly fee for using their TradingView charts in my analysis.

EURCAD Sellers In Panic! BUY!
My dear friends,
My technical analysis for EURCAD is below:
The market is trading on 1.5585 pivot level.
Bias - Bullish
Technical Indicators: Both Super Trend & Pivot HL indicate a highly probable Bullish continuation.
Target - 1.5728
Recommended Stop Loss - 1.5506
About Used Indicators:
A pivot point is a technical analysis indicator, or calculations, used to determine the overall trend of the market over different time frames.
Disclosure: I am part of Trade Nation's Influencer program and receive a monthly fee for using their TradingView charts in my analysis.
———————————
WISH YOU ALL LUCK
EURCAD H4 Timeframe Potential Impulsive UpwaveEURCAD in the 4 hours timeframe potentially corrective structure completed for the next impulsive wave. Impulse - Correction - Impulse.

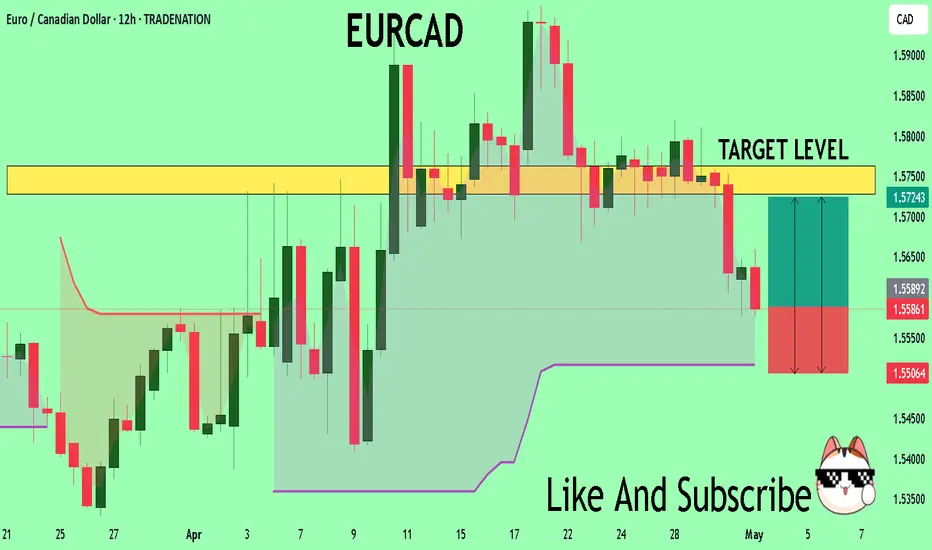
EURCAD Is Bearish! Sell!
Please, check our technical outlook for EURCAD.
Time Frame: 12h
Current Trend: Bearish
Sentiment: Overbought (based on 7-period RSI)
Forecast: Bearish
The market is approaching a key horizontal level 1.564.
Considering the today's price action, probabilities will be high to see a movement to 1.543.
P.S
Please, note that an oversold/overbought condition can last for a long time, and therefore being oversold/overbought doesn't mean a price rally will come soon, or at all.
Disclosure: I am part of Trade Nation's Influencer program and receive a monthly fee for using their TradingView charts in my analysis.
Like and subscribe and comment my ideas if you enjoy them!

Heading into 50% Fibonacci resistance?EUR/CAD is falling towards the pivot and could reverse to the 1st support which is a pullback support.
Pivot: 1.57044
1st Support: 1.54315
1st Resistance: 1.57990
Risk Warning:
Trading Forex and CFDs carries a high level of risk to your capital and you should only trade with money you can afford to lose. Trading Forex and CFDs may not be suitable for all investors, so please ensure that you fully understand the risks involved and seek independent advice if necessary.
Disclaimer:
The above opinions given constitute general market commentary, and do not constitute the opinion or advice of IC Markets or any form of personal or investment advice.
Any opinions, news, research, analyses, prices, other information, or links to third-party sites contained on this website are provided on an "as-is" basis, are intended only to be informative, is not an advice nor a recommendation, nor research, or a record of our trading prices, or an offer of, or solicitation for a transaction in any financial instrument and thus should not be treated as such. The information provided does not involve any specific investment objectives, financial situation and needs of any specific person who may receive it. Please be aware, that past performance is not a reliable indicator of future performance and/or results. Past Performance or Forward-looking scenarios based upon the reasonable beliefs of the third-party provider are not a guarantee of future performance. Actual results may differ materially from those anticipated in forward-looking or past performance statements. IC Markets makes no representation or warranty and assumes no liability as to the accuracy or completeness of the information provided, nor any loss arising from any investment based on a recommendation, forecast or any information supplied by any third-party.

EUR-CAD Bearish Breakout! Sell!
Hello,Traders!
EUR-CAD made a bearish
Breakout of the key horizontal
Level of 1.5700 and the
Breakout is confirmed
So we are bearish biased
And we will be expecting
A further bearish move down
Sell!
Comment and subscribe to help us grow!
Check out other forecasts below too!
Disclosure: I am part of Trade Nation's Influencer program and receive a monthly fee for using their TradingView charts in my analysis.

EURCAD: Free Trading Signal
EURCAD
- Classic bullish pattern
- Our team expects retracement
SUGGESTED TRADE:
Swing Trade
Buy EURCAD
Entry - 1.5687
Stop - 1.5644
Take - 1.5778
Our Risk - 1%
Start protection of your profits from lower levels
Disclosure: I am part of Trade Nation's Influencer program and receive a monthly fee for using their TradingView charts in my analysis.
❤️ Please, support our work with like & comment! ❤️

EUR/CAD BEST PLACE TO SELL FROM|SHORT
EUR/CAD SIGNAL
Trade Direction: short
Entry Level: 1.575
Target Level: 1.525
Stop Loss: 1.608
RISK PROFILE
Risk level: medium
Suggested risk: 1%
Timeframe: 1D
Disclosure: I am part of Trade Nation's Influencer program and receive a monthly fee for using their TradingView charts in my analysis.
✅LIKE AND COMMENT MY IDEAS✅

EURCAD Is Going Down! Short!
Take a look at our analysis for EURCAD.
Time Frame: 5h
Current Trend: Bearish
Sentiment: Overbought (based on 7-period RSI)
Forecast: Bearish
The market is on a crucial zone of supply 1.591.
The above-mentioned technicals clearly indicate the dominance of sellers on the market. I recommend shorting the instrument, aiming at 1.578 level.
P.S
We determine oversold/overbought condition with RSI indicator.
When it drops below 30 - the market is considered to be oversold.
When it bounces above 70 - the market is considered to be overbought.
Disclosure: I am part of Trade Nation's Influencer program and receive a monthly fee for using their TradingView charts in my analysis.
Like and subscribe and comment my ideas if you enjoy them!

EUR/CAD Trying To Breakout Strong Support , Be Ready For Sell !Here is my opinion about EUR/CAD , The price at very strong support and can`t close below it , so if we have a clear closure below it we can enter a sell trade with the retest and targeting 150 pips at least . just wait for the breakout and for bearish Price Action and then we can go down hard with it ! if we have not a closure below so this idea should be canceled .

EURCAD: Bearish Continuation & Short Signal
EURCAD
- Classic bearish pattern
- Our team expects retracement
SUGGESTED TRADE:
Swing Trade
Sell EURCAD
Entry - 1.5898
Stop - 1.5970
Take - 1.5735
Our Risk - 1%
Start protection of your profits from lower levels
Disclosure: I am part of Trade Nation's Influencer program and receive a monthly fee for using their TradingView charts in my analysis.
❤️ Please, support our work with like & comment! ❤️

EUR/CAD SHORT FROM RESISTANCE
Hello, Friends!
EUR/CAD pair is trading in a local uptrend which we know by looking at the previous 1W candle which is green. On the 8H timeframe the pair is going up too. The pair is overbought because the price is close to the upper band of the BB indicator. So we are looking to sell the pair with the upper BB line acting as resistance. The next target is 1.569 area.
Disclosure: I am part of Trade Nation's Influencer program and receive a monthly fee for using their TradingView charts in my analysis.
✅LIKE AND COMMENT MY IDEAS✅

EURCAD Approaching Major Resistance - Will Sellers Step In?OANDA:EURCAD is approaching a key resistance level, marked by significant selling pressure. This area has historically acted as a key supply zone, increasing the likelihood of a bearish reaction if sellers step in again.
The current market structure suggests that if the price confirms a rejection from this resistance level, there is a high probability of a downward move. I anticipate that if rejection occurs, the market may head lower toward the 1.57500 level, which serves as a logical target within the current market structure. However, a break above this resistance would invalidate the bearish bias and could lead to further upside.
This setup reflects the potential for a retracement after an impulsive move, supported by the confluence of previous price behavior and the current structure. If you agree with this analysis or have additional insights, feel free to share your thoughts in the comments!
