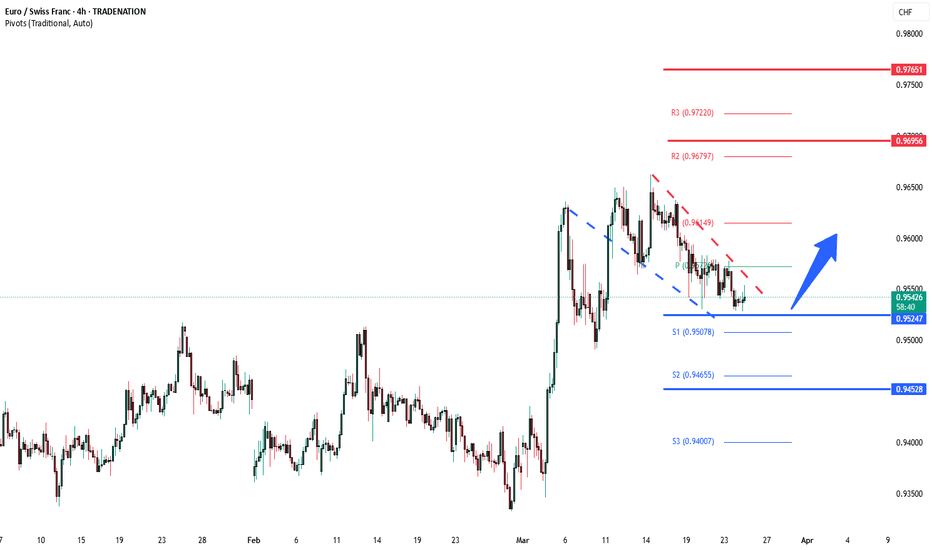
EURCHF INTRADAY breakout retest at 0.9520
The EUR/CHF currency pair is showing a bullish sentiment, supported by the prevailing long-term uptrend. Recent intraday price action indicates a bullish breakout from a sideways consolidation phase, with the previous resistance now acting as a new support zone.
Key Support and Resistance Levels:
Support Zone: The critical support level to watch is 0.9530, representing the previous consolidation price range. A corrective pullback toward this level, followed by a bullish rebound, would confirm the continuation of the uptrend.
Upside Targets: If the pair sustains a bounce from 0.9530, it may aim for the next resistance at 0.9640, followed by 0.9665 and 0.9690 over the longer timeframe.
Bearish Scenario: A confirmed break and daily close below 0.9530 would negate the bullish outlook and increase the likelihood of further retracement. In this scenario, the pair could retest the 0.9500 support level, with further downside potential toward 0.9450.
Conclusion:
The bullish sentiment for EUR/CHF remains intact as long as the 0.9530 support holds. Traders should monitor the price action at this key level to assess potential buying opportunities. A successful bullish bounce from 0.9530 would favor long positions aiming for the specified upside targets. However, a break below 0.9530 would signal caution and increase the risk of a deeper pullback.
This communication is for informational purposes only and should not be viewed as any form of recommendation as to a particular course of action or as investment advice. It is not intended as an offer or solicitation for the purchase or sale of any financial instrument or as an official confirmation of any transaction. Opinions, estimates and assumptions expressed herein are made as of the date of this communication and are subject to change without notice. This communication has been prepared based upon information, including market prices, data and other information, believed to be reliable; however, Trade Nation does not warrant its completeness or accuracy. All market prices and market data contained in or attached to this communication are indicative and subject to change without notice.
EURCHF
EUR/CHF BEARS WILL DOMINATE THE MARKET|SHORT
Hello, Friends!
Bearish trend on EUR/CHF, defined by the red colour of the last week candle combined with the fact the pair is overbought based on the BB upper band proximity, makes me expect a bearish rebound from the resistance line above and a retest of the local target below at 0.948.
Disclosure: I am part of Trade Nation's Influencer program and receive a monthly fee for using their TradingView charts in my analysis.
✅LIKE AND COMMENT MY IDEAS✅
11/03/2025 - EURCHF Short Trade PlanTrade Details:
Entry: 0.96251
Stop Loss: 0.96380
Take Profit 1: 0.95800
Final Target: 0.94176
Reason for Trade:
Bearish Rejection from the supply zone.
Bearish RSI Divergence, signaling potential downside movement.
Disclaimer : This trade plan is for educational purposes only and is not financial advice. Always perform your own analysis and risk assessment before executing any trade.
Skeptic | EURCHF: Trend Strength or Weakness? Trade SetupsWelcome back, guys! 👋I'm Skeptic.
Today, I’m bringing you a multi-time frame analysis of EURCHF , including both long and short triggers, along with a few educational tips. Let's dive in!
---
🕰️ Daily Time Frame Analysis:
After a solid accumulation phase and breaking above resistance, we've successfully shifted the trend to uptrend . Given the major trend direction, it's better to focus on long positions .
---
⏳ 4-Hour Time Frame Analysis:
Following the uptrend, we've formed a bullish ascending triangle, indicating a potential continuation. You might think that the RSI downtrend signals trend weakness, but here’s the key point:
- Lack of follow-through on the downside shows trend strengt h. If it was genuine weakness, we’d have seen a sharp downward move already.
This makes the bias towards long positions stronger .
---
🚀 Long Setup:
After breaking the resistance at 0.9649 7, we can consider a long position. A breakout of the RSI trendline to the upside would be an extra confirmation.
📉 Short Setup:
To go short, we first need a breakdown from the ascending triangle, followed by a break below the key support at 0.95726.
---
🎯 Target Setting:
You can use the height of the triangle or your own support/resistance levels to set targets. I’m not here to tell you where to place your stop loss or take profit since that heavily depends on your strategy, stop size, and R/R ratio.
---
💬 Final Thoughts:
I always provide the key levels and setups, but it's up to you to adapt them to your own strategy.
Thanks for sticking around until the end of this analysis.
See you on the next one!💪🔥
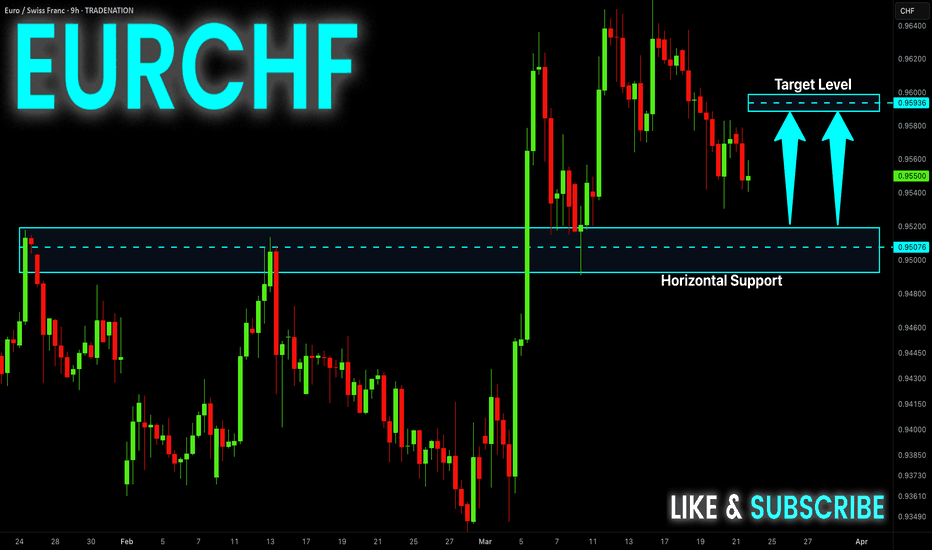
EUR_CHF LONG SIGNAL|
✅EUR_CHF made a retest
Of the horizontal support level
Of 0.9500 and we are already
Seeing a bullish rebound so
We can enter a long trade
With the TP of 0.9567
And the SL of 0.9488
LONG🚀
✅Like and subscribe to never miss a new idea!✅
Disclosure: I am part of Trade Nation's Influencer program and receive a monthly fee for using their TradingView charts in my analysis.
EUR-CHF Potential Long! Buy!
Hello,Traders!
EUR-CHF is already making
A bullish rebound after the
Retest of the horizontal
Support of 0.9500 so we
Are locally bullish biased
And we will be expecting a
Further bullish move up
Buy!
Comment and subscribe to help us grow!
Check out other forecasts below too!
Disclosure: I am part of Trade Nation's Influencer program and receive a monthly fee for using their TradingView charts in my analysis.
EUR/CHFKey Observations:
Support Area:
A brown-highlighted support zone indicates a potential area where price has historically found buyers.
Price recently touched this area and is showing signs of reaction.
Order Blocks (OB):
A Bullish OB is present below the current price, which suggests a potential demand zone.
Bearish OBs are present above, indicating potential resistance.
Fair Value Gaps (FVG):
Several FVG zones are highlighted, suggesting inefficiencies in price that could be revisited before continuing the trend.
Trade Setup:
A long position (buy trade) appears to be placed, targeting 0.97085 with a stop-loss around 0.94465.
This suggests a bullish bias, expecting price to move upwards after rejecting the support.
Bullish Scenario:
If price holds above the support area and fills the nearby FVGs, it could aim for the 0.96000-0.97000 range.
Breaking above the Bearish OBs would confirm further upside.
Bearish Scenario:
If price fails to hold the support and breaks below 0.95000, it could continue downward to 0.94465 or lower.
Rejection at the Fair Value Gap above could push price back down.
EURCHF My Opinion! BUY!
My dear friends,
EURCHF looks like it will make a good move, and here are the details:
The market is trading on 0.9524 pivot level.
Bias - Bullish
Technical Indicators: Supper Trend generates a clear long signal while Pivot Point HL is currently determining the overall Bullish trend of the market.
Goal -0.9565
Recommended Stop Loss - 0.9499
About Used Indicators:
Pivot points are a great way to identify areas of support and resistance, but they work best when combined with other kinds of technical analysis
Disclosure: I am part of Trade Nation's Influencer program and receive a monthly fee for using their TradingView charts in my analysis.
———————————
WISH YOU ALL LUCK
EURCHF support retest at 0.9530The EUR/CHF currency pair is showing a bullish sentiment, supported by the prevailing long-term uptrend. Recent intraday price action indicates a bullish breakout from a sideways consolidation phase, with the previous resistance now acting as a new support zone.
Key Support and Resistance Levels:
Support Zone: The critical support level to watch is 0.9530, representing the previous consolidation price range. A corrective pullback toward this level, followed by a bullish rebound, would confirm the continuation of the uptrend.
Upside Targets: If the pair sustains a bounce from 0.9530, it may aim for the next resistance at 0.9640, followed by 0.9665 and 0.9690 over the longer timeframe.
Bearish Scenario: A confirmed break and daily close below 0.9530 would negate the bullish outlook and increase the likelihood of further retracement. In this scenario, the pair could retest the 0.9500 support level, with further downside potential toward 0.9450.
Conclusion:
The bullish sentiment for EUR/CHF remains intact as long as the 0.9530 support holds. Traders should monitor the price action at this key level to assess potential buying opportunities. A successful bullish bounce from 0.9530 would favor long positions aiming for the specified upside targets. However, a break below 0.9530 would signal caution and increase the risk of a deeper pullback.
This communication is for informational purposes only and should not be viewed as any form of recommendation as to a particular course of action or as investment advice. It is not intended as an offer or solicitation for the purchase or sale of any financial instrument or as an official confirmation of any transaction. Opinions, estimates and assumptions expressed herein are made as of the date of this communication and are subject to change without notice. This communication has been prepared based upon information, including market prices, data and other information, believed to be reliable; however, Trade Nation does not warrant its completeness or accuracy. All market prices and market data contained in or attached to this communication are indicative and subject to change without notice.
EUR-CHF First Down, Then UP! Buy!
Hello,Traders!
EUR-CHF keeps falling down
After making it through the
Local structure of 0.9580
So we think that the pair will
First fall further down to
Retest the horizontal support
Of 0.9507 and after that
We will see a rebound and
A new wave of growth
Buy!
Comment and subscribe to help us grow!
Check out other forecasts below too!
Disclosure: I am part of Trade Nation's Influencer program and receive a monthly fee for using their TradingView charts in my analysis.
EURCHF: Expecting Bullish Continuation! Here is Why
The charts are full of distraction, disturbance and are a graveyard of fear and greed which shall not cloud our judgement on the current state of affairs in the EURCHF pair price action which suggests a high likelihood of a coming move up.
Disclosure: I am part of Trade Nation's Influencer program and receive a monthly fee for using their TradingView charts in my analysis.
❤️ Please, support our work with like & comment! ❤️
EUR/CHF BUYERS WILL DOMINATE THE MARKET|LONG
Hello, Friends!
EUR/CHF is trending up which is clear from the green colour of the previous weekly candle. However, the price has locally plunged into the oversold territory. Which can be told from its proximity to the BB lower band. Which presents a great trend following opportunity for a long trade from the support line below towards the supply level of 0.963.
Disclosure: I am part of Trade Nation's Influencer program and receive a monthly fee for using their TradingView charts in my analysis.
✅LIKE AND COMMENT MY IDEAS✅
EUR_CHF SUPPORT AHEAD|LONG|
✅EUR_CHF will be retesting a support level of 0.9500 soon
From where I am expecting a bullish reaction
With the price going up but we need
To wait for a reversal pattern to form
Before entering the trade, so that we
Get a higher success probability of the trade
LONG🚀
✅Like and subscribe to never miss a new idea!✅
Disclosure: I am part of Trade Nation's Influencer program and receive a monthly fee for using their TradingView charts in my analysis.
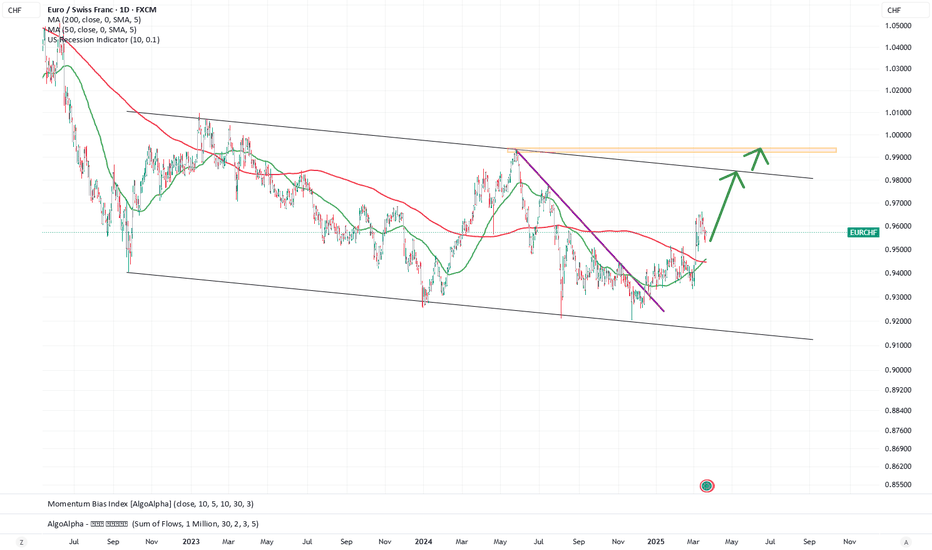
Long EURCHFGood morning traders,
EURCHF is above 200 MA, higher lows and higher highs after bottom at 0.92 . I´m expecting a bullish leg till 0.98 area
Scenario will be cancelled below 0.94 on a daily basis
6 Trading Rules :
1. Never add to a losing position .
2. Don´t be the first to buy low and sell high ., and don´t be the last one to exit
3. Think like a fundamentalist, trade like a technician .
4. Keep your analysis simple
5. Start small and increase exposure when trend is confirming your analysis
6. The hard trade is the right trade
Have a great weekend
EURCHF LongHi Everyone,
Hope you are all well and enjoyed my gold signal that hit all TP's
Here is our EURCHF Signal. wait for the 15 minute candle to close above the entry, and then for price to respect the entry, then we can enter. Here are the numbers.
EURCHF Buy
📊Entry: 0.95727
⚠️Sl: 0.95176
✔️TP1: 0.96349
✔️TP2: 0.97141
✔️TP3: 0.98148
Stick to the rules
Hope you all earn lots of profit.
Best wishes,
Sarah
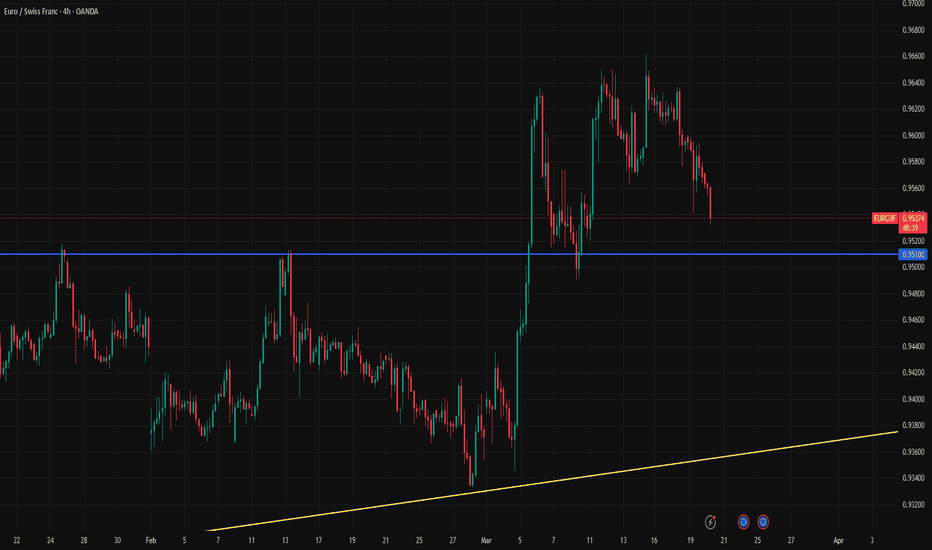
Watch Out for 0.9510 Support for EURCHFEURCHF is approaching the 0.9510 support level ahead of the SNB decision. Markets are currently pricing in a 25 basis point rate cut with a 68.1% probability. However, the recent relief in the Swiss franc may give the SNB reason to hold rates steady.
Our view is that the SNB will proceed with a 25 basis point cut today, and the 0.95–0.9510 support area is likely to hold. However, if this support zone breaks, it could trigger a medium-term selloff, potentially pushing EURCHF below 0.94.
EUR_CHF BEARISH BREAKOUT|SHORT|
✅EUR_CHF broke out
Of the bearish wedge pattern
So we are locally bearish
Biased and we will be
Expecting a further
Bearish move down
SHORT🔥
✅Like and subscribe to never miss a new idea!✅
Disclosure: I am part of Trade Nation's Influencer program and receive a monthly fee for using their TradingView charts in my analysis.
#EURCHF 4HEURCHF (4H Timeframe) Analysis
Market Structure:
The price is currently testing a well-established trendline resistance, which has previously acted as a barrier for upward movement. Sellers have shown strong presence at this level, leading to potential downside pressure.
Forecast:
A sell opportunity may emerge if the price faces rejection at the trendline resistance and forms bearish confirmation. If the resistance holds, the market may continue its downward movement.
Key Levels to Watch:
- Entry Zone: Selling near the trendline resistance after confirmation of rejection.
- Risk Management:
- Stop Loss: Placed above the trendline resistance to minimize risk.
- Take Profit: Target lower support zones or previous swing lows.
Market Sentiment:
If the price remains below the trendline resistance, the bearish outlook stays valid. However, a breakout above this level could shift sentiment toward further bullish movement.
EURCHF My Opinion! BUY!
My dear followers,
This is my opinion on the EURCHF next move:
The asset is approaching an important pivot point 0.9588
Bias - Bullish
Technical Indicators: Supper Trend generates a clear long signal while Pivot Point HL is currently determining the overall Bullish trend of the market.
Goal - 0.9605
About Used Indicators:
For more efficient signals, super-trend is used in combination with other indicators like Pivot Points.
———————————
WISH YOU ALL LUCK
EURCHF Bullish Breakout supported at 0.9530The EUR/CHF currency pair is showing a bullish sentiment, supported by the prevailing long-term uptrend. Recent intraday price action indicates a bullish breakout from a sideways consolidation phase, with the previous resistance now acting as a new support zone.
Key Support and Resistance Levels:
Support Zone: The critical support level to watch is 0.9530, representing the previous consolidation price range. A corrective pullback toward this level, followed by a bullish rebound, would confirm the continuation of the uptrend.
Upside Targets: If the pair sustains a bounce from 0.9530, it may aim for the next resistance at 0.9640, followed by 0.9665 and 0.9690 over the longer timeframe.
Bearish Scenario: A confirmed break and daily close below 0.9530 would negate the bullish outlook and increase the likelihood of further retracement. In this scenario, the pair could retest the 0.9500 support level, with further downside potential toward 0.9450.
Conclusion:
The bullish sentiment for EUR/CHF remains intact as long as the 0.9530 support holds. Traders should monitor the price action at this key level to assess potential buying opportunities. A successful bullish bounce from 0.9530 would favor long positions aiming for the specified upside targets. However, a break below 0.9530 would signal caution and increase the risk of a deeper pullback.
This communication is for informational purposes only and should not be viewed as any form of recommendation as to a particular course of action or as investment advice. It is not intended as an offer or solicitation for the purchase or sale of any financial instrument or as an official confirmation of any transaction. Opinions, estimates and assumptions expressed herein are made as of the date of this communication and are subject to change without notice. This communication has been prepared based upon information, including market prices, data and other information, believed to be reliable; however, Trade Nation does not warrant its completeness or accuracy. All market prices and market data contained in or attached to this communication are indicative and subject to change without notice.
EURCHF is starting to turn upLooks like a trend reversal at last.
1. Strong pinbars from the levels below 0.92 that rob the stops.
2. A broken trend line, higher lows, higher highs
3. it is currently at a very important level,we are watching how it will react and whether it will be overcome.
4. We are now long on a larger time frame.
EUR-CHF Bearish Wedge Pattern! Sell!
Hello,Traders!
EUR-CHF was trading in an
Uptrend but the pair has formed
A bearish wedge pattern so
IF we see a bearish breakout
From the wedge we will be
Expecting a bearish move down
Sell!
Comment and subscribe to help us grow!
Check out other forecasts below too!
Disclosure: I am part of Trade Nation's Influencer program and receive a monthly fee for using their TradingView charts in my analysis.


