EURUSD Analysis==>>Ascending Broadening Wedge Reversal Pattern!EURUSD ( FX:EURUSD )has managed to form an Ascending Broadening Wedge Reversal Pattern near the Resistance zone($1.0980-$1.0912) and Yearly Pivot Point .
Also, Regular Divergence (RD-) between Consecutive Peaks .
I expect the EURUSD to attack the Support zone($1.0816-$1.0775) again in the coming hours.
Euro/U.S.Dollar Analyze (EURUSD), 1-hour Time frame ⏰.
🔔Be sure to follow the updated ideas.🔔
Do not forget to put Stop loss for your positions (For every position you want to open).
Please follow your strategy; this is just my idea, and I will gladly see your ideas in this post.
Please do not forget the ✅' like '✅ button 🙏😊 & Share it with your friends; thanks, and Trade safe.
Eurusdprediction

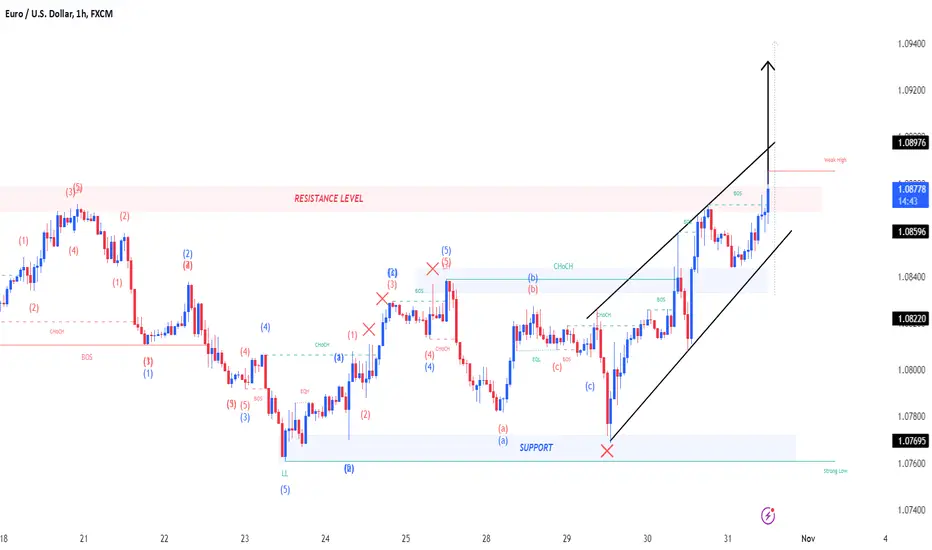
EURUSD Trendline Breakout Ready for a BullHello Traders
In This Chart EURUSD HOURLY Forex Forecast By FOREX PLANET
today EURUSD analysis 👆
🟢This Chart includes_ (EURUSD market update)
🟢What is The Next Opportunity on EURUSD Market
🟢how to Enter to the Valid Entry With Assurance Profit
This CHART is For Trader's that Want to Improve Their Technical Analysis Skills and Their Trading By Understanding How To Analyze The Market Using Multiple Timeframes and Understanding The Bigger Picture on the Charts

EUR/USD shows potential (READ DESCRIPTION)Pivot Point: 1.0860
EUR/USD shows potential for an upward move, with projected gains of 27 - 42 pips, supported by a pivot level at 1.0860.
Our Preference: Long Positions
Consider long positions above 1.0860 with the following target levels:
Primary Target: 1.0900 — this level may serve as the first resistance, where some consolidation or minor retracement could occur.
Secondary Target: 1.0915 — if this level is reached, it may indicate stronger bullish momentum, potentially supporting further advances.
Alternative Scenario: Downside Potential
If EUR/USD dips below 1.0860, consider a move lower with targets:
First Target: 1.0845 — an intermediate support level that could act as a buffer for downward momentum.
Second Target: 1.0830 — a more substantial support level that may result in either a consolidation or a sustained bearish push if breached.
Technical Indicators & Analysis
Relative Strength Index (RSI): The RSI indicates consolidation but remains above its neutrality area at 50, suggesting moderate upward momentum.
Moving Average Convergence Divergence (MACD): The MACD may be nearing or above its signal line, reinforcing a slight bullish trend; however, a potential cross below could indicate a return to consolidation or slight bearish pressure.
Moving Averages: EUR/USD is positioned above its 20-period and 50-period moving averages, signaling a short-term bullish trend with support for the upside move.
Key Levels & Price Action Outlook
Above 1.0860: A sustained move above this level can support gains toward 1.0900 initially. Consolidation may occur at this level, but continued strength would open up 1.0915, which is a more substantial resistance level and an extended target for long positions.
Below 1.0860: Dropping below this pivot could lead to further declines. 1.0845 may serve as an initial support, and a break here could lead to a test of 1.0830. This deeper level may offer stronger support and could signal either a bottoming for a potential rebound or a continuation of bearish movement.

EURUSD short ideaI think we have found HTF resistance, I like the shift and i would like to see it drop lower into sell-side at 1.08438

Eurusd Confirm Setup The US Dollar manages to rebound from earlier lows, prompting EUR/USD to surrender part of its initial advance to the vicinity of the 1.0900 region as investors shigt their attention to the upcoming critical US labour market report on Friday.

EURUSDPair : EURUSD ( Euro / U.S Dollar )
Description :
Break of Structure and Retracement
Order Block
Rising Wedge as an Corrective Pattern in Short Time Frame
RSI - Divergence
Breakout of Strong Resistance Level
EURUSD Set For Possible Bullish Breakout? Key Price Action Signa👀👉 EURUSD is demonstrating bullish momentum across the monthly, weekly, daily, and 4H charts. I'm closely watching for a potential buying opportunity, aligning with the key criteria covered in the video. In this analysis, we’ll pinpoint essential price action signals to track and outline strategic positioning for the next potential move. *Disclaimer: This analysis is for informational purposes only and does not constitute financial advice. 📊✅

EURUSD Multi Timeframe Analysis 31.10.2024This is the last Multi Timeframe Analysis I publish
15m Swing Bullish Internal Bearish
Quick shorts valid from current supply
4H Swing still bearish but I prefer following the strong bullish momentum after sweeping the daily low
Can not see much 15m demand to take longs. Price might create new internal structure and demand zones to take longs.

EUR/USD Builds Bullish Momentum with Strong Support and Pin BarAfter bottoming at 1.0760 exactly one week ago, FX:EURUSD has started to consolidate, forming what appears to be a base.
Since then, dips below 1.08 have been consistently bought up, culminating in a strong bullish Pin Bar candle yesterday.
To further support this bullish outlook, this base is forming at a key confluence of support levels, reinforcing the potential for an upward move.
With this in mind, I am looking to buy this pair, ideally on a dip, to ensure a positive risk-to-reward ratio of 1:2.
My target for a reversal is set at 1.0950, with respect to 1.09 resistance (this could serve as short term trader's target)

EURUSD Analysis==>>Inverted Head and Shoulders Pattern!!!EURUSD ( FX:EURUSD ) is moving near the Upper line of the Descending Channel , Support zone($1.0816-$1.0775) , and Support lines .
Regarding Classic Technical Analysis , EURUSD has already broken the Neckline of the Inverted Head and Shoulders Pattern ( Bullish Reversal Pattern ).
Also, Regular Divergence (RD+) between Consecutive Valleys .
I expect EURUSD to rise to at least the width of the descending channel after breaking the upper line of the descending channel and SMA(100) and then attacking the Resistance lines .
⚠️Note: If EURUSD goes below $1.075, we must wait for more dumps to at least $1.069⚠️
Euro/U.S.Dollar Analyze (EURUSD), 1-hour Time frame ⏰.
🔔Be sure to follow the updated ideas.🔔
Do not forget to put Stop loss for your positions (For every position you want to open).
Please follow your strategy; this is just my idea, and I will gladly see your ideas in this post.
Please do not forget the ✅' like '✅ button 🙏😊 & Share it with your friends; thanks, and Trade safe.

EURUSD short idea I think we are finding resistance here, I would like to see a pull back into the weekly range

EURUSD Top-down analysis Hello traders, this is a complete multiple timeframe analysis of this pair. We see could find significant trading opportunities as per analysis upon price action confirmation we may take this trade. Smash the like button if you find value in this analysis and drop a comment if you have any questions or let me know which pair to cover in my next analysis.

EURUSD lond ideaSome weekly sell-side taken i like the shift now I would like to see some buy-side taken at 1.08273

eurusd going upeurusd going up again, dxy will fall some points giving euro usdollar some credit maybe until the last 1.12 dollars per 1 euro, maybe more, who knows, didnt made the macros and the math, but signaling a big dowfall from dxy and longs going into eurusd

Long on EURUSD on the 30 min chartI am entering a long on EURUSD as we're hitting a previous support area and the lower bollinger band.

Scenario EURUSDAt the beginning of the whole movement there was a double peak from which the price fell sharply down to the level of 0.7688 where the price stopped on the trend line where at the same time there is support, I assume according to the last formation that a correction wave could start from this level which could end somewhere around the price of 1.10388 which is 0.618 fibo

DXY (US Dollar Index) Analysis Daily TimeframeDXY is currently sitting at a daily resistance level after a bullish run since last week.
we anticipate a potential move to the downside as the index shows signs of weakening, by creating a Doji candlestick, which indicates market indecision.
Remember: If the US Dollar Index turns bearish, EUR/USD and GBP/USD are likely to show bullish momentum.
Let's take a closer look at these pairs for potential buy setups.

EURUSD long ideaI like the double bottom and the nice shift following it... I want to see some internal range buy-side taken.

EUR/USD Sells to continue from 1.08300 or 1.08500EU Analysis Breakdown:
My bias for EU aligns closely with GU, anticipating a continued bearish trend as long as the DXY remains bullish. I’ve marked out two supply zones and will wait for either to be mitigated, followed by my lower time frame execution model involving Wyckoff principles.
Once I spot a Wyckoff distribution pattern, liquidity sweep, and CHOCH, I’ll initiate a sell position to keep with the downward trend. If price reaches the 9-hour demand zone at 1.07500, I’ll assess potential buy opportunities there.
Confluences for EU Sells:
- Strong bullish momentum in the DXY supports a downward bias for EU.
- EU’s consistent bearish structure aligns with this trend-following approach.
- An untouched supply zone provides a key area for potential sell entries.
- Significant downside liquidity offers additional targets.
P.S. Price could alternatively rise due to the liquidity above the supply zone, particularly around Asia session highs. Trade safely and stay smart out there!

EUR/USD Technical Analysis: (READ DESCRIPTION)EUR/USD Technical Analysis: Bullish Outlook
Pivot Point: 1.0775
EUR/USD is currently showing signs of a potential upward move, with support firmly established at 1.0775. The technical indicators suggest a preference for long positions as the pair is poised for further gains.
Our Preference: Long Positions
Recommended Trade:
Long positions are favored above 1.0775, with targets set at:
First Target: 1.0805
Second Target: 1.0820
This indicates a potential rise of 12 to 27 pips as the bullish momentum strengthens.
Alternative Scenario: Downside Potential
If EUR/USD falls below 1.0775, consider looking for downside targets at:
First Target: 1.0760
Second Target: 1.0745
This would suggest a shift in momentum and potential downward correction.
Technical Indicators:
RSI (Relative Strength Index):
The RSI calls for a new upward leg, showing buying strength and bullish momentum.
MACD (Moving Average Convergence Divergence):
The MACD is positive, supporting the bullish configuration.
Moving Averages:
The price is trading above both its 20-period and 50-period moving averages, reinforcing the positive outlook.
Price Action and Trends:
Above 1.0775:
As long as the price remains above this pivot point, the upside trend is expected to prevail, potentially targeting 1.0805 and 1.0820.
Below 1.0775:
A break below this support level would invalidate the bullish scenario, opening up potential losses toward 1.0760 and 1.0745. This would indicate a shift in momentum, suggesting a corrective move in price action.


EURUSD short ideaIf we break structure on the 5 minute char I would like to see retest and then drop into lower prices.

EURUSD long idealooks like there is going to be a retracement, I would like to see at least the nearby short term high taken as depicted.
