JPFA is callingAfter 22 April 2025, IDX:JPFA drop 190 (-9.97%) from the current price.
With the distributed dividen value Rp 70 (estimated 3% from the price)
Technical:
At the lowest area Fibb Retracement
Still above support line 1,740
Above EMA 200 (Weekly TF)
Fundamental
Growth Revenue each quarter
Good Debt to Equity Ratio (show good progress)
Target 1 : 1,945
Target 2 : 2,200
Thankyou for your time!
I hope everyone get the best for your life!
Fibonacci

GOLD → Reversal or correction? What to do now?FX:XAUUSD reaching the psychological high of $3500 has entered the correction phase, which was also influenced by a slight easing of the tariff conflict between the U.S. and China....
After falling without reaching the zone of interest 3288, the gold price is strengthening at the beginning of the European session, expecting PMI data from the U.S.. Earlier, the metal reached a record of $3,500, but rolled back amid hopes for an easing of the trade war with China and words of the US Treasury Secretary about a possible “détente”.
The dollar recovered as part of the correction, but investors doubt Trump's predictability, gold at this time begins a correction. In the center of attention is the PMI index from S&P Global: its results may affect expectations for Fed Funds rates and give a new direction to the market.
Resistance levels: 3340, 3360, 3366
Support levels: 3317, 3288
Technically gold is in correction and confirms the bearish structure. But any unexpected statement by Trump may attract aggressive buying.
Nevertheless, we should now consider a possible decline from 3340 - 3360 - 3366. Buying could be considered on a retest of support or a close above 3370.
Regards R. Linda!

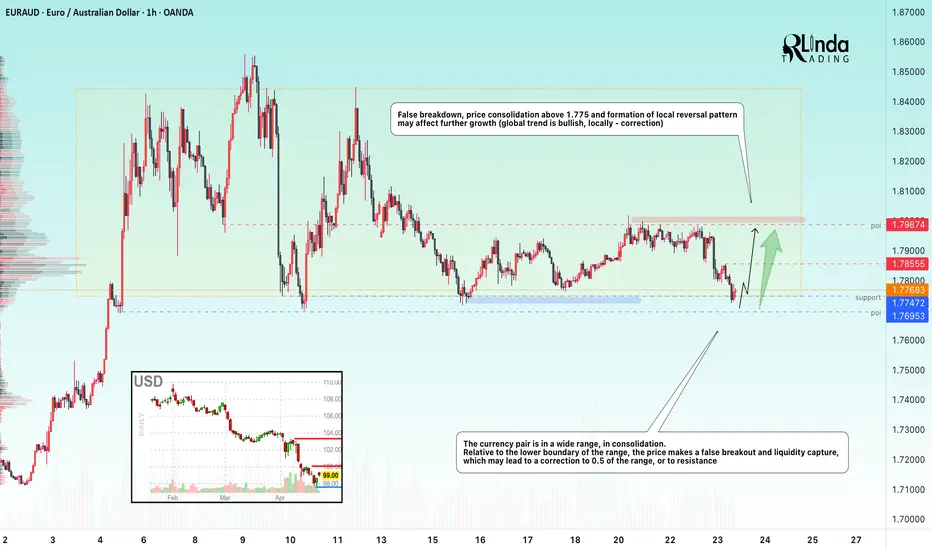
EURAUD → False breakdown as part of a bullish trend correctionFX:EURAUD amid the global bullish trend is forming a correction to the trading range support. Bulls are trying to hold the 1.775 zone
The currency pair is in a wide range, in consolidation. Relative to the lower boundary of the range, the price makes a false breakdown and liquidity capture, which may lead to a correction to 0.5 of the range, or to resistance
Price consolidation above 1.775 and formation of local reversal pattern may affect further growth (global trend is bullish, locally - correction). The fundamental background is unstable, but the dollar index is still in correction after a strong fall....
Resistance levels: 1.7855, 1.7987
Support levels: 1.775, 1.7695
If the bulls hold the defense above the key support - the lower boundary of the trading range, the currency price may bounce up and head for the liquidity accumulated above the resistance....
Regards R. Linda!
SOLANA → Pre-breakout consolidation relative to 136.00BINANCE:SOLUSDT relative to the range support forms a false breakdown. The market reacts quite positively and the price recovers, forming a consolidation in front of strong resistance
Bitcoin is also in consolidation, as well as SOL, in general the movements coincide, but lately bitcoin is leading relative to the stock market.
SOL is in consolidation in front of a strong resistance level at 136.00. The primary test may end with a small correction to 0.5 fibo, or consolidation near the level, but a breakout and price consolidation above the current consolidation will be a positive signal for continued growth. The global trend reversal is out of the question, we are aiming at local targets, such as 140, 147, 152.
Resistance levels: 147,152
Support levels: 129, 123, 111
In general, the global market situation is bearish, the local situation is neutral as the price is in a sideways range. A false breakdown was formed against the support of the current range. Technically, due to liquidity imbalance (after the false breakdown) the price may head towards such zones as 147 - 152
Regards R. Linda!

NQ Power Range Report with FIB Ext - 4/24/2025 SessionCME_MINI:NQM2025
- PR High: 18842.25
- PR Low: 18740.50
- NZ Spread: 277.5
Key scheduled economic events:
08:30 | Initial Jobless Claims
- Durable Goods Orders
10:00 | Existing Home Sales
Previous session gap remains unfilled
- Advertising rotation inside daily Keltner average cloud
Session Open Stats (As of 12:45 AM 4/24)
- Session Open ATR: 734.74
- Volume: 36K
- Open Int: 238K
- Trend Grade: Bear
- From BA ATH: -17.0% (Rounded)
Key Levels (Rounded - Think of these as ranges)
- Long: 20954
- Mid: 19246
- Short: 16963
Keep in mind this is not speculation or a prediction. Only a report of the Power Range with Fib extensions for target hunting. Do your DD! You determine your risk tolerance. You are fully capable of making your own decisions.
BA: Back Adjusted
BuZ/BeZ: Bull Zone / Bear Zone
NZ: Neutral Zone

Bajaj Finserv: Preparing for a Big Move! 🚀 Bajaj Finserv: Preparing for a Big Move! 🚀
📍 CMP: ₹1798
📉 Stop Loss: ₹1615
🎯 Target: ₹2025 | ₹2500
🔹 Key Insights:
✅ Rounding Bottom Formation: Neckline at ₹2025—confirmation above this level could unlock strong upside potential.
✅ Channel Trading: The stock is moving within a well-defined upward channel.
✅ Macro Factor: Potential RBI rate cuts could act as a major catalyst.
✅ Strategy: Staggered entry to manage risk in a volatile market.
⚠️ Risk Management: Strict adherence to stop loss at ₹1615 is crucial.
📉 Disclaimer: As a non-SEBI registered analyst, I recommend conducting thorough research or seeking advice from financial professionals before making investment decisions.
#BajajFinserv #TechnicalAnalysis #BreakoutStrategy #SwingTrading #StockMarket

Mphasis: Bounce from Long-Term Support🚀 Mphasis: Bounce from Long-Term Support 🚀
📉 Current Market Price (CMP): ₹2790📈 Support Level: Long-term support bounce confirmed🔒 Stop Loss: ₹2170📈 Targets: ₹2518 | ₹2732
📊 Key Insights:
🔹 Sector Strength: Nifty IT index showed a strong recovery after an initial 2% gap down, reclaiming losses in the first hour – a sign of sector-wide resilience.
🔹 Technical Setup: Mphasis has bounced from long-term support and is forming an "N" pattern. Today's breakout further strengthens the bullish sentiment.
🔹 Swing Trading Opportunity: With quarterly results approaching in April, this could present an attractive swing trading opportunity in the IT space.
💡 Strategy & Risk Management:
🔒 Stop Loss: Maintain a strict stop loss at ₹2170 to protect against downside risk.📈 Staggered Entry: Given market volatility, consider building positions gradually as confirmation strengthens.
📈 Outlook: With the Nifty IT sector recovering and Mphasis confirming a technical breakout, there is potential for further upside. Careful position management can help navigate market fluctuations.
📍 Stay informed and stay disciplined!
📈 Disclaimer: As a non-SEBI registered analyst, I recommend conducting thorough research or seeking advice from financial professionals before making investment decisions.
#Mphasis #ITSector #SwingTrading #TechnicalAnalysis #StockMarket #InvestmentOpportunities #BreakoutStrategy

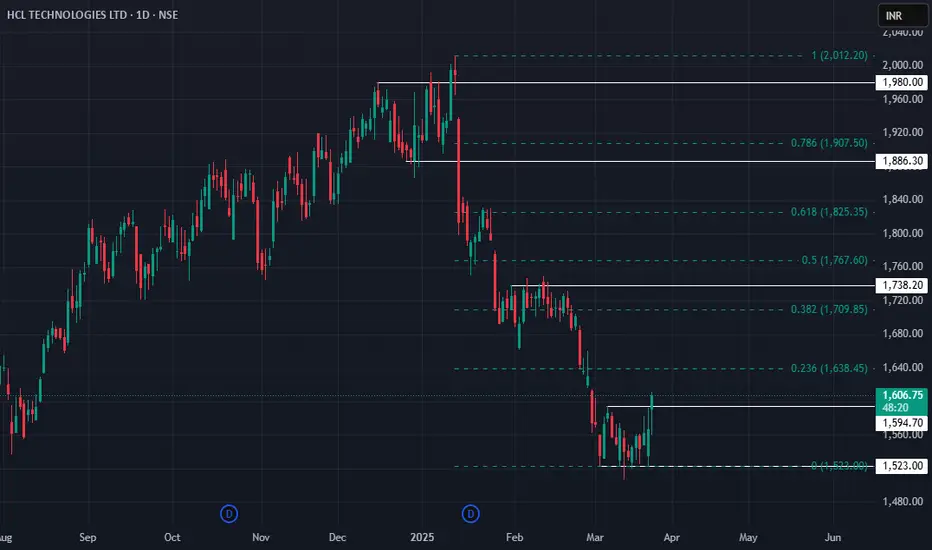
HCL Technologies: Setting Up for a Potential Bounce📈 HCL Technologies: Setting Up for a Potential Bounce
CMP: ₹1,606
Stop Loss: ₹1,490
Target 1: ₹1,738
Target 2: ₹1,825
HCL Technologies is showing signs of a potential rebound, closely mirroring the NIFTY IT index. The stock has formed a base on the daily chart and recently breached a small resistance, indicating bullish momentum may follow.
💡 Why This Matters:
With April’s quarterly results around the corner, increased market activity in HCL and the broader IT sector could present an attractive short-term trading opportunity.
⚠️ Caution:
The market remains volatile—smart position sizing and strict risk management are essential.
📌 Disclaimer: Not a SEBI-registered advisor. Always conduct your own research before making investment decisions.
#StockMarket #HCL #NIFTYIT #TechnicalAnalysis #TradingOpportunity
TCS Ready for BounceTCS Ready for Bounce
Current Market Price (CMP): ₹3,647
Stop Loss (SL): ₹3,430
Target 1: ₹3,784
Target 2: ₹3,986
📊 Market Insight:
TCS is showing signs of a potential bounce, closely mirroring the NIFTY IT index. The stock has formed a base on the daily chart and recently breached a small resistance, suggesting bullish momentum may follow.
💡 Trade Setup:
With April’s quarterly results on the horizon, increased activity in TCS and the broader IT sector could present a short-term trading opportunity.
⚠️ Caution:
The market remains volatile—practice smart position sizing and maintain a strict stop-loss to protect your capital.
📌 Disclaimer: Not a SEBI-registered advisor. Always conduct your own research before making any investment decisions.
#TCS #NIFTYIT #StockMarket #TechnicalAnalysis #TradingOpportunity #MarketUpdate

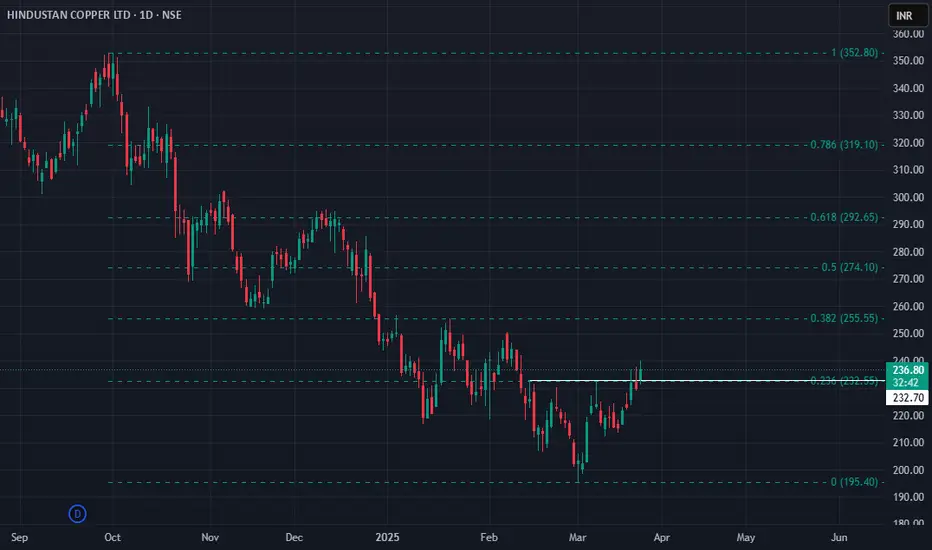
Hindustan Copper: Ready for Reversal? 🚀 Hindustan Copper: Ready for Reversal? 🚀
📉 Current Market Price (CMP): ₹237
🔒 Stop Loss: ₹210
📈 Targets: ₹256 | ₹285
📊 Why Hindustan Copper Looks Promising:
🔹 Technical Reversal Signal:
The stock has formed a small inverse head and shoulders pattern on the daily chart, indicating a potential reversal from current levels. This small base formation suggests upcoming bullish momentum.
🔹 Macro Tailwinds:
With the DXY (U.S. Dollar Index) decreasing and copper prices rising, there is additional support for an upward move in Hindustan Copper.
🔹 Swing Trading Opportunity:
With quarterly results on the horizon in April, this presents a timely swing trading setup to capture short-term gains.
💡 Strategy & Risk Management:
🔒 Stop Loss: Set a strict stop loss at ₹210 to protect capital against adverse movements.
📈 Staggered Entry: Given the recent market rally, it's wise to scale positions gradually while maintaining a balanced risk-to-reward ratio.
⚠️ Caution: While technicals are encouraging, the market has shown significant movement recently—adjust position sizes accordingly to manage risk effectively.
📍 Outlook:
With a confirmed inverse head and shoulders pattern and supportive macro factors, Hindustan Copper presents a compelling swing trade opportunity leading up to the April earnings season.
💬 Do you see this reversal playing out? Share your insights below!
📅 Follow for more technical insights and actionable market updates.
📈 #HindustanCopper #TechnicalAnalysis #SwingTrading #InvestmentOpportunities #MarketInsights #BreakoutStrategy
📉 Disclaimer: As a non-SEBI registered analyst, I encourage investors to conduct independent research or consult with financial professionals before making investment decisions.
Britannia: FMCG Bounce in Play?🚀 Britannia: FMCG Bounce in Play? 🚀
📉 Current Market Price (CMP): ₹4845
🔒 Stop Loss: ₹4690
📈 Targets: ₹5045 | ₹5232
📊 Why Britannia Looks Promising:
🔹 Sector Rotation Insight:
After a strong run in Nifty, Banking, and IT sectors, FMCG appears primed for a potential bounce—and Britannia stands out as a top pick for this move.
🔹 Technical Setup:
The stock is holding key support levels, presenting a low-risk, high-reward opportunity for a short-term bounce.
💡 Strategy & Risk Management:
🔒 Stop Loss: Maintain a strict stop loss at ₹4690 to limit downside risk and protect capital.
📈 Staggered Entry: With the recent market rally, adopt a phased entry approach to mitigate volatility and enhance risk management.
⚠️ Caution: The market has already experienced a significant move—position sizing should be adjusted carefully to maintain a favorable risk-to-reward ratio.
📍 Outlook:
As FMCG gears up for a potential bounce, Britannia offers a timely swing trading opportunity with defined risk parameters and clear technical targets.
💬 Do you see FMCG leading the next market move? Share your insights below!
📅 Follow for more technical insights and actionable market updates.
📈 #Britannia #FMCG #SwingTrading #TechnicalAnalysis #StockMarket #InvestmentOpportunity
📉 Disclaimer: As a non-SEBI registered analyst, I encourage investors to conduct independent research or consult with financial professionals before making investment decisions.

Will History Repeat Itself? $580 Target For SPY By Early MayThe market has been in the doldrums since finding support after a nasty wave of selling that caused AMEX:SPY to decline by an additional 15% in a matter of days. Since we’ve been chopping around in this $65 range, we have seen some sharp swings both ways, but little sense of direction. i think that is about to change soon. Using the time around the Death Cross (When the daily 50MA crosses below the 200MA) of 2022 as a frame of reference, and taking recent PA into account using Elliott Wave, I think it is clear a bear market rally is already underway.
Starting with 2022, the price fell in three distinct waves before making a significant retracement. The day after the 50MA crossed below the 200MA, the price found a temporary bottom before chopping around for 13 sessions. Volume was on a steady decline before the price made a higher low and retraced nearly 75% of Wave (A) over the course of another 13 sessions (13 is a fibonacci number btw). The price briefly spiked above all of the moving averages (50/100/200) before getting sold off again in the strongest wave of the bear market of that year.
Now looking at the daily chart for this year, the setup is a little bit different but there are still similarities. For starters, the 50MA crossed below the 200MA a few days after the market found a temporary bottom at $482. What I’m counting as Wave A of (B) lasted for five sessions (another Fibonacci number). Wave B of (B) was actually four sessions but I decided to compare the volume of both movements using the same chunk of time. As you can see, there was nearly double the volume in Wave A vs Wave B, signaling that bulls are in control (for now). Volume in Wave A was comparatively higher on average than the entire downtrend, which is also worthy of note.
Since we are now in Wave C of (B) and the 100MA is converging with the 200MA, we should see the squeeze here. A similar retracement to complete Wave (B), when comparing to 2022, would suggest AMEX:SPY will spike above $580 rather quickly before the next sell off. If Wave C were to unfold in a more conservative eight sessions (the next biggest fib number) we should see Wave (B) end around Thursday May 1st. It could take a little bit longer since the next FOMC is May 6-7, which could be an event that will cause the market to change directions.
Lastly, for a closer look, this is how I am counting the sub-waves on the 500R ($5) chart. Wave B was a classic Regular Flat pattern that saw wave (c) find support slightly past 100% of wave (a) at roughly $509. The price quickly found support (much faster than I would have expected) without filling the gap and ripped higher. We’ve also seen the price hover around monthly VWAP for a while, which indicates somewhat of an agreement on price despite the wild swings.
The price gapped up over 2% on Wednesday before seeing some selling in the afternoon. We could either close this gap on Thursday or continue higher to close the upper gap at $560 and beyond. Volume increased from wave (b)-(c), and has remained higher - which I think is accumulation. Using intraday ratios, Wave C of (B) could extend as high as the 1.618 extension at $587.
Actually, one last thing. TVC:VIX price action also supports my thesis. Even through the PA on AMEX:SPY was relatively neutral on Wednesday after the gap up, VIX still importantly dropped below support and is now below the 0.618 retracement. I think it will return to the 200MA for support, which usually hovers around $20. Fib circles added just because they’re kind of interesting to me when analyzing VIX.
If you’ve made it this far, thank you for reading and good luck. As always - use your best judgement and be ready to react to anything that happens in the market.

$XYZ pullback would be a gift for longsNYSE:XYZ back in bull trend here since tapping the 50 psych level. The 100WMA showing some confluence here with bull flag + trendline break from last month's disaster.
Fibs also coincide with some of the idea here with us currently in the golden zone
Short term, I'd take a stop here below 52.50 as it can get ugly back to 50, and would consider taking another long there at 50.
For now, 53-54 range looks good for long pullback. 54.60 is the 333SMA on the 1HR chart here. Looks like a great spot for starter entries. If the pullback does not come, a break above 57 (pm highs TODAY, 4/23) should see a nice push towards 60 psych level which could see some strong resistance. Targeting 62 if we break 60.
Leaps look great here with all this confluence. Easy stop below that 50 psych.
Targets on chart are assuming we do not get a pullback tomorrow. If we do, the r/r becomes much better to the long side. This chart does not look good for bears. Options flow
Thoughts on XYZ?

USDJPY Breakdown? (Elliott Wave)USDJPY bounced higher from a horizontal support shelf created from August - September 2024.
Using Elliott Wave Theory as our guide, the model suggests a breakdown below the support shelf is looming nearby.
I'm keeping an eye on 144.55. Below this mark, the risk remains high of a breakdown in a wave (iii).
Even if 144.55 is hit to the upside, wave (iii) is the favored model we are following.
USDJPY is dancing on top of the support shelf now. May break below and revisit the support shelf from the underside. Once the break appears, downside targets are large.
128 becomes the first target with even lower levels possible.
EURUSD, GBPUSD, USDCAD, and AUDUSD appear to be reversing too. This means EURJPY, GBPJPY, CADJPY, and AUDJPY may be ready to trend lower.

Nikkei 225 Wave Analysis – 23 April 2025
- Nikkei 225 broke the resistance area
- Likely to rise to resistance level 36355.00
Nikkei 225 index recently broke the resistance area between the pivotal resistance level 35000.00 (which stopped the previous correction 2, former strong support from September) and the 61.8% Fibonacci correction of the downward impulse from March.
The breakout of this resistance area would extend the earlier short-term ABC correction 2 from the start of April.
Nikkei 225 index can be expected to rise toward the next resistance level 36355.00 (former support which stopped the previous corrections iii and v last month).

ETH gives a strong exit from the descending channel!Hello everyone, I invite you to review the current situation on ETH, because you can see a significant rebound at the level of 30% from the last low. When we enter the four-hour interval, we can see how the ETH price moved in the local downtrend channel, from which we got an exit at the top, such a scenario often gives increases at the level of the channel height, which would bring the price closer to the levels of $ 2100.
Here you can see how the current rebound brought the movement closer to the resistance at the level of $ 1830, and then resistance is visible at the price of $ 1950, where the ETH price must then face a strong resistance zone from $ 2060 to $ 2100, where there could potentially be an upward movement after leaving the channel as in this case.
Looking the other way, you can see that when the trend reverses, we first have support at the level of $ 1730, but if it is broken, the ETH price may continue to fall and return to a strong support zone from $ 1480 to $ 1380.
It is worth paying attention to the MACD and RSI indicators because you can see how in the 4H interval we have gone beyond the upper limits of the ranges, which may translate into visible price consolidation on the chart in order to cool the situation.


Going long on BitcoinBINANCE:BTCUSDT
Bitcoin has made a 5 wave move to the downside, it is forming a bullish RSI divergence on the 4-hour chart, it already shown climatic volume on the recent bounce, seems like downside should be limited from here in the short to mid-term. Long term, the trend is still down.
I expect a multi-week bounce from here, probably to the 50% retracement, around 92k, before continuing to move down to a deeper lower-low.
Good luck to you

SUI price analysis If we look at the OKX:SUIUSDT chart globally, you'll see that the April drop stopped at a retest of a strong mirror zone.
And even now, when the CRYPTOCAP:BTC price is trying to correct itself, the #SUI price is very well-supported.
Therefore, globally, any purchase of #SUI while the price is above $2.30 has a chance to turn into a good medium or long-term investment.
📈 On the chart, we have schematically depicted how the #SUIUSDC price may move in the future in 2025 with the final target of $10.8-11.80
_____________________
Did you like our analysis? Leave a comment, like, and follow to get more

Daily chart bullish As a daily chart, we almost breaking out from the trend line, but we are not confirmed the break through yet unless we breakout that resistance at 0.018
if that breakout happen, we then confirmed we going to see a very nice bull run until December 2025, expected price to reach 0.03
I hope the it make sense, thanks for following me and supporting my charts, every time I see people boost my chart and comments, that motivate me to do more analysis, so if you would like me to keep posting, keep supporting my analysis.
Thanks again
Khaled Abdrabo

BTC must go to test $69K support before go to $140KI think you need to imagine the monthly chart, however it is all time high trend, but I think the BTC will need to go crash again to the $69 NYSE:K , since the RSI is over bought, and the Vwap is far from the actual price, the price needs to go touch the Vwap sooner or later, just remember that.
then we will see $140K

