JPYIDR Continues Its Uptrend: Strength Momentum Remains IntactI estimate that JPYIDR is currently in its uptrend phase, forming part of wave (iii) of wave . This indicates that JPYIDR still has room to strengthen, with the nearest upside target projected in the 122–128 range.
Fibonacci

Currently at a Very Strong Support.Currently at a Very Strong Support.
Bullish Divergence has appeared.
Crossing 136 may lead it towards 140 & then 148 - 149
initially.
On the flip side, it should not break 114.50 now.
Otherwise, we may witness further Selling Pressure
towards 88 - 90.

Gold Prediction!Current Price: ~$3,326
Trend: Strong bullish breakout of ascending channel
Moving Averages: Price is far above the 50 EMA (white)
Still bullishly distanced from the 200 EMA (orange)
Structure: Clean breakout of rising channel and key horizontal resistance zones
-Strong daily candle closed above trendline resistance → this is a confirmed breakout
-No upper wick rejections or bearish engulfing candles
-Buyers remain in control until signs of exhaustion show
Plan: Only look for a Buy position setup for safer trade.

XAUUSD WEEKLY ANALYSIS Hey everyone happy new week ahead…One of the best things I do on Sunday before the market opens is posting my weekly analysis for you guys and also ending the week with a win trade or no trade as long we don’t break our rules so guys I’m still bullish on Gold and this week if we can get a break below and price get to our support zone the one with the color green I will see if I can get a good confirmation and take more buys to the upside but if price price breaks above I will wait for a nice pullback and a confirmation too to take more buys so yes this is it for the week…I will update you guys if I’m executing any trade too…


We keep bouncing back I can tell from the trend line that we are still in a down trend, once we pass thorugh the trend line, we can see a nice bullrun

I started this analyses Aug 2022. Now I think HEY can grow to 60After the price breaks € 40, the way is open to grow to € 60.
Ofcourse, with ups and downs in between. Never a straight line.
I strarted my analyses August 2022 and since then, I had almost every movement right.
I advise to work with options on this beside stocks.

LOADS--- a Short Term Yet Powerful Trade Loads is offering a powerful Buy Set-up with following confluences:
1. Pirce has broken out range and re-tested it.
2. Re-test of Breakout range with healthy price action (Pin-Bar)
3. Surge in Volume after a bounce-off price from breakout zone.
4. MACD & RSI have generated a Buy Signal.
5. Rejection of Price at lower boundary of BB.
Target Prices are 19, 21 & 25.

Bearish Divergence has started appearing
Bearish Divergence has started appearing
on Bigger Tf.
Channel Top is also there.
Stay Cautious.
Sudden Spike can be witnessed till 1450 - 1500
but that would be a Risky Trade to take.
So Better to wait till the Bearish Divergence
plays & bring the price down & settle (may be)
around 1000 - 1050

Bitcoin showing mixed signals across timeframesOn the 4-hour timeframe, Bitcoin has broken above the descending trendline 📉 — however, the breakout lacks strong momentum, and no higher high has formed yet.
Therefore, we cannot yet confirm a shift from a bearish to a bullish trend.
According to the Fibonacci retracement tool, price is currently ranging between the 0.236 and 0.382 levels. These two zones could act as key decision points on the lower timeframes.
A confirmed breakout above the 0.382 level ✅ would signal bullish continuation.
A breakdown below the 0.236 level ❌ could lead to a move down toward the $81,200 zone — aligning with the broader trendline support.
On the 15-minute timeframe, price is consolidating and forming a triangle wedge pattern 🔺.
A breakout from this wedge may provide short-term direction toward the key Fibonacci levels mentioned above

SOLUSDT | 1 DAY | SWING TRADING Hey friends!
I’ve put together a detailed analysis on Solana just for you. The harmonic pattern has completed, and we’ve already seen some strong buying from that exact zone. 📈
Now, I’ve got two targets for you:
🎯 Target 1: 170.00
🎯 Target 2: 219.00
🔴 STOP: 75,81
"Just a heads-up — since this is a swing trade, the target might take some time to hit. Good to keep that in mind."
Remember, the more love and likes I get from you, the more motivated I am to keep sharing these analyses. All I ask is for a simple like to show your support. 💙
Huge thanks to everyone supporting with their likes — I truly appreciate it!

I think this is the very beginning of the next bull runAfter a pullback I'm sure that this is the very beginning of the next bull run .
Just to be 100%
I need one more confirmation on daily BOS
It continues forward and upward only.

PLTR: Fibonacci Fractal MappingA quick work on identification of key pattens and Mapping its intrinsic rhythm with Fibonacci Ratios.
Pattern I
Fib Mapping Pattern I
Validation of Pattern I: Match in frequency of cycles within patterns
Pattern II
Validation of Pattern II: Match in frequency of cycles

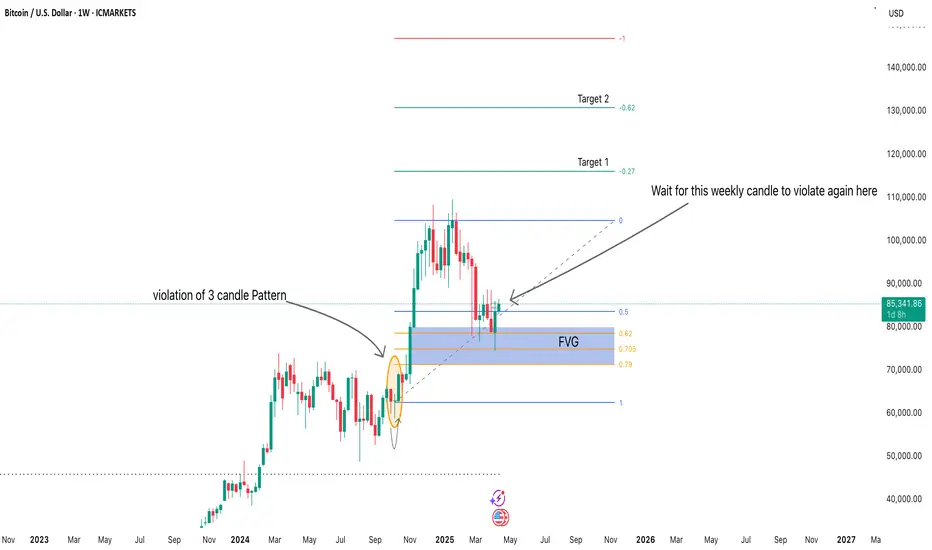
Bitcoin Weekly Outlook (April 2025)Price has respected the Fair Value Gap (FVG) and is showing signs of potential bullish continuation.
Waiting for a weekly candle body close above the highlighted structure to confirm continuation.
Targets set at key Fibonacci extension levels.
Patience is key — confirmation before entry to minimize risk.
"Let the market show its hand. No confirmation, no trade." 🚀
BNB TIME TO BUY?Hello friends
Due to the change in structure and the entry of buyers and the breakdown of the downtrend, we can buy in steps within the specified ranges and move with it to the specified targets, of course with capital and risk management...
*Trade safely with us*

BTCHello friends
We tried to make everything clear on the chart, I hope you like it.
Good luck.
*Trade safely with us*

SOL/USDT:SIGNALHello friends
According to the price growth we had, you can see that the price is in a range and now, as it approaches the ceiling of the range, if it manages to break our channel, it can move to the specified targets.
*Trade safely with us*

SILVER 1DA possible scenario for silver on the daily timeframe involves buying from the levels of 30.90-31.00 with further targets at 33.02, 34.8291 and the expected completion of the rounding pattern with a subsequent movement to the zone 40.0251
Everything is clearly depicted on the graph!
Have a good day!

Nifty Analysis & Trade Plan for Monday, 21st AprilNifty Analysis & Trade Plan for Monday, 21st April

NIFTY50.....Correction ahead?Hello Traders,
the NIFTY50 has achieved my target range @ 23872 and touched the wave x² range of a possible triple pattern. This was inline to my analysis!
It will be interesting to observe how market will react in the coming one or two days ahead!
Chart analysis!
As to seen, there is a trend line drawn, and it has been touched three times, what makes this one really important! On the way up, there are some gaps to the upside, and sooner or later, they will be closed.
A first target for this scenario could be a range of about 22867 area.
The bulls have to watch the impulsive structure, that has been formed at the last days, 'cause it's possible to count an impulsive move up (1-2-3-4-5)! The next move, when it is done, is a correction within a wave 2, that more often than not retrace a 0.618 Fibo of wave 1 of any degree. New lows, while not expected, are just below @22194 a real scenario!
When the bulls are willing to extend the gains, one target range is around the wave x of the triple @ 24857 a realistic idea!
Well, friends, that's it for a quick note.
Happy Easter and a great week for all of you.....
Ruebennase
Please ask or comment as appropriate.
Trade on this analysis at your own risk.

Gold for week 20-25 April trade plan
With fundamental of trade war and Jerome Powell news. There are many uncertainties in the market.
High volatility is going to be expected however trade precaution is highly advised for my personal trade.
Base on technical with assistance of fibo from previous structure breakout what I saw was gold manage to reach area of 2.618. however, a strong rejection was present that pushes it close to 1.618 as a current support. Undeniably gold is way over bought and price is considerably expensive. But that does not mean that gold could not goes even higher as the last break of structure and strong push gold has the potential still to climb up to 4.236 base on fibo and the area of 3420-3439 but first it needs to settle the current resistance of 3357.
So, what can happen on Monday and what does I want to look for if to buy for gold.
1. For continuation at the current market price of 3325 would gold give a push higher and break the last H1 supply. If happens I know I would be able to have a good 200-300pips to retest the ATH. So, I would take a precautioned buy trade of pullback and close TP range with 1:2 RR. Plus 20% position open TP.
2. If gold make a pullback to the cmp weak support and then only to break above similar trade as above I would take.
So, what does I want to look for if to sell for gold.
1. If gold able to utilise the current fbo sell and break below 3309. Then only I will take a continuation sell trade with similar strategy trade plan range and RR at the nearest SBR of m5/m15. So, means it needs to provide a new support pullback and then enter. Max target of this sell I target up to 3285-90 extension 3270 and 3230. The moment close to this area I should start monitoring if any change of character to have the bullish bias again or not. As bullish is still in bias.
Another possibility that I need to prepared and I hope it would not happen as its really not easy to identify if it’s going to make a temporary sideways between 3280-3360. However if this happens then I would look for buys and sells after buys and sells signals appear only in m30 and above candle. To sell slightly lower then 3360 after a rejection confirmed or to buy slightly higher then 3280 after a rejection confirm.
So that the game plan for next week

HINO--- A High Probability BUY SwingTradePrice is currently at a High Probability Buy Zone with Target at 544 & 600. Confluences include:
1. BB-50 (Base line Retest and Rejection) on weekly TF.
2. RBS Zone overlapping with 61.80% to 78.6% Fib. zone.
3.Strong MACD Signal.
4. Surge in Volume on Daily TF at a key support area.
5. SL below 322
