TESLA | Weekly HTF TargetAfter having a deep retracement ~70% tesla looks ready to reach Higher Highs...
New High target: $490+
Fibonacci

NVIDIA Rounding Top: Bearish Swings Q1 2025TA
Nvidia demonstrated strong growth throughout 2024. However, this year, it has shown rather a poor performance. When an uptrend started to weaken, it gave off subtle signals before a full reversal happened on the horizon. One of the first clues is that the highs collectively begin to appear curved compared with initial rough growth. This reflects the loss of aggressive bullish intent, showing hesitation and vulnerability to a reversal.
The price still makes higher highs, but the incremental gain between each peak shrinks. This declining magnitude in price advancement suggests that buyers are gradually losing strength with each move. These shallow bullish waves often get sold into quickly, showing early distribution behavior.
Simultaneously, it takes longer time for price to reach each successive high . When higher highs occur at reduced frequency, the rally phases become stretched out. This indicates buyers are struggling, and sellers are gaining time-based control.
Extended Rounding Top Pattern
Price crosses above the rounding top
Indicates a failed reversal and potential bullish breakout. Suggests renewed buying strength and possible trend continuation. I'd recommend using confirmation tools like volume spikes and momentum indicators which are essential to validate the breakout.
Price reaches the rounding top and stalls or reverses
Confirms the bearish reversal signal of the pattern. Acts as a strong resistance zone, often leading to a downtrend. Alongside with fibs, it can be used as a cue to take profits, exit long trades, or enter short positions.
FUNDAMENTALS
Catalysts of Bearish Swings
A transition phase characterized by a series of sharp bearish swings, marked by a sequence of Lower Highs and Lower Lows, shaping a well-defined downward channel.
Drop #1: ATH → Higher Low
(Early January 2025)
After Nvidia’s euphoric 2024 AI hype rally, it was a matter of time as some institutional Investors locked in profits, causing initial drop.
Valuation metrics (P/E; P/S) reached extremes creating grounds for a correction.
The Fed’s January meeting hinted at fewer rate cuts than the market expected. Rising Treasury yields pressured tech stocks.
The U.S. government has imposed strict export controls on advanced semiconductors, AI chips and related technology to China.
Drop #2: Lower High → Lower Low
(Late January to February 2025)
While Nvidia beat Q4 earnings expectations, its forward guidance disappointed. Management cited softening data center orders and consumer GPU inventory corrections.
Concerns about potential erosion in gross margins due to increasing costs and competitive pricing pressure from AMD and Intel.
AI infrastructure spending was plateauing faster than expected, leading to re-ratings across the sector.
Drop #3: Second Lower High → Second Lower Low
(Mid to Late February through Early March 2025)
Several investment banks downgraded semiconductor stocks, including Nvidia, amid fears of a cyclical slowdown and oversupply risks in H2 2025.
In early March, broader indices dropped due to hot inflation prints in February. Fed’s stance during testimony to Congress indicated a higher interest rate outlook.
Reports emerged about delays in next-gen chip production due to yield issues at TSMC and logistics constraints, fueling investor anxiety.
Renewed export control tightening and U.S.-China friction were again cited as major concerns earlier this year. These concerns were part of the bearish narrative during Nvidia’s downward structure, especially during Drop #1 and Drop #2 where investors began pricing in geopolitical and regulatory headwinds.
Events & Economic catalysts to monitor (before buying heavy):
Nvidia Earnings Q1 2025 Mid to Late May 2025
Why it matters: Forward guidance, Data Center/AI segment growth, margin updates, and China sales commentary will heavily impact sentiment and trend direction.
U.S. CPI (Inflation) Reports April 10, 2025 (March CPI)
Remember: Hot inflation = higher rate expectations → tech sector sell-off. Watch for YoY core CPI trends.
U.S. Jobs Report (NFP) April 4, 2025
Keep in mind: Strong labor = sticky inflation = Fed hawkishness → higher discount rates on growth stocks.
Semiconductor Industry Conferences
・NVIDIA GTC (GPU Technology Conference) – usually held Spring or Fall
・Semicon West 2025 – typically July
Track the progress: Product launches, AI roadmaps, new partnerships, and forward tech strategy updates often revealed.


XAU/USD Market Outlook – April 17, 2025🔸XAU/USD Market Outlook – April 17, 2025 (15-Minute TF)
💡 Key Notes:
Support Zone Reused: Market has tapped into a previous demand level – ⚠️ “Don’t buy again at this level.”
Sell Setup: 🔻 Sell bias if price breaks below 3321
Buy Scenario: 🔺 If price breaks above, watch for long opportunity toward 3223 area
🟩 Zones to Watch:
3292.73 → First Decision Zone (Minor demand)
3271.85 → Deeper Decision Zone
3259.93 → Better to avoid buying here
3243.73 → 🔥 Best Buy Area → Wait for 1-Min CHoCH confirmation
3226.36 → Deeper liquidity area, final defense
📈 Target Upside Zone: 3370.40
📉 Breakdown Target Range: Zones below 3250 if demand fails
#XAUUSD #GoldAnalysis #SmartMoneyConcepts #SupplyAndDemand #ForexStrategy #PriceAction

Dow Jones Update: Downside Pressure PersistsI currently estimate that the Dow Jones is in the early stage of wave B of wave (B), as indicated by the black label. This suggests that the index may continue its correction, potentially testing the 38,200–39,186 area before rebounding to challenge the resistance zone around 40,791 and possibly filling the gap between 41,173 and 41,629.
However, under the more bearish scenario (red label), the selling pressure on the Dow Jones remains significant, which may result in the formation of wave , leading to a deeper correction below the 36,611 level.

Apple Wave Analysis – 16 April 2025
- Apple reversed from resistance level 210.00
- Likely to fall to support level 190.00
Apple earlier reversed down from the resistance zone between the resistance level 210.00 (former support from the start of March), 20-day moving average and the 50% Fibonacci correction of the impulse wave (1) from February.
The downward reversal from this resistance zone stopped the previous medium-term correction (2) from the start of April.
Apple can be expected to fall to the next support level 190.00 – the breakout of which can lead to further losses toward the next support level 170.00.

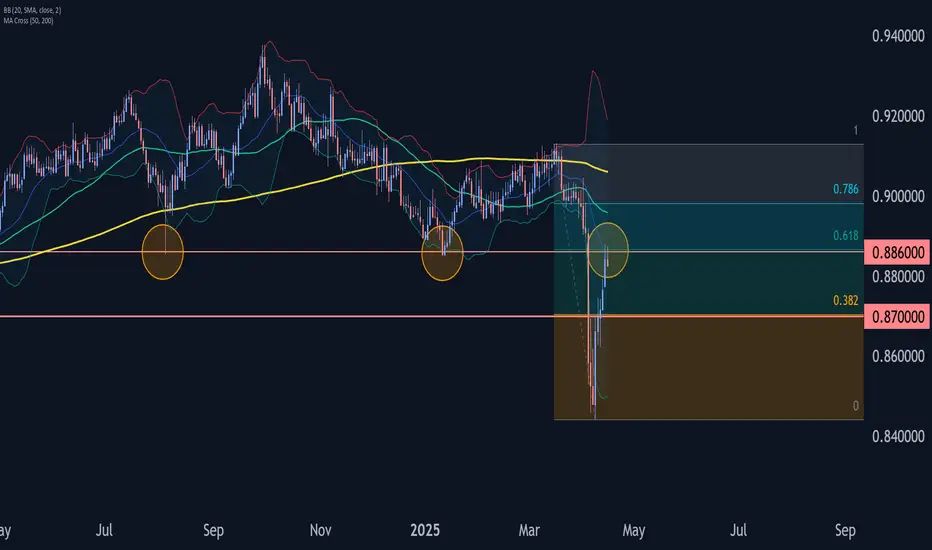
AUDCAD Wave Analysis – 16 April 2025
- AUDCAD reversed from resistance zone
- Likely to fall to support level 0.8700
AUDCAD recently reversed down from the resistance zone between the resistance level 0.8860 (former support from August and January), 20-day moving average and the 61.8% Fibonacci correction of the downward impulse 1 from March.
The downward reversal from this resistance zone stopped the previous short-term correction 2 from the start of April.
Given the clear daily downtrend and the bearish Australian dollar sentiment, AUDCAD can be expected to fall to the next support level 0.8700.
BNB/USDT 1D chartHello everyone, let's look at the 1D BNB chart to USDT, in this situation we can see how the price came closer to the local lines of the downward trend. Going further, let's check the places of potential target for the price:
T1 = $ 607
T2 = $ 632
Т3 = 660 $
T4 = $ 744
Let's go to Stop-Loss now in case of further declines on the market:
SL1 = $ 553
SL2 = $ 521
SL3 = $ 500
SL4 = 474 $
Looking at the RSI indicator, we see
As we bounced from the inside of the range, remaining in the lower part, which gives room for potential increases.

GOLD → If you didn't catch the train, what should you do?FX:XAUUSD in a rally. Running into a train that is already in motion is prohibited due to the lack of ability to calculate risks. Ahead of the news, a correction is possible, which will allow us to find a place to trade
Gold continues to update an all-time high on the back of expectations of retail sales in the US and the speech of Fed chief Powell. Price growth was supported by strong data from China, increased demand for “protective assets” due to geopolitical tensions and trade risks between the U.S. and China. Additional support was provided by forecasts of gold price growth from ANZ to $3,600 by the end of the year
Technically, the psychological zones of interest 3325 - 3350 are ahead, from which a correction may form. The ideal scenario is to wait for a correction to local or intermediate support levels and only there look for an entry point.
Resistance levels: 3318, 3335, 3350
Support levels: 3275, 3265, 3244
On the background of a strong bull market it is worth using as a productive strategy to trade on the breakdown of resistance in order to continue growth, but in this case we need to wait for consolidation, we do not have it.
Or wait for correction, support retest and only then consider buying.
Regards R. Linda!

NZDUSD → Is there a chance for continued growth?FX:NZDUSD within the framework of the rally, which is associated with a strong decline in the dollar, is exiting the ascending channel and testing the resistance at 0.5922.
Against the backdrop of the falling dollar, which is associated with economic factors, the New Zealand has good chances to continue to grow. Consolidation of the currency pair above the level will indicate the readiness of the currency pair to continue to grow.
But! Today is quite a day full of economic news. Traders are waiting for Core retail sales & retail sales, as well as Powell's speech at 17:15 UTC. High volatility is possible!
Resistance levels: 0.5922, 0.6038
Support levels: 0.5853
A small correction may be formed from the resistance, but another retest and price consolidation above 0.5922 may be a good signal for both the bulls and us to make decisions. The currency pair has all chances to reach 0.6000
Regards R. Linda!

GBPCAD → False breakdown, where do we go from here?FX:GBPCAD is forming a false breakdown of trend support. Against the backdrop of the falling dollar, the pound sterling went into the rally phase, which is favorable for the currency pair.
The fundamental situation is in favor of GBP and CAD against the dollar, which continues its rapid decline.
As part of the correction, the currency pair forms a test of support without the opportunity to continue the downward movement. The maneuver ends with a false breakdown and consolidation above the level (inside the channel). The currency pair may continue the uptrend if the bulls hold the defense above 1.8144 - 1.823
Support levels: 1.81500, 1.79788
Resistance levels: 1.8233, 1.83796
Accordingly, based on the fact that we have an uptrend, a strong currency pair (on the background of a weak dollar) and a false breakdown of support, we can say that the price is not allowed down and it is worth considering an attempt to continue the uptrend.
Regards R. Linda!

Trend Support and 18M AVWAP: Our Final Stronghold📜 Field Orders – Operation: Defensive Line
Troops, listen up.
We’re falling back to our key defenses—Trend Support and the 18M AVWAP.
Hold your ground.
Do not charge.
We wait.
🎯 Your Orders:
Stand down unless support is broken cleanly with force.
If the red army pushes through and confirms—join the short side.
Enter only with structure, never emotion.
Protect your treasures—capital is your ammunition. Don’t waste it fighting in the chop.
If this is a trap, and you’re caught in it—retreat immediately.
Take the loss. Regroup. Redeploy with strength and clarity.
If we bounce here—watch for signs of a counteroffensive near the AVWAP wall.
But again—only enter with confirmation. Not hope.

OVH Group – Beneficiary of EU-US Decoupling?OVH Group – Positioned to Benefit from Europe’s Digital Decoupling from the US
We are seeing a clear push toward reducing Europe’s dependency on American when it comes to the Blocks National Security. US cloud firms like Microsoft, Amazon, and Google are increasingly viewed as sovereignty risks, given the reach of US laws like the CLOUD Act.
This shift is creating strong political and regulatory support for European alternatives. OVH Group, as the leading European-owned cloud infrastructure provider, could stand out as a key beneficiary, should this trend prevail. The company is well positioned to take on new demand from both public and private sector clients looking for a sovereign, EU-based solution that aligns with data protection and national security goals.
OVHcloud is actively involved in providing cloud infrastructure services to European public sector entities, including those with stringent security requirements. While specific government security contracts are not publicly detailed, OVHcloud has positioned itself as a trusted provider for sensitive data hosting. The company emphasises its commitment to data sovereignty and compliance with strict data security and confidentiality requirements, operating exclusively within the European Union and not subject to extraterritorial laws like the U.S. CLOUD Act.
OVHcloud has built data centers within the EU dedicated to storing sensitive data, ensuring that services hosted in these "zones of confidence" are operated entirely within EU territory. These services comply with the highest standards and possess necessary security and data protection certifications.
Furthermore, OVHcloud has obtained the SecNumCloud 3.2 qualification for its highly secure cloud platform, Bare Metal Pod. This certification, awarded by the French Cybersecurity Agency (ANSSI), acknowledges the platform’s adherence to stringent security standards, supporting OVHcloud’s efforts in providing secure cloud solutions for public and private sector organisations.
These initiatives align with the European Union's push for digital sovereignty, positioning OVHcloud as a key player in providing secure, compliant cloud infrastructure for government and public sector clients.
If European governments follow through on this digital decoupling, OVH could see a significant increase in contract wins and strategic importance—both of which could materially improve its valuation.


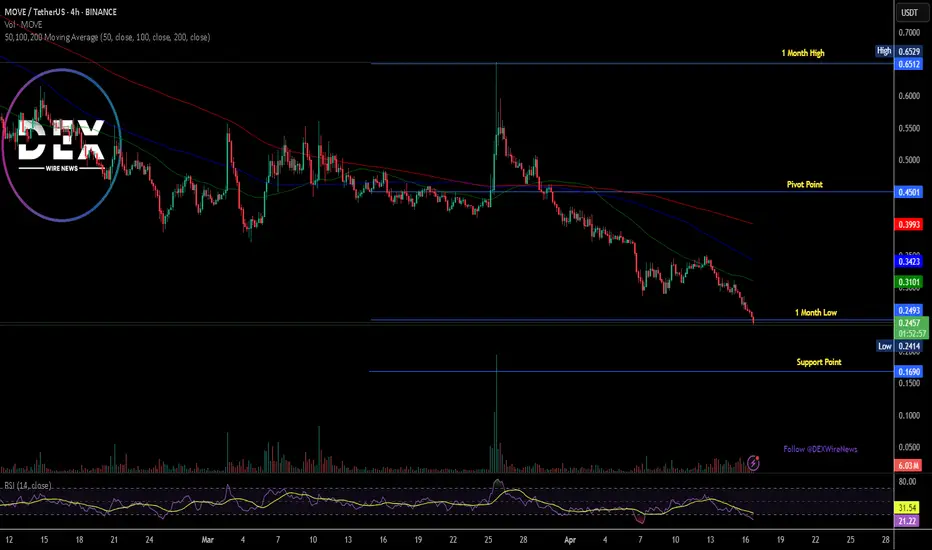
Breaking: Movement Token ($MOVE) Dips 12% TodayThe price of Movement coin ( TVC:MOVE ) nosedived 12% today, leading to a bearish pennant.
The ecosystem of Modular Move-Based Blockchains that enables developers to build secure, performant, and interoperable blockchain applications, bridging the gap between Move and EVM ecosystems has experience immense selling pressure today albeit the general crypto industry was also in a state of turmoil with CRYPTOCAP:BTC losing its $85k grip now down to $83k.
The first Move-EVM L2 for Ethereum has not being exempted, as hinted by the RSI at 20.64, TVC:MOVE has long being oversold with the asset moving around the 1-month low axis and a break below that axis could be dire for TVC:MOVE token.
Similarly, a break above the 50% Fibonacci retracement point could resort to a bullish reversal for Movement token ( TVC:MOVE ).
Movement Price Data
The Movement price today is $0.251764 USD with a 24-hour trading volume of $104,973,849 USD. Movement is down 10.27% in the last 24 hours. The current CoinMarketCap ranking is #87, with a live market cap of $616,822,310 USD. It has a circulating supply of 2,450,000,000 TVC:MOVE coins and a max. supply of 10,000,000,000 MOVE coins.
GBPCAD will Fly , All Confirmations are in the Bullish SideHello Traders
In This Chart GBPCAD HOURLY Forex Forecast By FOREX PLANET
today GBPCAD analysis 👆
🟢This Chart includes_ (GBPCAD market update)
🟢What is The Next Opportunity on GBPCAD Market
🟢how to Enter to the Valid Entry With Assurance Profit
This CHART is For Trader's that Want to Improve Their Technical Analysis Skills and Their Trading By Understanding How To Analyze The Market Using Multiple Timeframes and Understanding The Bigger Picture on the Chart

Gold Price at a Crossroads: Awaiting the Next MoveCurrently, I foresee two possible scenarios for XAUUSD. In the more optimistic scenario (black label), the recent correction is assumed to be wave ii of wave (v), which suggests that XAUUSD still has the potential to strengthen toward the 3,177–3,306.
However, attention should also be given to the bearish scenario (red label). If XAUUSD fails to break above the 3,167 resistance level, it is likely that wave 3 has already been completed, and the current movement is part of wave 4. In this case, XAUUSD may decline toward the 2,489–2,832.


GHST/USD Cryptocurrency Quote | Chart & Forecast SummaryKey Indicators On Trade Set Up In General
1. Push Set Up
2. Range Set up
3. Break & Retest Set Up
Notes On Session
# GHST/USD Cryptocurrency Quote
- Double Formation
* (EMA Settings)) On (A+ Set Up)) | Completed Survey
* (Reversal Argument)) At 325.00 USD Indexed To 100 | Subdivision 1
- Triple Formation
* (Flag Structure) & Retest Area | Subdivision 2
* (TP1) | Subdivision 3
* Daily Time Frame | Trend Settings Condition
- (Hypothesis On Entry Bias)) | Indexed To 100
- Position On A 1.5RR
* Stop Loss At 40.00 USD
* Entry At 33.00 USD
* Take Profit At 20.00 USD
* (Downtrend Argument)) & Pattern Confirmation
* Ongoing Entry & (Neutral Area))
Active Sessions On Relevant Range & Elemented Probabilities;
European-Session(Upwards) - East Coast-Session(Downwards) - Asian-Session(Ranging)
Conclusion | Trade Plan Execution & Risk Management On Demand;
Overall Consensus | Sell

XAU.usd watch $3100: possible dip to 2964 on the way to 3322Gold is at a significant cluster of fibs in the 3100 area.
Good possibility of a pullback from here down to 2964.
Best Guess for current wave's EndPoint is at $3100.76
===============================================
.

Gold Dips From PRZ – Will Supports Hold for New ATH?Gold ( OANDA:XAUUSD ) started to correct again from the Potential Reversal Zone(PRZ) and near the Resistance lines . The question is, can Gold create a new All-Time High(ATH) again?
In terms of Elliott waves , Gold appears to be completing a main wave 4 . This main wave 4 is likely to complete near the Support lines and Support zone($3,168-$3,133) .
I expect Gold to either rise again after breaking the Resistance zone($3,220-$3,211) or near the Support zone($3,168-$3,133) and Support lines .
Do you think Gold can create a new All-Time High(ATH) again?
Note: If Gold breaks the Support zone($3,168-$3,133), we should expect a further correction from Gold.
Gold Analyze ( XAUUSD ), 1-hour time frame.
Be sure to follow the updated ideas.
Do not forget to put a Stop loss for your positions (For every position you want to open).
Please follow your strategy; this is just my idea, and I will gladly see your ideas in this post.
Please do not forget the ✅' like '✅ button 🙏😊 & Share it with your friends; thanks, and Trade safe.


PLTR: Testing Key ResistancePrice has reached a meaningful resistance area near the March highs, which may trigger renewed selling pressure. If confirmed, this could open the path toward a deeper move into the macro support zone around 60–50.
Until price is closing bellow 100, my operative scenario is one more wave down to a macro support.
Thanks for your attention and best of luck with your trading!
