USD/CHF For Bullish as Pull-backwait for pull-back near by entry point and then go long
general trend is down trend
current phase is pull-back and may be finish near by target 3
have fun :)
Fibonacci

GBP/CHF For Bullish as Pull-Backyou can wait for pull-back near by entry point and then go long
general trend is down trend
current phase is pull-back
have fun :)

OM/USDT: what happened?Hello friends
Due to the heavy price drop, many holders of this currency fell into extreme fear, but according to the price chart, you can see that after this stunning growth, the price correction should finally happen.
Now, if you are risk-averse, you can buy in steps within the specified support areas and move with it to the specified targets, of course, with capital and risk management.
*Trade safely with us*

NZD/CHF For Bullish as Pull-back wavewait for pull-back near by entry point and then go long
general trend is up trend
current phase is pull-back
have fun :)

$85,354 and 35 cents: BTC Golden Genesis fib and KEY for BullRunShown here is a single fib series in three different timeframes.
The "Genesis" (at birth) fibs have caught every turn since 2015.
The "Golden" (1.618 exponents) are major nodes of any wave.
What happens here will reverberate for the rest of Bitty's life.
Bulls need to "orbit" this fib and then try to slingshot Northward.
Bears want a "Ping" (exact ricochet) on fib to mark a lower high.
.
Many other assets are at a similar landmark right now, such as:
NVDA
PLTR
TSLA

Will BTC emerge from the descending channel on top?Hello everyone, I invite you to review the current situation on BTC. On the one-day interval, you can see how the price is moving in the downtrend channel in which there is again a fight with the upper boundary of the channel. At this stage, you can also see how the EMA Cross 50/200, they have come very close but still indicate the maintenance of a long-term upward trend.
Here you can see how the price has currently bounced off the resistance zone from $ 86,503 to $ 87,934. Only an upper exit from this zone will open the way towards the second important zone at the levels of $ 93,959 to $ 96,142, and then we have visible strong resistance around $ 101,800.
Looking the other way, you can see that in the event of further declines, we have support at $ 80,550, then you can see an important zone that previously maintained the price decline from $ 74,340 to $ 71,380, in a situation where this zone is broken, we can see a quick decline to around $ 65,360.
The MACD indicator shows an attempt to switch to an upward trend, it is worth watching whether there is enough energy for further movement.

GOLD → Countertrend correction. What to do in this case?FX:XAUUSD , after a bull run, bumps into strong limit resistance at 3244 and enters a correction phase, which is generally a logical maneuver amid strong gains.
Gold corrects from Friday's record $3,245 and moves back to $3,200 amid improving market sentiment and progress in trade talks. The price pared gains after a strong weekly rally, reacting to U.S. concessions on tariffs on Chinese electronics and China's pledges to boost economic stimulus. Additional influences come from the dialog between the US and Iran, as well as the anticipation of China's GDP and trade data for March. Despite the pullback, downside may be limited due to ongoing uncertainty.
Technically, it is worth looking at the 3187 - 3167 conglomerate of support, which can stop (temporarily or even turn the price upward) a strong and sharp decline, as the fundamental backdrop within the tariff war is still tense.
Resistance levels: 3244, 3270
Support levels: 3187, 3174, 3167
The rally is temporarily halted, but there is no talk of a trend reversal, as the tariff war fire is still burning, Trump or Xi Jinping may add to the fire....
Within the framework of counter-trend correction, the emphasis is on the support of 3187, 3174, 3167 from which we can trade a false breakdown and catch the price rebound.
Regards R. Linda!

AUDUSD – Back From the Brink Below 0.6000, But What Next?Last week, AUDUSD was one of the main beneficiaries of the shift from despair, over Donald Trump's seemingly relentless tariff onslaught at the start of the week, to sheer relief into the Friday close, as the US President paused the tariff start date for 90 days. This move saw AUDUSD rally an impressive 5% from opening levels on Monday at 0.5992 to close the week at 0.6290.
Of course, there was a lot for traders to digest across the week, which included headlines regarding the potential for a fresh round of stimulus from Australia's most important trading partner China, to help support its economy through the escalating trade war with the US. Throw in the fact that traders were short AUDUSD and had to rush to cover these positions in response to the China news, as well as adjusting them again once the narrative shifted to a sell dollar story mid week, and you can see why a 5% rally occurred.
That explains last week's move, but where next for AUDUSD in the week ahead?
Traders again could have a lot to consider, including scheduled events, like the release of the RBA minutes at 0230 BST on Tuesday, which may help to give more context to why the Australian central bank decided to leave interest rates unchanged at the start of April.
China GDP, Industrial Production and Retail Sales are released at 0300 BST on Wednesday. The strength of this data could determine whether a more expansive package of stimulus measures are rolled out to support the economy.
Then it may be back to a dollar focus when US Retail Sales are released at 1330 BST on Wednesday. US consumer sentiment has collapsed at the start of 2025 as inflation and job security concerns dominate their outlook. This release may provide an insight into whether weak sentiment is leading to a pullback in spending, which could be bad news for the US economy and corporate earnings later in the year.
On the unscheduled side of things, tariff news may well be important again as traders try and digest further updates from the US and China, as well as news surrounding potential trade deals that are being negotiated between the US and allies.
Technical Outlook: Back To Important Resistance
While on April 9th AUDUSD posted a new correction low at 0.5914, which was the currency pairs lowest level since the March 2020 covid spike low, the balance of the week saw a sharp recovery in price. This rally, while impressive, only appears to have taken prices back to what might potentially be a strong resistance focus for traders in the week ahead.
Fibonacci retracements calculated on previous declines in price can reflect possible important resistance areas to consider when a price recovery is seen. As such, 0.6308, which is equal to the 38.2% retracement of the weakness seen between September 30th 2024 to April 9th 2025, may be a level to monitor.
As the chart above shows, this morning is seeing this 0.6308 resistance level tested, and how this level is defended on a closing basis in the week ahead could be important.
We also know previous highs in AUDUSD can potentially act as resistance levels. This suggests the 3 price failure highs at 0.6389 (April 3rd), 0.6391 (March 17th) and 0.6408 (February 21st) could be important and may possibly add to the strength of resistance just above current levels.
The next possible directional price moves may depend on how the 0.6308 to 0.6408 resistance range is defended on a closing basis.
What if The Resistance Area is Broken?
Of course, resistance up to the 0.6408 level currently remains intact and further significant buying may be required to prompt a successful upside closing break, however, while not a guarantee of future price strength, closes above 0.6408 might be an indication that potential is turning towards further attempts at upside, in which case the next resistance might then be 0.6549, which is equal to the higher 61.8% Fibonacci retracement level.
What if The Resistance Area Caps the Upside?
While the 0.6308/0.6408 resistance area remains intact, it’s possible it can turn directional risks lower again. If AUDUSD prices do turn down it might be that closing breaks of support at 0.6161, which is equal to the 38.2% Fibonacci retracement of latest strength, are required to suggest a deeper phase of price weakness.
Such activity while not confirming a more extended decline in price, might lead to tests of 0.6114, even deeper corrections towards 0.6067, the respective 50% and 61.8% Fibonacci retracement levels.
The material provided here has not been prepared in accordance with legal requirements designed to promote the independence of investment research and as such is considered to be a marketing communication. Whilst it is not subject to any prohibition on dealing ahead of the dissemination of investment research, we will not seek to take any advantage before providing it to our clients.
Pepperstone doesn’t represent that the material provided here is accurate, current or complete, and therefore shouldn’t be relied upon as such. The information, whether from a third party or not, isn’t to be considered as a recommendation; or an offer to buy or sell; or the solicitation of an offer to buy or sell any security, financial product or instrument; or to participate in any particular trading strategy. It does not take into account readers’ financial situation or investment objectives. We advise any readers of this content to seek their own advice. Without the approval of Pepperstone, reproduction or redistribution of this information isn’t permitted.

$XAUUSD Gold | Are We Looking at a Local Top Here?Looking at Gold again, I’m going a bit out on a limb and saying: There’s a good chance we’ve just seen a local top — at least for the coming weeks.
Last time I was pretty spot on with my target after being wrong about the top. I wanted to see $2,955, and Gold ended up reaching $2,956.5 — missing my level by just $1.50. Totally fine, especially considering the huge rally that followed.
But now it looks like that rally might be losing steam. We’re currently trading between the 127.2% and 138% Fibonacci extension levels, specifically between $3,225 and $3,250. That’s a zone I see as highly likely for a short-term correction.
Possible downside targets?
First $3,146, then lower at $3,034, and ideally even a move back toward $2,900.
Of course, a lot will depend on macro news, especially from the US — tariffs, geopolitical risks, and overall market sentiment. If Gold pushes above $3,300, then this whole scenario gets invalidated and I’d switch to an alternative setup that I haven’t detailed here yet.
The RSI is also sitting deep in overbought territory, with multiple bearish divergences building — which supports the idea of a pullback.
But as always: Just because the RSI is overbought doesn’t guarantee an immediate drop. We still need price confirmation.

Bitcoin BTC price analysisThis is approximately the roadmap we have "imagined" for the coming weeks for the movement of the CRYPTOCAP:BTC price:
1️⃣ The most optimistic scenario is that the OKX:BTCUSDT price stays above $76100 - 77100, which means that the “bottom” has finally been found, and we can organize at least a rebound to $94k.
2️⃣ Not a pleasant scenario, but not the worst either, is another update of the local lows of #Bitcoin to $71100 and from there a rebound to the above-mentioned $76100-77100 zone, where we will have to "looking out" again: where to go next...
3️⃣ The most pessimistic, and maybe the most realistic scenario in times of total uncertainty, when it is not clear what the "rusty can" will wake up with in. ✊
All market participants will delay their "buying" decisions as much as possible until it becomes clear whether the Fed will cut the rate or not. The next FOMC meeting is on 07.05.25.
To understand what will happen to altcoins during this time, you need to at least monitor and analyze the #BTC.D and #USDT.D indicators, which we do daily in our reviews in...
✍️ It is your right, if not your duty, to follow this plan or make your own adjustments!)
And we will be happy to read and see your charts, with your forecasts for the near future in the comments below the idea.

NZDJPY → Back in range, there's a chance to strengthenFX:NZDJPY is forming a false break of the range support and within the reversal pattern confirms the break of the bearish structure
The fundamental background has been extremely unstable lately and depends on any harsh statements of politicians, mainly related to the trade war.
But, technically, the pair is returning to the range on the background of local market recovery. A false breakdown of the range support is formed.
The break of the bearish structure, the formation of the reversal pattern and the return to the trading range give chances for strengthening of the price. If the bulls hold the defense above 83.7 - 84.2, the currency pair may strengthen to 85.15 - 87.4
Resistance levels: 84.196, 86.15
Support levels: 83.79, 83.31, 82.21
Consolidation above the key support zone may allow the bulls to strengthen the price to the local zone of interest. Global trend is neutral, local trend is upward.
Regards R. Linda!

SOL USD LONG IdeaBased on a fibonacci speed fam from the all time low to all time high along with a fibonacci retracement both point out that the price has retraced down to the golden pocket areas. Based on the supoort holding, along with other indicators I'm using points out a very likely move to the upside of ~20%.

Dollar Index Monthly Review: Key Support Levels with the help ofIn the first Fibonacci setup, we observe a retracement of the index to the 61.8% Fibonacci level, after which a trendline could be drawn. Applying a second Fibonacci retracement on the chart reveals that the Dollar Index once again found support within the 50.0%-61.8% zone.
In January of this year, the dollar attempted to break above the 110.00 level but encountered resistance at the 61.8% bullish retracement level. This led to another pullback, increasing the likelihood of a decline toward the trendline in the 98.50-99.00 zone. The 100.00 level is expected to act as support, though a temporary dip below this level within a consolidation phase is possible before another solid support is established.
Once a new support base is confirmed, the Dollar Index could initiate the next bullish rally, potentially forming a new high above the 116.00 level.

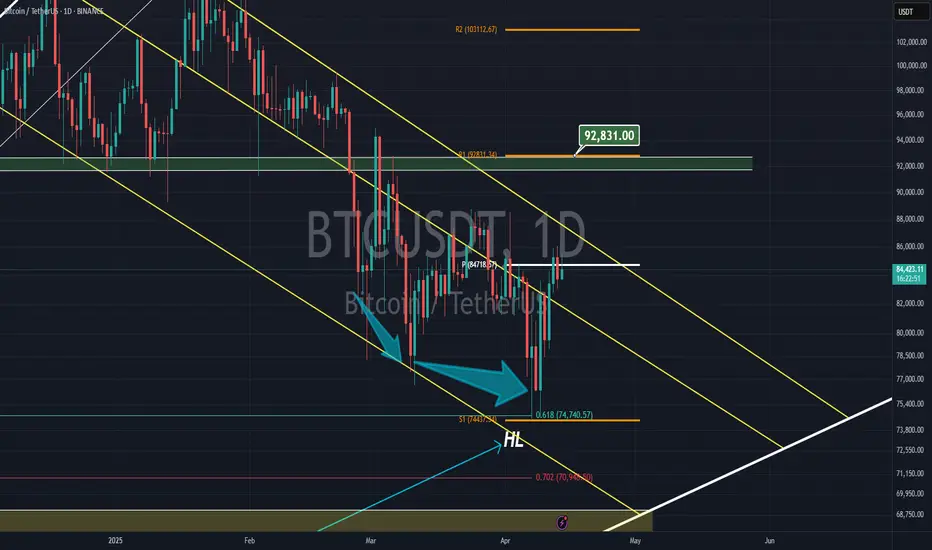
Bitcoin at the pivotBitcoin now is trying to break the April pivot ( which is easy IMO ) and as soon as pass that, it can get to 93k resistance
EUR/NZDExpecting price to react off the levels that I marked, to continue higher, these levels I marked are aligned with my Fib levels.

Aergo price analysis The #Aergo coin is “old” from 2019, and its capitalization is only 59 million, and that's after a few days of 200%+ pumping from Korean exchange users in a falling market.
🟡 At the current price, of course, it's not worth buying OKX:AERGOUSDT , but why not keep an eye on it.
🟢 If the price is kept above the buying zone - $0.075 - $0.087, then the pump can easily be extended, at least to $0.30 - $0.32 (potentially modest x4, or maybe not)
🔴 Below this zone, in our opinion, it is dangerous to buy, because there will be weakness of buyers and the price of #Aergo has a place to fall.
_____________________
Did you like our analysis? Leave a comment, like, and follow to get more

Buy limit order plan for Gold on 4HGold is performing in assenting parallel channel on daily time frame as will as on 4H time frame. However there is a bearish divergence that indicates the price will go down and will continue the up trend after the correction.
A buy limit order can be setup on 4H time frame.
Entry : 3072.166
Stop Loss : 2954.231
TP1 : 3190.101
TP2 : 3308.036
Bulls Score : 2
Bears Score : 1


BTCUSD 2024/04/14Scenario BTCUSD TF H4 - Stick to your stop loss to protect your trades - Manage your positions patiently until you hit the target - Profit always in risk, take the risk or lose the chance


USDCHF SELLS Price is overall bearish but it formed a minor support on H1. Ideally, I'd like to see price retrace to the broken support around 0.83600 area.


USDJPY SELLSPrice is currently in an AOI for sells. Price gapped up so I'd hold off on sells until price forms bearish structure on the lower timeframes. Once price resumes bearish structure, look for sells towards 140.500. If price breaks above H1 resistance, I'd look for price to push towards 145.

GU buys Price closed bullish on the weekly timeframe. I would like to see GU either retrace to 1.29200 area to continue bullish or break and retest h4 resistance to to push towards 1.34200 area.
