Gold is expected to continue to 3410-3420At present, gold has risen to around 3395 in the short term, breaking through the short-term high of around 3392, and there is no clear peak signal; and after breaking through the previous high of around 3392, there is no need to worry about the suppression of the technical double top structure for the time being. From this point of view, gold still has the potential to continue to rebound in the short term, and is even expected to reach the 3410-3420 area; this morning, gold has not fallen below 3360 during the adjustment process. As gold rises, the lower support area gradually moves up. The current short-term support area is in the 3385-3375 area.
Today's trading strategy:
1. Consider shorting gold when it first touches the 3410-3420 area, TP: 3395-3385
2. Consider trying to go long gold in small batches when gold falls back to the 3385-3375 area, TP: 3395-3405
Fibonacci
USD/JPY Weekly: Approaching Critical Long-Term Confluence SupOVERVIEW:
The USD/JPY pair has been navigating a well-defined multi-year ascending channel on the weekly timeframe, signifying a strong underlying bullish trend. After reaching significant highs, the pair has entered a period of correction and is now rapidly approaching a crucial confluence zone of long-term support. This area is expected to be a pivotal point for the pair's next major move.
KEY OBSERVATIONS & MARKET STRUCTURE:
1. Long-Term Ascending Channel:
Since late 2022, USD/JPY has consistently respected the boundaries of a broad ascending channel. This channel defines the primary bullish trend, with price oscillating between higher highs and higher lows.
2. Current Corrective Downtrend:
From its recent peak around 161.95 (marked as 0 on the Fibonacci), price has been in a substantial decline, forming a clear bearish leg within the confines of the larger channel. This current downtrend highlights a period of profit-taking and yen strength (or dollar weakness) after an extended rally.
3. "Deciding Level: Trendline + Resistance":
During this bearish correction, price recently broke below a short-term descending trendline and a horizontal level which had previously offered support. This former support has now flipped into resistance, creating a "Deciding Level" that bears have defended around the 146.00-148.00 area. Any attempt to rally will likely face strong selling pressure here.
4. Critical Confluence Support Zone:
The most significant area on this chart is the "Long-Term Support + Fib Retracement Zone" (highlighted grey rectangle) situated approximately between 137.00 and 140.00. This zone represents a powerful confluence of multiple technical factors:
Historical Horizontal Support: A clear zone where buyers previously stepped in, initiating strong rallies.
Lower Channel Boundary: The bottom trendline of the multi-year ascending channel. This is the natural area where the long-term bullish trend is expected to find new demand.
Fibonacci Retracement Levels: This zone aligns perfectly with the 0.618 Fibonacci retracement (140.399) and extends to the 0.71 Fib level (137.186), drawn from the swing low of 127.059 to the swing high of 161.980. The 0.618 Fibonacci is often referred to as the "golden ratio" and is a high-probability reversal point in strong trends.
POTENTIAL OUTLOOK & TRADE SCENARIOS:
1. Bullish Reversal (High Probability):
Given the robust confluence of support, the most probable scenario is a strong bounce from this "Long-Term Support + Fib Retracement Zone." We would be looking for clear signs of bullish price action on the weekly or daily charts (e.g., large bullish engulfing candles, hammer formations, bullish divergence on oscillators, or a break of the short-term bearish trendline leading into this zone).
If support holds, initial targets would be the "Deciding Level" resistance (146.00-148.00), fol
lowed by a retest of the previous highs or the upper boundary of the channel.
2. Bearish Continuation (Lower Probability, but Critical Invalidation):
A sustained weekly close below the entire "Long-Term Support + Fib Retracement Zone" and the lower boundary of the ascending channel would be a significant bearish development. This would invalidate the long-term bullish structure of the channel and suggest a deeper correction is underway.
In such a scenario, the next levels of support would be the 0.71 Fib (137.186) if not already broken, and potentially even the origin of the Fib move at 127.059. This outcome would necessitate a re-evaluation of the overall long-term bias.
KEY LEVELS TO WATCH:
• Critical Confluence Support: 139.00 - 141.00
• Deeper Fib Support: 137.18 (0.71 Fib)
• Immediate Resistance: 146.00 - 148.00 ("Deciding Level")
CONCLUSION:
USD/JPY is at a critical juncture. The "Long-Term Support + Fib Retracement Zone" represents a high-probability area for buyers to re-enter and potentially reverse the current corrective move. Traders should closely monitor price action at this zone for confirmation of a bounce or, less likely but equally important, a decisive break.
Risk Management is Paramount : As always, ensure proper risk management with well-placed stop-losses relative to the identified support and resistance levels.
________________________________________
Disclaimer:
The information provided in this chart is for educational and informational purposes only and should not be considered as investment advice. Trading and investing involve substantial risk and are not suitable for every investor. You should carefully consider your financial situation and consult with a financial advisor before making any investment decisions. The creator of this chart does not guarantee any specific outcome or profit and is not responsible for any losses incurred as a result of using this information. Past performance is not indicative of future results. Use this information at your own risk. This chart has been created for my own improvement in Trading and Investment Analysis. Please do your own analysis before any investments.

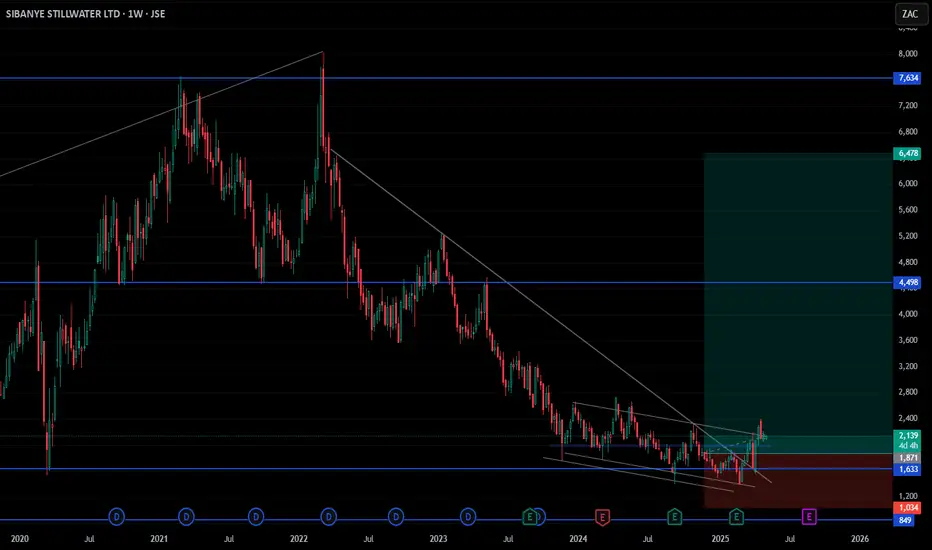
SSW Long Term Long PositionThe South African JSE stock has been gradually degrading for the past 3-4 years. It has reached support level 1633 ZAC which was last tapped in 2020. There is a possibility that it might drop even lower but we are in the mid trough or end of its depressing stage of its cycle before recovery commences . Overall JSE:SSW is a good pick for long term investing.
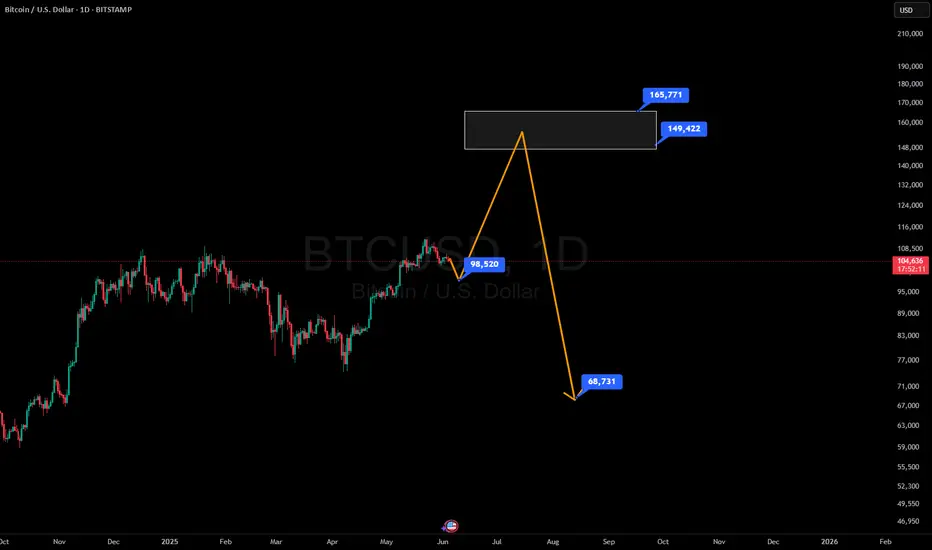
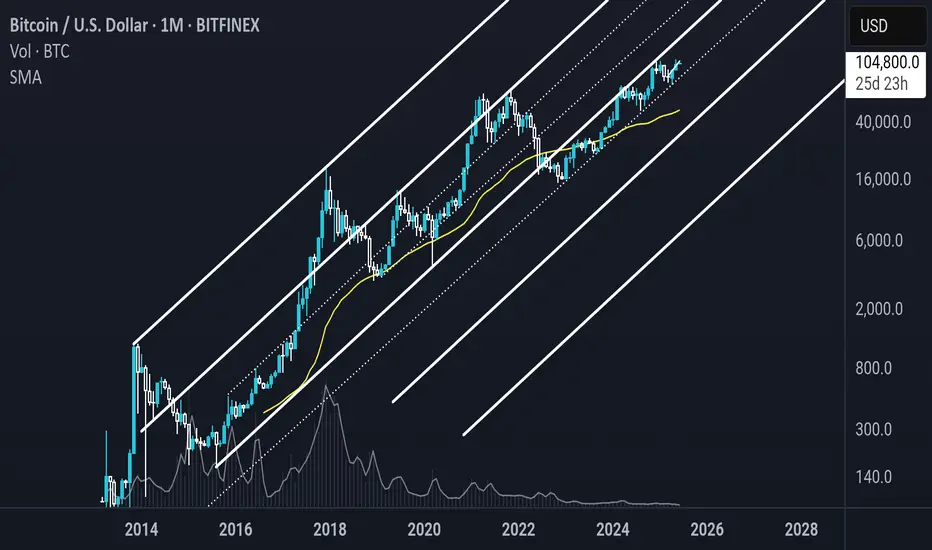
Bitcoin's Roadmap: Price Structure, Fair Value & Market RhythmSince bottoming on November 21, 2022, Bitcoin has embarked on a remarkable bull run, rising +623.5% over 927 days and reaching a new all-time high (ATH) of ~112K.
When compared to the previous bull cycle, spanning 1061 days and producing a +2086% gain, this current rally shows signs of diminishing returns, a typical behaviour of maturing markets. Traders now face a critical question: has Bitcoin peaked for this cycle, or is another surge toward ~120K+ possible?
Historical Echoes: Elliott Wave Comparison
The 2018–2021 bull market formed a five-wave Elliott structure. That cycle ended with a -77.5% correction. The current cycle similarly traces out a completed five-wave advance from the $15.5K low, suggesting we may now be in a corrective phase.
Current hypothesis: Bitcoin is in Wave B of an ABC correction, with Wave C potentially targeting $64K–$70K.
Harmonic Confirmation: Cypher Sigma Pattern
A refined harmonic formation, I call it the Cypher Sigma Harmonic Pattern (CSHP) and it has proven highly effective in volatile assets like Bitcoin. It differs from the classic Cypher by:
BC projection: 1.07–1.136 of XA (vs. 1.272–1.414)
CD retracement: 0.786–0.886 of XC
BD extension: 1.272–1.618 of BC (not present in traditional Cypher but often targets 1.272-2.0)
In 2022, this pattern predicted the bottom near $16K. Currently, another Cypher Sigma is potentially forming, pointing to a possible correction to ~$64K. This target aligns with historical level (the 2021 ATH zone) and represents a possible -40% pullback.
Multi-Layered Technical Confluence
Pitchfork Resistance: Bitcoin rejected the upper resistance (Fib 1.0–1.136 zone)
Pitchfork Golden Pocket Support: ~$64K matches the golden pocket and high-liquidity area
Fibonacci Circles: Rejection precisely at the 1.618–1.65 circle arc (~$112K)
Speed Fan 0.618: Key structural support intersects projected retracement zone
Previous 2021 ATH
Together, these tools strongly support the hypothesis of a macro top forming.
Fair Value Trend Model (FVTM) – New Indicator
As part of ongoing research into Bitcoin’s long-term valuation, I developed the Fair Value Trend Model—a logarithmic regression-based indicator tailored for Bitcoin. Here is an example on the monthly timeframe.
Key Features:
Computes a log-log regression: ln(Price) vs ln(Days since inception)
Yields a power-law growth curve: F(t) = C · ^b
Includes dynamic channel bands at user-defined percentage offsets
Projects the trend forward in time with linear extrapolation
I have just freshly published this indicator for free on TradingView. Visit my profile, add it to your chart, and explore how Bitcoin consistently revisits its fair value in bear markets before launching new macro waves.
Use Cases:
Identify overextensions above the fair value channel
Spot mean-reversion setups near the lower channel band
Gauge long-term trend continuation via slope and forecast
The indicator is best used on daily, weekly and monthly charts, and it supports both all-time and rolling-window modes.
Educational Insight:
The Fair Value Trend Model isn’t just a tool! It's a lens to view the long-term rhythm of the Bitcoin market. By understanding where the fair value lies, you gain the clarity to separate short-term volatility from long-term opportunity.
Every great trader starts with a desire to understand. If you're learning, experimenting, and observing patiently—you’re on the right path. Let this model be your guide through the noise. Trust the math, respect the cycles, and never stop refining your edge.
Study day and swing trading, improve your technical and psychological skills, and wait patiently for high-probability trade setups, whether short-, medium-, or long-term. Being patient is key.
Psychological Insight: Mastery Over Impulse
The greatest returns favour the patient. Traders who ignored the noise in 2022 and accumulated around $16K were rewarded exponentially. As Bitcoin potentially enters a correction, the same principle applies: monitor, learn, and prepare—not panic.
Top-tier traders execute based on structure, not emotion. This cycle will reward those who:
-> Study multi-timeframe confluences
Outlook: Bearish Retracement, Bullish Opportunity
While a push to $120K+ is possible, the confluence of Elliott Wave, harmonic patterns, and macro tools suggest a potential 40% retracement into ~$64K by end of 2025/early 2026. This aligns with historical patterns and may offer a great buying opportunity.
This cycle isn’t about catching the exact top—it’s about navigating it intelligently. Use tools that reflect structural value, not just reactive price action. Combine the Fair Value Trend Model with other tools to gain clarity. Most importantly: remain curious, remain disciplined.
Happy trading.
Thanks for reading =) stay sharp, stay patient, and keep evolving 🚀
_________________________________
If you found this helpful, leave a like and comment below! Got requests for the next technical analysis? Let me know.

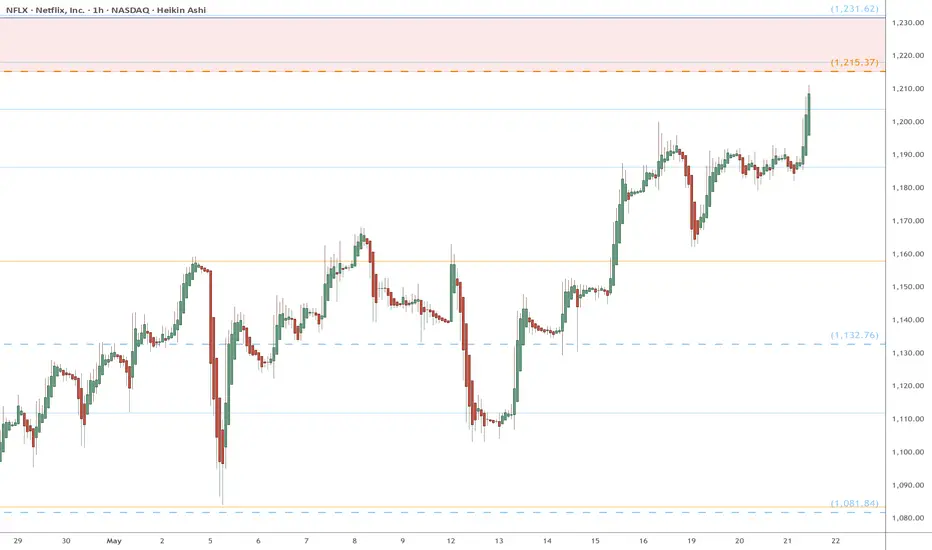
NFLX heads up into $1230: Major Resistance zone may give a DipNFLX has been on a tear but nearing a major resistance.
$1215.37 is a Golden Covid fib forming bottom bound.
$1231.61 is a minor Genesis fib forming the top bound.
It is PROBABLE that we see a dip from there.
It is POSSIBLE to consolidate within the zone.
It is PLAUSIBLE to break-and-retest to go more.
.
Previous Analysis that caught the BOTTOM
==================================================
.
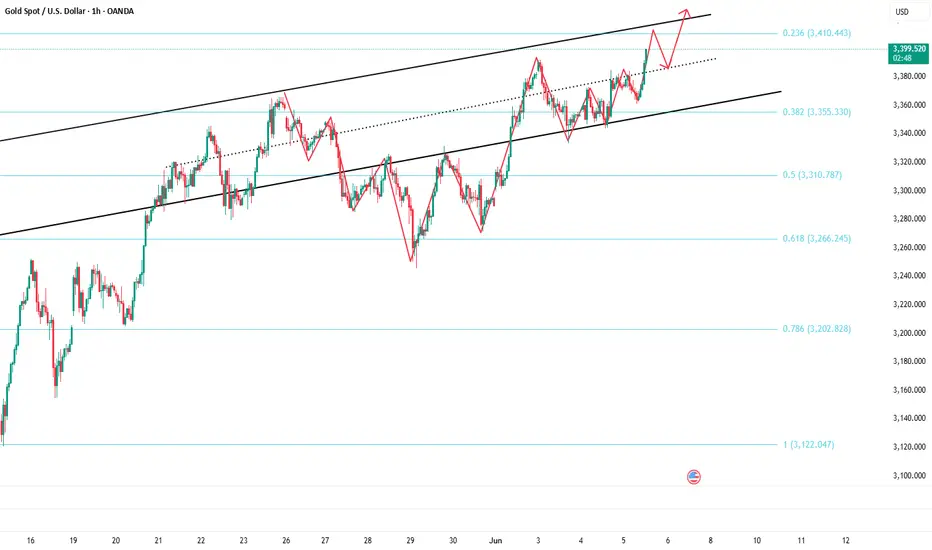
Gold Faces Key Resistance: Potential Bull Trap Before bearish 🟢 Big Picture – What’s Happening on the Chart?
This is a 1-hour chart of XAU/USD (Gold), showing the recent trend, key levels, and a forecasted movement.
At a glance, you can see that Gold has been in a bullish recovery since the drop on May 29. The market is currently testing a key resistance zone (around $3,400), which aligns with the upper boundary of the ascending channel and a previous consolidation area.
---
🔍 Technical Breakdown (Experienced View)
1. Trend Structure
The market formed a higher low after a recent dip (around May 29), suggesting bulls are gaining control.
Price is respecting an ascending trendline, showing a short-term bullish channel.
However, the price is approaching an area of confluence resistance (horizontal resistance + channel top).
2. Chart Patterns
The current setup hints at a rising wedge, which is typically a bearish reversal pattern.
The chart shows projected arrows suggesting a breakout to the upside (short-term) followed by a pullback, which matches how wedges often behave: false breakouts before the real move.
3. Fib and Zone Analysis
The color bands behind the chart likely represent Fibonacci retracement zones or volume profile levels.
Notice how the price interacts with the green/yellow zone—it’s a clear area where price historically reacts.
If price rejects from here, a pullback to the 3,350 or even 3,300 zone is possible.
---
🧠 Experienced Interpretation
If I were trading this:
Scenario A (Breakout Trap): I’d be cautious about chasing a breakout above 3,400. This could be a liquidity grab, where market makers push price slightly above resistance to trap breakout buyers, then reverse.
Scenario B (Short Setup): After the false breakout, I’d look for bearish confirmation (rejection candle, bearish engulfing, or RSI divergence) to enter a short targeting 3,350–3,300.
Scenario C (Long Continuation): If price breaks out strongly and retests the 3,400 level as support, I might switch bias and go long toward 3,450. But I’d need a clear break and hold above this level first.
---
🧭 Trading Psychology Reminder
This chart reflects anticipation. The trader behind it expects a fake-out before a drop. As an experienced trader, I wouldn’t blindly follow arrows—but I’d use them to prepare “if-then” scenarios, like:
If price breaks above resistance but closes back inside → look to short.
If price holds above breakout → ride momentum long with tight risk control.
---
✅ Summary
Current bias: Bullish short-term, bearish correction expected.
Key zones: Resistance at $3,400–$3,420; Support at $3,350 / $3,300.
Strategy: Wait for confirmation of either breakout or rejection; prepare for both outcomes.
Risk Management: Crucial at resistance zones like this—false breakouts are common traps.

Litecoin - Expecting Bearish Continuation In The Short TermM15 - Clean bearish trend with the price creating series of lower highs, lower lows.
No opposite signs.
Expecting further continuation lower until the two Fibonacci resistance zones hold.
If you enjoy this idea, don’t forget to LIKE 👍, FOLLOW ✅, SHARE 🙌, and COMMENT ✍! Drop your thoughts and charts below to keep the discussion going. Your support helps keep this content free and reach more people! 🚀
--------------------------------------------------------------------------------------------------------------------
Disclosure: I am part of Trade Nation's Influencer program and receive a monthly fee for using their TradingView charts in my analysis.

GBPUSD 4H MAJOR REVERSAL SETUP – WATCH FOR THE BREAK!Hey There;
The Head & Shoulders (H&S) pattern in GBPUSD is becoming more defined, approaching a critical neckline level. If a breakout occurs, it could trigger a strong downward move, pushing the price toward new support levels.
Right now, sellers are gaining strength while buyers attempt to defend key support zones. A confirmed close below the neckline could accelerate the sell-off.
📌 If the breakout happens, I’ll share target levels with you—stay tuned for updates
I meticulously prepare these analyses for you, and I sincerely appreciate your support through likes. Every like from you is my biggest motivation to continue sharing my analyses.
I’m truly grateful for each of you—love to all my followers💙💙💙

GOLD → Retesting resistance may lead to a breakoutFX:XAUUSD is still bullish. The price is consolidating in the range of 3390-3345, with an intermediate bottom forming inside the channel, which overall indicates positive signs.
On Thursday, gold is consolidating ahead of $3390. Consolidation after growth, within a bullish trend, is a good sign. But, on the one hand, the price is supported by growing tensions between Russia and Ukraine. On the other hand, optimism about US trade negotiations with Canada, the EU, and China is strengthening the dollar and holding back demand for gold.
Additional pressure on the dollar is coming from weak US macro statistics, especially ADP data and the decline in the ISM Services PMI, which have reinforced expectations of Fed policy easing. Traders are waiting for further signals from the regulator.
Resistance levels: 3391.4, 3414, 3435
Support levels: 3365, 3345
Technically, gold is rising and forming a retest of consolidation resistance. If the 3391 level is broken, the price may head towards 3435. Before breaking through resistance, a correction or retest of 3365 may form. However, consolidation near 3391 and a gradual squeeze towards the level will increase the chances of a breakout and growth.
Best regards, R. Linda!

Sandur Manganese: Ready for ₹700+?Market Cap: ₹7,794 Cr
Sector: Metals & Mining – Manganese & Iron Ore
Sandur Manganese & Iron Ores Ltd (SMIORE) is a vertically integrated mining company engaged in manganese and iron ore production. With operations rooted in Karnataka and a legacy since 1954, the company continues to benefit from commodity demand and disciplined capital management.
🔍 Fundamental Snapshot
In FY24, Sandur reported revenue of ₹1,252 Cr and net profit of ₹239 Cr, resulting in a solid net margin of 19.06%. EPS stands at ₹29.00, while return ratios remain healthy – ROE at 11.03% and ROCE at 14.97%.
The company maintains a conservative financial structure with a debt-to-equity ratio of 0.54 and a strong current ratio of 4.34. It also rewards shareholders with a dividend yield of 1.31%.
Though not a high-growth play, Sandur’s consistent cash flows, low debt, and operational leverage in a cyclical sector make it a solid bet for long-term value seekers.
📈 Technical Analysis – Early Reversal from 200 EMA
The stock recently reversed sharply from the 200 EMA and daily demand zone between ₹443.65 and ₹455, suggesting strong support and accumulation interest. The current close of ₹483.50 marks a reclaim of the key moving average and signals potential trend change.
🔧 Key Technical Levels:
Reversal Zone (Support): ₹443.65 – ₹455
Breakout Level: ₹514.15
Resistance 1 (R1): ₹628.25 – Weekly Supply Zone
Resistance 2 (R2): ₹742.35 – Long-term Target
Near-Term Structure: Price may retest ₹514 before trending upward in a higher-high, higher-low sequence.
A move above ₹514.15 will confirm a breakout and may trigger momentum towards the ₹628–₹742 zone.
✅ Summary
Sandur Manganese offers a compelling techno-fundamental setup:
Debt-light and cash-flow rich
Strong reversal from technical support
Breakout above ₹514 could open up ₹628 and ₹742 as next targets
Ideal zone to track for re-entry: ₹455–₹470 range
Traders and long-term investors can watch for momentum confirmation or dips toward support for strategic entry.
Disclaimer: lnkd.in

POLAND - WIG20 - ALLEGRO going UP soon (MID THERM)Im watching this asset few months now with all its latest ups and downs. There is my trading plan for near future. Based on Elliot waves theory and Wyckoff accumulation schematic i think that we are see higher tops soon.
Elliot: Currently in the beginning of third impulse wave. Second wave ended at 0.618 of first wave.
Wyckoff: End of phase C / beginning of phase D
First target 38-39 PLN
Second target 42-45 PLN
Third target (end of 3rd impulse wave) 49-52 PLN.
Let me know what you think in the comments below, happy trading.
Its only my opinion, not investing advice.

EURUSD Volatility Alert - ECB Rate Decision/US Non-farm PayrollsEURUSD has experienced a choppy start to the week so far. Initially trading from opening levels around 1.1345 up to a 6-week high of 1.1455 early Tuesday morning, before running into profit taking and then bouncing between these two levels in response to various drivers, including updates on US/China trade discussions, Eurozone inflation, US economy ,and constantly changing interest rate differentials.
Looking forward, there may be potential for this type of price action to continue over the next two trading days, as traders first digest the ECB interest rate decision, which is released at 1315 BST later today, then the comments of ECB President Lagarde in the press conference that commences at 1345 BST.
A 25bps (0.25%) interest rate cut from the ECB is fully anticipated, so is unlikely to cause much of a stir. However, comments from Madame Lagarde in the press conference could lead to volatile EURUSD price action, depending on if she outlines whether policymakers remain open to further cuts, as Eurozone inflation (May CPI 1.9% YoY) moves below the central bank’s 2% target, or if now is the time for a pause to assess the potential impact of US tariffs and future European defence/infrastructure spending.
On Friday, the dollar side of the EURUSD currency pair, could be impacted significantly by the outcome of the latest update on the US labour market in the form of the US Non-farm Payrolls release at 1330 BST.
Data out earlier in the week has so far offered a mixed assessment of the US labour market during the on-going trade tariff uncertainty. However this payrolls update is the one that usually grabs the attention of traders and investors and probably holds more significance.
Their focus is likely to be on the direction of the unemployment rate (currently 4.2%) and average hourly earnings, where any large deviation from market expectations may see EURUSD volatility increase into the weekend, especially if it indicates a weakness in the US economy.
Technical Update:
Today’s ECB announcement, followed by payrolls on Friday, has the potential to be the next important EURUSD sentiment driver, with the reaction to these events possibly offering clues to the next path for price activity.
It has already been an impressive recovery in EURUSD since the May 12th session low at 1.1065, a move that has now seen closing breaks above resistance at 1.1425, which is equal to the April 28th last recovery failure high.
However, as we approach the ECB decision and payrolls release, what are the potential support and resistance levels traders may be watching?
Potential Resistance Levels:
Price strength so far this week has been capped by sellers at 1.1455 on June 3rd. As such, this level represents a first possible resistance focus, as having found sellers at this point previously, they may be found again.
While breaks above the 1.1455 high will not guarantee continued price strength, it could open potential for an upside push in price towards the April 21st high 1.1573, possibly further, if this were to give way on a closing basis.
Potential Support Levels:
After a period of price strength, such as that seen since the May 12th low, it is potentially the 38% Fibonacci retracement of the upside move, which in EURUSD stands at 1.1306, that may be viewed as a first support.
As such, if breaks below 1.1306 are seen over coming sessions, it may lead to a deeper decline in price towards 1.1214, which is the 61.8% Fibonacci retracement, possibly further.
The material provided here has not been prepared in accordance with legal requirements designed to promote the independence of investment research and as such is considered to be a marketing communication. Whilst it is not subject to any prohibition on dealing ahead of the dissemination of investment research, we will not seek to take any advantage before providing it to our clients.
Pepperstone doesn’t represent that the material provided here is accurate, current or complete, and therefore shouldn’t be relied upon as such. The information, whether from a third party or not, isn’t to be considered as a recommendation; or an offer to buy or sell; or the solicitation of an offer to buy or sell any security, financial product or instrument; or to participate in any particular trading strategy. It does not take into account readers’ financial situation or investment objectives. We advise any readers of this content to seek their own advice. Without the approval of Pepperstone, reproduction or redistribution of this information isn’t permitted.

BTCUSDT Technical InsightThe Buy Back Zone is currently serving as a strong demand area and should be closely monitored for informed decision making. This zone has acted firmly as support, providing a solid base for the completion of the wave (4) correction, which concluded precisely at the lower boundary of the descending channel.
We now anticipate the development of a breakout structure within the descending channel (a corrective flag), suggesting the initiation of wave (5) with an upside projection toward $120,661.
A decisive breakout and successful retest above $107,570 will validate bullish momentum and pave the way for continuation towards $110,314, and eventually the $120K zone, aligning with the full extension of the broader impulse wave.
At this stage, patience is key. Allow price action to confirm strength above resistance before committing to aggressive positioning. The bullish market structure remains intact as long as the Buy Back Zone continues to hold.
Feel free to share your thoughts, are you tracking this wave count with us?


Bearish Setup Forming Near Resistance | Fib + Order Block🔍 Technical Breakdown
Price is currently hovering around 3,371, testing a key resistance zone. This level aligns with a Fibonacci retracement and a marked order block, suggesting a potential reversal area.
Resistance Zone: 3,371.487
Support Levels: 3,361.705 and 3,354.190
Indicators Used: Fibonacci Retracement, Order Block
A red arrow on the chart illustrates a projected bearish move. If price fails to break above the resistance, we may see a retracement toward the lower support levels.
📌 Trade Idea
Watch for bearish confirmation (e.g., rejection candles, volume spikes) near the resistance zone. A short position could be considered with a target near the support levels and a stop above the resistance.

BTC log pitchfork (re-up)the BTC Log scale Pitchfork shows perfect Fib levels being respected. I don't know what it means or how to interpret this, no price target or direction from this, but the levels seem significant so I'm just noticing and playing the levels being held. All I know is buy the yellow the line (SMA40), and I drew the next lower pitchfork levels according to proportions.
Also, last season's ATH is always the next bearmarket season's bottom.
When in doubt, zoom out.
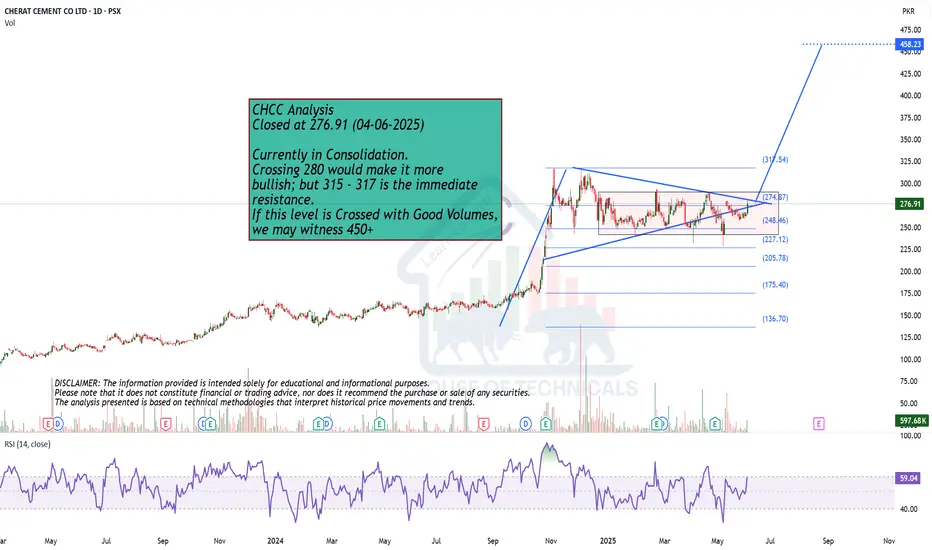
Currently in Consolidation.
Closed at 276.91 (04-06-2025)
Currently in Consolidation.
Crossing 280 would make it more
bullish; but 315 - 317 is the immediate
resistance.
If this level is Crossed with Good Volumes,
we may witness 450+
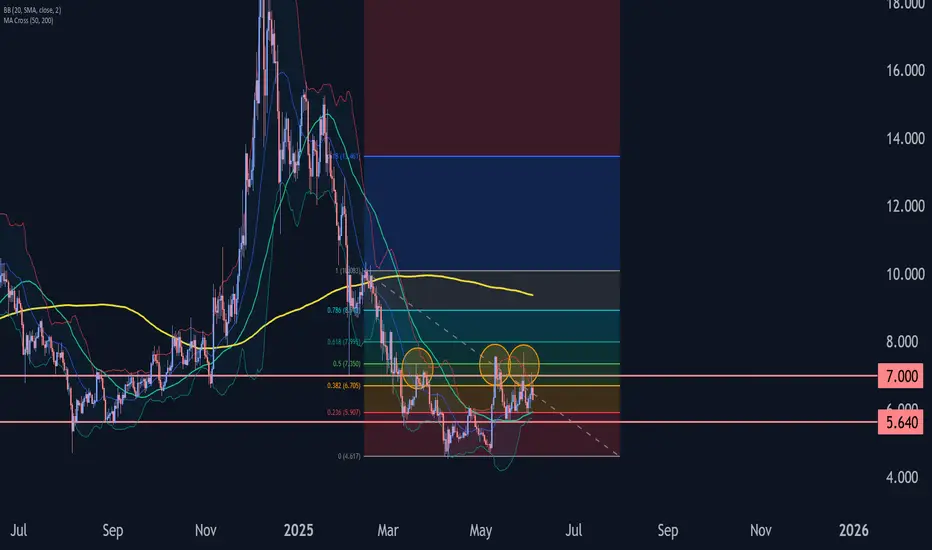
Uniswap coin Wave Analysis – 4 June 2025
- Uniswap coin reversed from resistance level 7.00
- Likely to fall to support level 5.640
Uniswap coin recently reversed down from the pivotal resistance level 7.00 (former strong support from February, which has been reversing the price from March).
The resistance level 7.00 was strengthened by the upper daily Bollinger Band and the 38.2% Fibonacci correction of the downward impulse from February.
Uniswap coin can be expected to fall to the next support level 5.640, which stopped the 2 previous corrections ii and (ii).
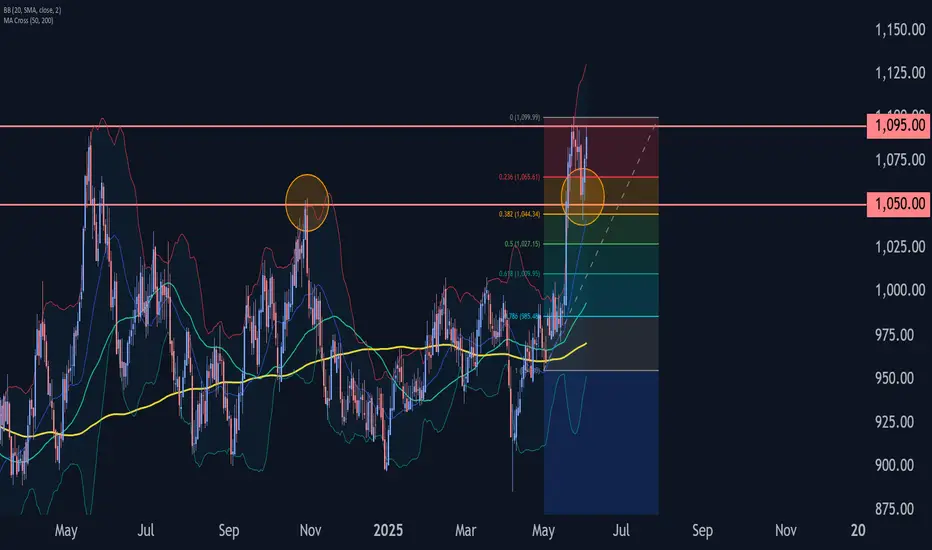
Platinum Wave Analysis – 4 June 2025
- Platinum reversed from support zone
- Likely to rise to resistance level 1100.00
Platinum recently reversed up from the support zone between the support level 1050.00 (former multi-month high from October) and the 38.2% Fibonacci correction of the upward impulse from May.
The upward reversal from this support zone continues the active impulse wave iii of intermediate impulse wave 3 from April.
Platinum can be expected to rise to the next resistance level 1100.00, the breakout of which can lead to further gains toward 1140.00.
TRUMPUSDT – Daily Technical AnalysisTRUMPUSDT – Daily Technical Analysis
The price has reached a key daily support level at $10, showing potential signs of a bullish reversal.
If the support holds, we may see a move toward the resistance area around $14, offering a decent upside opportunity.
In a more bearish scenario, the price could extend its correction to the $9 support zone, which may serve as a stronger foundation for the next upward impulse.
🟢 Key Support Levels: $10 (daily), $9 (secondary support)
🔴 Resistance Zone: $14
Stay tuned for more technical insights and updates.

EUR/USD Coils Below Resistance Ahead of ECB, NFPEuro broke above the April downtrend last month with price surging more than 3.5% off the May low. The advance failed at technical resistance into the start of June at the 1.618% extension of the May advance near 1.1455. The focus is on a reaction off this mark with a breakout of the weekly opening-range to offer some guidance in the days ahead.
The weekly-range is now set just above the objective weekly / monthly open at 1.1347. Subsequent support seen at the 2023 swing high at 1.1276 with near-term bullish invalidation at the 2024 swing high / 61.8% retracement at 1.1214- a break / close below this threshold would be needed to suggest a more significant high is in place / a larger reversal is underway towards key support at 1.1040/74.
A topside breach of the weekly opening range exposes subsequent resistance objectives at the 2025 high-day close (HDC) at 1.1514 and 1.1564/73- a region defined by the 100% extension of the May advance and the yearly swing high. Look for a larger reaction there IF reached with a daily close above needed to mark uptrend resumption / fuel the next major leg of the Euro advance towards 1.17.
Bottom line: A breakout of the April downtrend is now testing the first major resistance hurdle with the weekly / monthly opening-ranges taking shape just below- look for the breakout. From a trading standpoint, losses would need to be limited to 1.1214 IF price is heading higher on this stretch with a close above the yearly high needed to mark resumption of the broader uptrend. ECB on tap tomorrow with NFPs slated for Friday- stay nimble into the weekly close.
-MB

AUD/USD Poised for Breakout ahead of NFPsThe Australian Dollar broke back above the 200-day moving average this week with AUD/USD testing resistance at the 65-handle today. Its decision time for the Aussie as the bulls threaten to breakout of a multi-month range in price.
Aussie is testing resistance today at the 2025 high-close / 61.8% extension of the Friday rally at 6495-6504 with key resistance seen just higher at 63540/50- a region defined by the 61.8% retracement of the September decline and the 100% extension. Note that the upper parallel converges on this threshold into the close of the week and a breach / close above would be needed to fuel the next major leg of the Aussie advance. Initial breakout objectives eyed at the September low at 6622 and the November high-day close (HDC) at 6680.
Initial support rests with monthly open / 200-day moving average at 6432/43 and is backed closely by the May open at 6402. Ultimately, a break / close below the April / August lows at 6348/62 would be needed to suggest a more significant high is in place / a larger correction is underway towards broader bullish invalidation at 6300- look for larger reaction there IF reached.
Bottom line: Aussie is attempting to mark a fresh yearly high-close today but still shy of uptrend resistance just higher. The immediate focus is on a breakout of the weekly opening-range for guidance with the long-bias vulnerable into the upper parallel. From at trading standpoint, losses would need to be limited to 6400 IF price is heading higher on this stretch with a close above the 6550 needed to fuel the next major leg of the April advance.
-MB

BTC/USD 1H Short-Term🔍1. General Context and Short-Term Trend
Short-Term Trend: The last dozen or so candles have shown strong fluctuations — a typical sideways market (consolidation) after a clear upward impulse and a quick drop. The price is currently trading in the range of around $104,900–$106,500.
Recent Strong Move: Clear upward impulse from around $104,900 to around $106,900, followed by a quick correction.
📌2. Supports and Resistances (H1)
Supports:
$105,000–$105,200 — Bottom of local wicks and several demand tests.
$104,900 — Lowest point of the last few hours, clear buyer reaction.
Resistances:
$106,200–$106,400 — Upper area of several candles, strong price rejection.
106,900–107,000 USD – The peak of the last impulse, a place of clear supply.
✅3. Candlestick formations and price action
Pin bar / long wick: Candles with long lower wicks are visible around 105,000 USD, which suggests that buyers are defending support.
Double top? (Double top): Peaks around 106,900 USD (03.06 and 04.06) – a classic signal of a potential change in direction to the lower.
Possible consolidation: The last few hours have been a series of alternating candles, signaling the lack of a clear advantage of bulls or bears.
🧠4. Technical indicators (MACD and RSI)
MACD (lower panel)
The MACD line crossed the signal line from the bottom to the top, then a quick correction and currently the MACD is close to zero – no clear trend, momentum has slowed down.
MACD Histogram: Declining, close to zero, suggesting potential lack of strong trend and possibility of further consolidation.
RSI (middle panel)
RSI value ~44–48 – not overbought or oversold, neutral market state.
No divergence – RSI generally follows price, no strong divergences are visible.
RSI bounced off 30 (tested oversold zone and returned to neutral range).
🧠5. What could be important?
Volatility Squeeze: Low volatility after a sharp move often heralds another impulse.
Potential Fakeout: If support at $104,900 is broken falsely (e.g. quick wick and return), a move up could occur.
No clear trend on the hourly chart, rather sideways market in the short term.
📊Summary and scenarios
Scenario 1 (bullish):
If the $105,000-$104,900 level holds, we can expect a test of $106,200-$106,400 and perhaps another attempt to approach $107,000.
Scenario 2 (bearish):
If the $104,900 support is broken (with a candle closed below this level), the next target is around $104,500 and below.
What to watch out for?
Timing of macro data releases - may increase volatility.
Sudden breakouts from consolidation - no trend = higher risk of sudden, false moves.
