QUICK Ready for a Major Breakout!#QUICK is in a strong uptrend and currently testing the 0.618 Fibonacci retracement level—a golden buying zone!
Technical Outlook:
🔹 Price is consolidating at the key support level of 0.618 FIB—historically a strong reversal zone.
🔹 A breakout above 0.02830 (previous high) could lead to new higher highs!
🔹 High probability of a bullish continuation if momentum holds.
Trading Plan:
🔹 Entry: Current Market Price (0.02570 - 0.02490)
🔹 Target 1: 0.02830
🔹 Target 2: New highs after breakout
🔹 Stop-Loss: 0.02570 - 0.02490
What’s your take on #QUICK? Will it break 0.02830 and fly higher?
Drop your thoughts in the comments!
LIKE & FOLLOW for more high-probability trade setups!
#QUICK #CryptoTrading #Fibonacci #Breakout #Bullish #CryptoAnalysis #TradingView
Fibonacci


DXY Chart SummaryEh bro, this chart showing two roads for Dollar Index lah.
If price can break above that 100 level ah, then maybe will fly up to 92-94 area (last resistance zone).
But if kena reject at 100, then jialat, price can drop back down to 110 area again.
So now hor, this green box is the decision point — break or reject.
Wait for clear move first, don’t simply jump in."

AUD/USD For Bullishwait for pull-back near by entry point and then go long
general trend is up trend
have fun :)

USDCHF I Weekly CLS Continuation I KL - OB I Model 2Hey Traders!!
Feel free to share your thoughts, charts, and questions in the comments below—I'm about fostering constructive, positive discussions!
🧩 What is CLS?
CLS represents the "smart money" across all markets. It brings together the capital from the largest investment and central banks, boasting a daily volume of over 6.5 trillion.
✅By understanding how CLS operates—its specific modes and timings—you gain a powerful edge with more precise entries and well-defined targets.
🛡️Follow me and take a closer look at Models 1 and 2.
These models are key to unlocking the market's potential and can guide you toward smarter trading decisions.
📍Remember, no strategy offers a 100%-win rate—trading is a journey of constant learning and improvement. While our approaches often yield strong profits, occasional setbacks are part of the process. Embrace every experience as an opportunity to refine your skills and grow.
Wishing you continued success on your trading journey. May this educational post inspire you to become an even better trader!
“Adapt what is useful, reject what is useless, and add what is specifically your own.”
David Perk ⚔

NZD/USD For Bullishwait for pull-back near entry point or FVG and then go long
general trend is up trend
have fun :)

EUR/USD For Bullishwait for pull-back near by entry point or Fear Value Gap and then go long
general trend is up trend
have fun :)

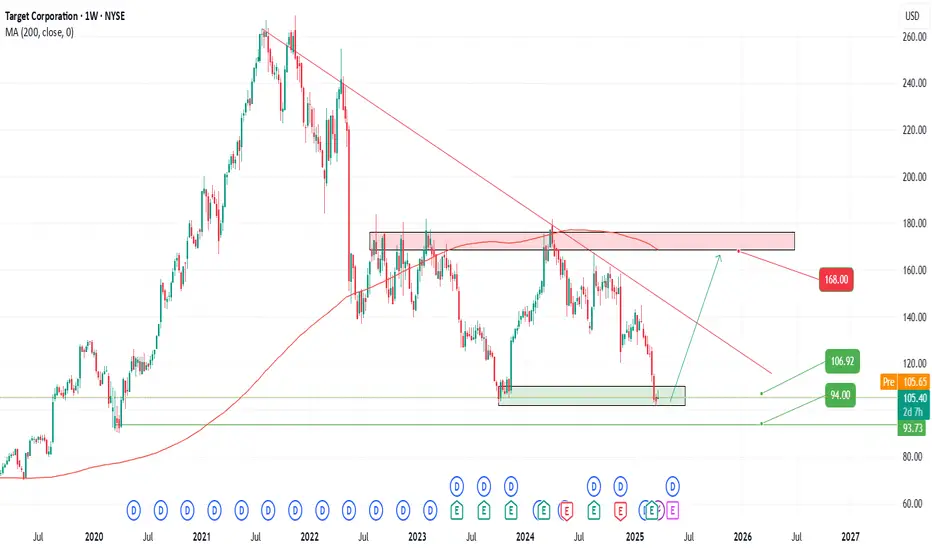
TGT Trade Idea –2025🚨 NYSE:TGT is shaping up with some juicy potential in this current market cycle 📈
🎯 Entry Points (Buy Zones):
1️⃣ $107 – Aggressive entry for early birds
2️⃣ $100 – Solid mid-range level with strong historical support
3️⃣ $94 – Deep dip buy for the patient sniper
💸 Profit Targets:
✅ $141 – First take profit zone
✅ $158 – Stretch target
🚀 $168+ – Blue sky potential if momentum keeps rolling
🧠 Risk Management:
Always position size properly and consider a stop loss based on your risk tolerance. Nothing goes up in a straight line – keep your strategy tight.
📝 Disclaimer: This is not financial advice. These are personal trading ideas based on current chart trends and market sentiment. Always do your own research and consult with a licensed financial advisor before making any investment decisions.
Stay sharp & trade smart! 💼📊
PEPE Ready to Dump? This Key Zone Could Trigger a Sharp ReversalYello Paradisers — did you catch the recent shift on PEPEUSDT? If not, now’s the time to zoom in, because the setup is looking primed for a big move, and you don’t want to be caught on the wrong side.
💎PEPEUSDT has broken out of Ascending Channel & shown a clear bearish CHoCH (Change of Character), confirming a shift in market structure. Following that, we’ve now seen a proper pullback. Currently, the price is sitting right at a critical resistance zone.
💎What makes this zone especially significant is the confluence of technical factors stacked at the same level — the 200 EMA, a Fair Value Gap (FVG), and the Fibonacci Golden Zone are all present. This combination significantly increases the probability of a bearish move from here.
💎If PEPE breaks out and closes a candle above our invalidation level, the entire bearish idea gets invalidated.
🎖Paradisers; the next 6–9 months will be juicy for some and painful for others. Discipline, patience, robust strategies, and trading tactics are the only ways you can make it long-term in this market.
MyCryptoParadise
iFeel the success🌴

Trade Update for Mentorship Members $NVDA $TSLA $SPY $TSLLCaution around possible bear trap/liquidity sweep. Discussing support & resistance/Fib levels to watch. Discussing trade exits, and gameplan for trading today.

EURUSD - Correction in the short termGiven that the order flow is bullish on the daily and 15-minute time frames, we expect a temporary correction to begin. Of course, it should be noted that Trump’s recent speech has caused erratic price movement, but my view is that the price hit the daily order block during this speech and collected liquidity above the 4-hour order block.
Therefore, we will soon see a bearish order flow on the short time frame, and this movement could go down to the bottom of the 4-hour swing structure (1.07417 range) in the first stage.

DXY going downDXY is ready for a leg down, after bear div and topping within projected time on Daily. On 4H it's building up to a nice #SBS shape, where we can expect a move down. 4H time projection says downwards into start of, or mid, February.

XAUUSD - top in?Gold followed Feigenbaum projections nicely with a retracement down to fib -0.6714 before extending higher into blue target zone between fib 3.5699 and 4.6692. Should turn down from here

Berachain BERA price analysis#BERA price has not been drained "to zero", as is common with all newly listed coins over the past year, which is a good sign.
The OKX:BERAUSDT price is currently in consolidation without much volume, either on the buy or the sell side.
It is worth following it, especially in the range of $5.50-6, if it is not allowed to go lower, this will be the second good sign.
📈 Well, there is no ceiling from above ... what would you like to see the price of the #Berachain token?

ADA - Bearish Reversal Setup from Fair Value Gap🚀 ADAUSDT - 1H Chart Analysis 🚀
📊 Current Market Structure:
ADA is moving within a rising channel 📈, approaching a key resistance zone where a Fair Value Gap (FVG) is present. This area aligns with a significant Fibonacci retracement zone, making it a strong potential reversal point.
📌 Technical Insights:
🔹 Price is trading inside a well-defined bullish channel.
🔹 Approaching a major supply zone with previous reaction points.
🔹 Bearish rejection is expected in this area, leading to a potential drop.
📉 Trade Expectation:
A reaction from the FVG could lead to a downward move, as highlighted by the red arrows. If price confirms a rejection, a bearish shift in structure could occur, offering short opportunities.
⚠️ Risk Management Tip: Always wait for confirmation before acting on a setup. Managing risk effectively is key to long-term success!
📢 What do you think? Will ADA respect the FVG or push higher? Share your thoughts! 💬📉🚀

Expect EURUSD two way price action now! Intraday Update: The EURUSD has hit the 1.1100 level, going as high as 1.1146 and surpassing the long term trend line of 18yrs near 1.6000. This is a big resistance, expect two way price action around these levels.

GOLD → Correction. Liquidity is the target. News aheadFX:XAUUSD on the background of yesterday's news reaches the target of 3166 and enters the phase of deep correction on the background of profit-taking. The level of economic risks is still high
Despite the pullback, the gold price retains much of its recent record high, thanks to rising risks of a global trade war and a US recession.
Gold corrects from record $3,168 but remains strong amid trade and recession risks. The correction is due to the following nuances: Profit taking ahead of key US jobs data. Waiting for jobless claims and services PMI.
But, Trump's new tariffs, a weaker dollar and lower bond yields are driving gold buying.
Resistance levels: 3116, 3135
Support levels: 3107, 3097
Against the background of high economic risks, falling dollar index, gold still has chances to continue its growth. False breakdown of support may give such a chance.
Regards R. Linda!

EOSUSDT → False Breakeout of resistance (counter-trend )BINANCE:EOSUSDT.P within the consolidation distribution 0.54 - 0.6 reaches the key resistance and forms a false breakdown without the possibility of continued growth.
The cryptocurrency market is showing weakness, especially after yesterday's Trump speech and the approval of new Tariffs, which creates risks and pressure on the cryptocurrency market. Bitcoin is back in the red zone after rallying, while altcoins will continue to look for a new bottom. EOS stands out in this list, which strengthened quite strongly and the purpose of this maneuver was countertrend accumulation and liquidity capture relative to the range of 0.7 - 0.8. The distribution is tempered by a false breakout of the level 0.82 - 0.86
Resistance levels: 0.82, 0.86
Support levels: 0.793, 0.666
If the bears hold the resistance 0.82 - 0.86 and the consolidation under the level will end with the breakout of the trigger 0.793 and price consolidation in the selling zone, it may provoke a reversal and fall to the zones of interest: fvg, 0.64, 0.541.
Regards R. Linda!

GOLD → Consolidation. News. False breakdown. Growth?FX:XAUUSD and TVC:DXY in consolidation ahead of important news and Trump's speech. Economic risks are rising and the future outlook depends on fundamental data...
Trade tensions support gold demand. Trump may impose global tariffs of up to 20% which will increase risks to the economy. Investors are piling into gold in anticipation, pushing its price to a record $3,150
A key factor is the details of the tariffs. If tariffs are softer than expected, gold could fall to intermediate support zones. If the trade war escalates, the rise could continue beyond 3150
Economic risks are rising and gold may test 3107 - 3100 support before rising further. Technically, 3100 - 3107 is a zone of interest and liquidity. If bulls hold the support, gold will continue to rise. Otherwise, gold may form a correction towards 3075 - 3065
Resistance levels: 3126, 3135, 3147
Support levels: 3107, 3100, 3091
The price is correcting to consolidation support in the moment. A strong and sharp fall is fraught with the risk of a liquidity grab and a false breakdown. In this case, gold may strengthen to one of the key resistances. But the further and medium-term development of events depends on the evening news....
Regards R. Linda!

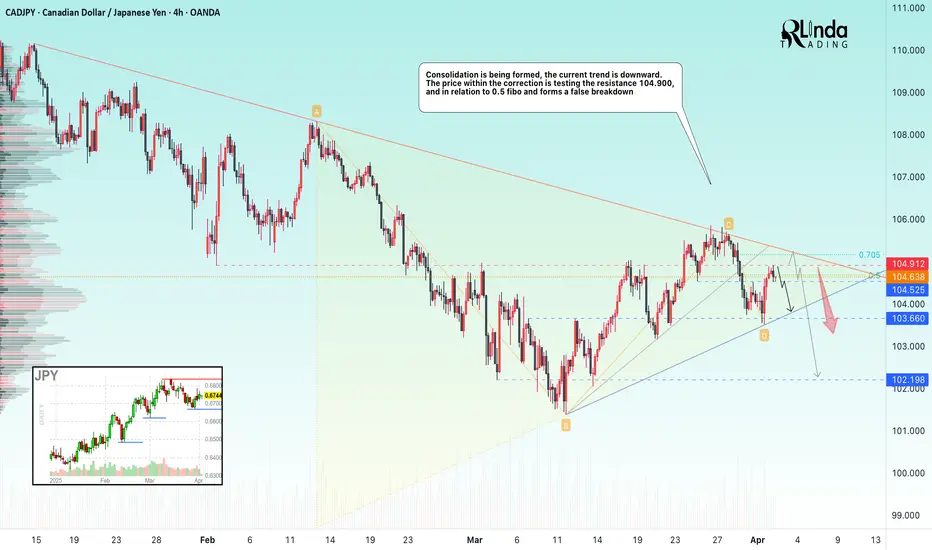
CADJPY → Consolidation before the news. DowntrendFX:CADJPY continues to forge a downtrend, but within the current movement a symmetrical triangle of accumulative nature is forming
The currency pair may continue its decline due to the strengthening of the Japanese Yen, while the Canadian is consolidating in a narrow range.
The situation may be accelerated by today's news, namely Trump's speech, where he may announce new tariff measures.
Technically, the price is correcting after the false break of 103.56, being below the previously broken upside support. Price is testing key resistance at 104.90, and against 0.5 Fibo is forming a false breakout. A consolidation below 104.69, a break of 104.525 could trigger further decline.
Resistance levels: 104.900, 105.36, 105.74
Support levels: 104.525, 103.56
There are important news ahead, high volatility is possible, especially at the moment of Trump's speech, which may set a medium-term tone in the market.
The currency pair is in consolidation on the background of the downtrend and the priority is to expect a continuation of the fall
Regards R. Linda!
IDBI BANK SWING TRADE📊 Price Action & Trend Analysis
Analyzing market trends using price action, key support/resistance levels, and candlestick patterns to identify high-probability trade setups.
Always follow the trend and manage risk wisely!
Price Action Analysis Interprets Market Movements Using Patterns And Trends On Price Charts.
👉👉👉Follow us for Live Market Views/Trades/Analysis/News Updates.

Gold (XAU/USD) Price Action Update📊 Gold (XAU/USD) Price Action Update 🎯
🔹 Current Price: 3,130.15
🔹 Timeframe: 1H
📌 Key Support Levels (Demand Zones):
🟢 3100-3107 – First Support (Waiting for Confirmation)
🟢 3066-3073 – Second Support
🟢 3048-3050 – Third Support
📈 Bullish Scenario:
If price holds above 3100, we might see a push towards 3150+ and beyond.
A breakout above 3155 could confirm a strong bullish continuation.
📉 Bearish Scenario:
If price breaks below 3100, the next support zones at 3066-3073 will be key reaction areas.
A break below 3066 could signal a deeper retracement towards 3048-3050.
⚡ Trading Tip:
✅ Look for confirmations before entering buy/sell trades.
✅ Watch for bullish rejection at demand zones for long positions.
✅ Sell near resistance with bearish confirmation.
#Gold #XAUUSD #ForexTrading #PriceAction #TechnicalAnalysis #SmartMoney #ForexSignals #GoldTrading #GoldBulls #GoldBears

NQ Power Range Report with FIB Ext - 4/3/2025 SessionCME_MINI:NQM2025
- PR High: 19037.00
- PR Low: 18819.00
- NZ Spread: 487.25
Key scheduled economic events:
08:30 | Initial Jobless Claims
09:45 | S&P Global Services PMI
10:00 | ISM Non-Manufacturing PMI
- ISM Non-Manufacturing Prices
AMP temporarily increased margin requirements to double the standard rate ahead of Trump tariff announcement
- Over 740 point session gap down
- Extreme volatile open aligned with tariff anticipation
- Value decline continues to 18000 inventory following touch and go off daily Keltner average cloud
- Auction rotating back to previous session low
Session Open Stats (As of 12:25 AM 4/3)
- Session Open ATR: 484.77
- Volume: 85K
- Open Int: 249K
- Trend Grade: Bear
- From BA ATH: -15.7% (Rounded)
Key Levels (Rounded - Think of these as ranges)
- Long: 20954
- Mid: 19814
- Short: 18675
Keep in mind this is not speculation or a prediction. Only a report of the Power Range with Fib extensions for target hunting. Do your DD! You determine your risk tolerance. You are fully capable of making your own decisions.
BA: Back Adjusted
BuZ/BeZ: Bull Zone / Bear Zone
NZ: Neutral Zone
