Mastering chart patterns - How to use them in trading!Chart patterns are visual formations created by the price movements of a financial asset—like a stock, currency, or cryptocurrency, on a price chart. Traders use these patterns in technical analysis to predict future market direction based on historical behavior. The main chart patterns are the reversal and continuation patterns.
-------------------------------
What will we discuss?
- Bullish reversal patterns
- Bearish reversal patterns
- Bullish continuation patterns
- Bearish continuation patterns
-------------------------------
Bullish reversal patterns:
Double bottom
A double bottom in trading is a bullish reversal pattern that signals the potential end of a downtrend and the beginning of an uptrend. It forms when the price of an asset falls to a low, bounces back up, then drops again to roughly the same low before rising once more. This creates a "W" shape on the chart.
How to trade it:
Before entering a trade, wait for the price to break back above the neckline with strong volume, as this indicates a potential bullish reversal. Once the breakout is confirmed, look for an entry on the pullback to the neckline.
Inverted head and shoulders
An inverted head and shoulders is a bullish reversal pattern that typically forms after a downtrend and signals a possible shift to an uptrend.
It consists of three parts:
* The left shoulder, where the price makes a low and then bounces.
* The head, which is a deeper low followed by another bounce.
* The right shoulder, a higher low similar in level to the left shoulder.
How to trade it:
Before entering a trade, wait for the price to break above the neckline with strong volume, as this confirms the pattern and signals a potential upward move. After the breakout, it's important to wait for a retest of the neckline to look for an entry. Traders typically place a stop-loss just below the right shoulder to manage risk.
Falling wedge
A falling wedge is a bullish chart pattern that often signals a potential reversal or continuation of an uptrend, depending on where it forms in a price trend.
It appears when the price is moving lower but within a narrowing range, creating two downward-sloping, converging trendlines. Both the highs and lows are falling, but the lower highs are coming down faster than the lower lows, which shows that selling pressure is losing strength over time.
How to trade it:
Wait for the falling wedge to break above the downward trendline and for the price to reclaim the most recent lower high. A breakout alone isn’t always reliable, sometimes the price moves briefly above the trendline without making a higher high, resulting in a fake-out. To confirm the move, wait for a clear higher high and then look to enter on the retracement that follows.
-------------------------------
Bearish reversal patterns
Double top
A double top is a bearish reversal pattern that signals a potential shift from an uptrend to a downtrend.
It forms when the price reaches a high, pulls back, then rallies again to the same or similar high but fails to break above it. This creates an "M" shape on the chart. The neckline is the support level at the low point between the two peaks. When the price breaks below this neckline with strong volume, it confirms the pattern and suggests that selling pressure is taking over.
How to trade it:
Before entering a trade, wait for the price to break below the neckline with strong volume, as this indicates a potential bearish reversal. Once the breakout is confirmed, look for an entry on the pullback to the neckline.
Head and shoulders
A head and shoulders is a bearish reversal pattern that typically forms after an uptrend and signals a potential shift to a downtrend.
It consists of three peaks:
* The left shoulder, where the price rises and then falls.
* The head, which is a higher peak followed by another decline.
* The right shoulder, a lower high that is roughly equal in height to the left shoulder.
How to trade it:
Before entering a trade, wait for the price to break below the neckline with strong volume, as this confirms the pattern and signals a potential downside move, After the breakout, it’s important to wait for a retest of the neckline to look for an entry. Traders typically place a stop-loss just above the right shoulder to manage risk
Rising wedge
A rising wedge is a bearish chart pattern that often signals a potential reversal or continuation of an downtrend, depending on where it forms in a price trend.
It appears when the price is moving higher but within a narrowing range, creating two upward-sloping, converging trendlines. Both the highs and lows are rising, but the highs are increasing at a faster rate than the lows. This suggests that buying pressure is weakening over time, and the market may be preparing for a downturn.
How to trade it:
Wait for the rising wedge to break below the upsloping trendline and for the price to reclaim the most recent high low. A breakout alone isn’t always reliable, sometimes the price moves briefly below the trendline without making a lower low, resulting in a fake-out. To confirm the move, wait for a clear lower low and then look to enter on the retracement that follows.
-------------------------------
Bullish continuation patterns
Bullflag
A bull flag is a continuation pattern that signals the potential for a price to continue moving upward after a brief consolidation or pullback.
It forms when the price experiences a strong upward move (the flagpole), followed by a period of consolidation or a slight downward movement (the flag). The flag typically slopes downward or moves sideways, and the consolidation phase usually occurs within two parallel trendlines, creating a rectangle or slight downward channel.
How to trade it?
Before entering a position, wait for the price to break above the downsloping trendline and establish a higher high. If the price doesn’t make a higher high, it could be a fake-out. Once a higher high is confirmed, look for an entry on the retracement. The target is typically the length of the flagpole projected upward from the breakout point.
Bullish pennant
A bullish pennant is a continuation pattern that indicates the potential for a price to continue its upward trend after a brief consolidation. It forms when a strong upward move (the flagpole) is followed by a period of consolidation, where the price moves within converging trendlines, creating a small symmetrical triangle or pennant shape. The consolidation typically shows lower highs and higher lows, and the pattern suggests that the market is taking a "breather" before continuing its upward momentum.
How to trade it?
Before entering a position, wait for the price to break above the downsloping trendline and establish a higher high. If the price doesn’t make a higher high, it could be a fake-out. Once a higher high is confirmed, look for an entry on the retracement. The target is typically the length of the flagpole projected upward form the breakout point.
Ascending triangle
An ascending triangle is a bullish continuation pattern that typically forms during an uptrend, signaling that the price is likely to continue moving higher.
It is characterized by a horizontal resistance line at the top, formed by a series of peaks at roughly the same price level, and an ascending support line at the bottom, formed by higher lows. This creates a triangle shape, where the price is gradually compressing between the horizontal resistance and the rising support.
How to trade it?
Before entering a position, wait for the price to break above the horizontal resistance level with strong volume. Once the breakout occurs, look for an entry on the retracement back to this area.
-------------------------------
Bearish continuation patterns
Bearflag
A bear flag is a bearish continuation pattern that suggests the price is likely to continue moving downward after a brief consolidation or upward pullback.
It forms when there is a strong downward move (the flagpole), followed by a period of consolidation or slight upward movement (the flag). The flag typically slopes upward or moves sideways, and the consolidation occurs within two parallel trendlines, creating a rectangular or upward-sloping channel. This pattern shows that, despite the short-term pullback, the overall downtrend remains intact.
How to trade it?
Before entering a position, wait for the price to break below the upsloping trendline and establish a lower low. If the price doesn’t make a lower low, it could be a fake-out. Once a lower low is confirmed, look for an entry on the retracement. The target is typically the length of the flagpole projected downward for the breakout point.
Bearish pennant
A bearish pennant is a bearish continuation pattern that signals a potential continuation of a downtrend after a brief consolidation.
It forms when there is a strong downward move (the flagpole), followed by a period of consolidation where the price moves within converging trendlines, creating a small symmetrical triangle or pennant shape. The consolidation typically shows lower highs and higher lows, indicating that the price is taking a pause before continuing its downward movement.
How to trade it?
Before entering a position, wait for the price to break below the upsloping trendline and establish a lower low. If the price doesn’t make a lower low, it could be a fake-out. Once a lower low is confirmed, look for an entry on the retracement. The target is typically the length of the flagpole projected downward for the breakout point.
Descending triangle
A descending triangle is a bearish continuation pattern that typically forms during a downtrend, indicating that the price is likely to continue moving lower after a period of consolidation.
The pattern is characterized by a horizontal support line at the bottom, formed by a series of lows at approximately the same price level, and a descending resistance line at the top, formed by a series of lower highs. The price contracts between these two trendlines, creating a triangle shape with a downward-sloping upper boundary and a flat lower boundary.
How to trade it?
Before entering a position, wait for the price to break below the horizontal support level with strong volume. Once the breakout occurs, look for an entry on the retracement back to this area.
-------------------------------
Thanks for your support.
- Make sure to follow me so you don't miss out on the next analysis!
- Drop a like and leave a comment!
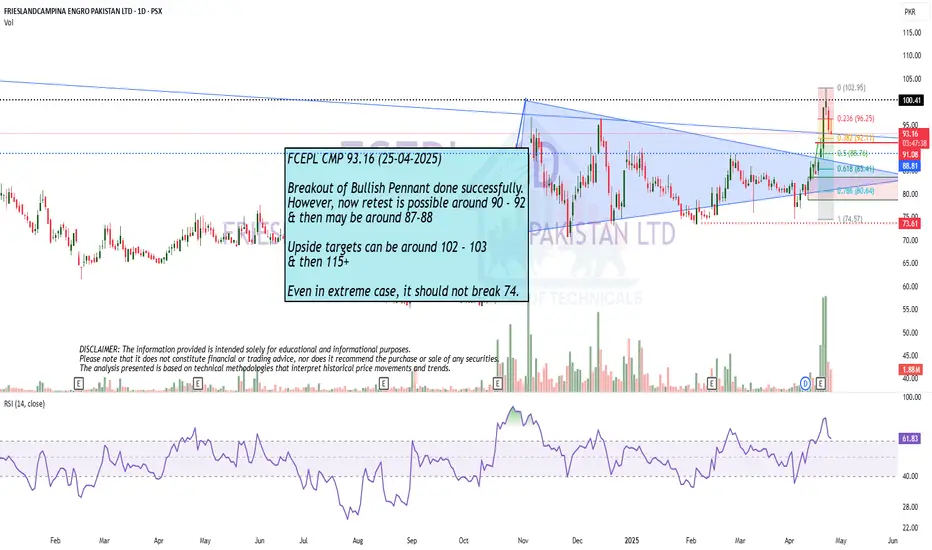
Flag

Telusdt Buy opportunitySpotted a potential ascending formation with price currently developing a mini bullish flag. This structure suggests an underlying accumulation phase ahead of a potential breakout.
The strategic focus is the Buy Back Zone, a key area for strong accumulation entries. Targets are clearly mapped on the chart, with 0.009896 as the first short-term objective, followed by 0.061317.
The final critical area to monitor is the Crucial Resistance Zone, acting as the neckline of the entire setup—its breakout will confirm a long-term structural shift. Watching closely for sustained momentum.

Gold Technical Update (4H Time Frame) / Gold BullishAs we mentioned last week, gold was consolidating on the 4H time frame. After the breakout, all our projected targets were successfully achieved as of yesterday.
Currently, gold is forming a bullish flag pattern on the 4H chart — a continuation pattern that often signals the potential for further upside.
If gold sustains above the 3275–3280 zone, we may see renewed bullish momentum with the following potential targets:
Target 1: 3300
Target 2: 3340
Target 3: 3360
Target 4: 3400
⚠️ This is a technical analysis-based outlook. Traders are advised to manage their positions with proper risk-reward strategies and stay updated with market developments.

NFP market, looking for opportunities to short goldFundamentals:
Mainly focus on today's NFP market;
Technical aspects:
Gold rebounded near 3200 and has gradually rebounded to around 3265. This wave of rebound is not surprising. After all, I have been insisting on short-term long gold since yesterday, and I have also gained a good profit. As gold falls and breaks through many key supports, my expectations for the magnitude of this rebound are not high. In the short term, it will first face resistance in the 3270-3275 area, and secondly, it will face resistance in the 3285-3295 area.
Moreover, the rebound and rise of gold before the NFP market is very confusing in itself. It is not ruled out that it is to pave the way for the sharp drop in the NFP market. Once gold falls again, it is likely to fall below 3200 and continue to around 3180.
Trading strategy:
1. Consider shorting gold when it rebounds to 3270-3280, TP: 3240-3230;
2. Consider continuing to short gold when it rebounds to 3280-3290, TP is the same as above.

ETHUSD – Breaker Block Rejection in Play?Ethereum has been consolidating in a rising channel after failing to break below the 1754 support zone for weeks. Yesterday, price tapped into the 1854 resistance — which also aligns with a bearish breaker block — but failed to close above, showing two strong rejections so far.
Current Observation:
The 1854 level is holding up as resistance, and the most recent candles show weakness at that zone. If price fails to break and close above it, we could see a move back down toward the 1687–1694 support area.
What I'm Watching:
– A confirmed close below the breaker block zone around 1854 could trigger a short setup, with 1754 as the first target.
– If 1754 breaks, I’ll be eyeing the next zone between 1686.8 and 1694.1 for a potential take-profit zone or reaction.
Key Levels:
– Resistance: 1854 → 1881
– Support: 1754 → 1694 → 1687
If 1854 continues to reject price, I’ll be looking to go short on confirmation, targeting a drop back into the lower support zones.
But if we get a strong close above 1854, I’ll reassess for possible upside continuation.
Let’s see how it reacts.
Trade safe.
pClem Trades

ENJ Spike 63% Gearing For 300% Surge Amidst Bullish Flag PatternThe price of Enjin coin ( NYSE:ENJ ) broke out of a bullish flag pattern surging 63% for the past 24 hours. With growing momentum, the asset is gearing for a 300% breakout.
One key factor contributing to the surge is the launch of the Enjin NFT SDK, which enables seamless integration of non-fungible tokens (NFTs) into various platforms, paving way for NFT's on the ENJ ecosystem.
As of the time of writing, NYSE:ENJ is up 19% setting the course for a 300% breakout. The asset has formed a perfect bullish flag pattern with the ceiling of the pattern already broken, NYSE:ENJ will be aiming for the $0.32 resistant and beyond.
With growing momentum as hinted by the RSI at 71.89, NYSE:ENJ might just be the asset to look out for this week.
What is Enjin ( NYSE:ENJ )
Enjin is a blockchain platform that makes it easy for developers to integrate NFTs and digital assets into their games and apps.
The platform provides tools for creating wallets, minting tokens, and managing transactions without requiring users to understand complex blockchain technology.

Godrej AgroForming an Pole & Flag Pattern
Trading in an Consolidation Pattern.
Target1 800
Target2 880
Target3 1000

GBPJPY 4h Long Setup Clear bullish structure with clean higher highs and higher lows intact
Price formed a bull flag after a strong impulse leg showing continuation potential
Breakout of the flag confirms momentum with aggressive bullish candle and volume
Entry : 192.459
SL : 188.167
TP : Trail 195.898
RR 1 : 3.1
Market is flowing with bullish pressure and breakout indicates wave extension
No counter structure in sight, trend continuation expected
Let the market breathe and move

BHARTIHEXA : Short Term Trade (1-3 months)#bhartihexa #chartpattern #flagbreakout #rangebreakout #breakoutstock
Bharti Hexacom : short term trade
Duration (1-3 months)
>> Flag structure in monthly
>> Range consolidation Breakout
>> Breakout + retest done
>> Good strength in stock
>> Potential upside upto 50%
U can consider entering at cmp and keep building positions in retracement or pullbacks.
Disc : Charts shared are for Study purpose only, not a Trade recommendations

Bitcoin Dominance Update (4H)It appears that Bitcoin Dominance is preparing for one final upward move.
I believe this could be the last dominance rally before a major bullish breakout across the broader market.
For a more detailed perspective, please refer to my previous analyses on Bitcoin Dominance and the "Others" market cap.
— Thanks for reading.

BTC BULLPOSTPure bullposting - could go either way but if we break the bull pennant then 1.618 fib is MOON

$TOTAL Crypto Market Cap BULL TRAP AlertBULL TRAP 🚨
New money has been coming into the market as shown on the Crypto CRYPTOCAP:TOTAL Market Cap, hence why you haven’t seen “rotations” in coins, but it appears to be drying up.
There’s been major resistance at the 200DMA, which is just below the previous ATH at $3T, and PA is being squeezed between the 9DMA.
Combine this with a heated RSI, it appears to be a bear flag in the making.
The trendline from Oct. ’23 gives confluence with the 50DMA as support.
*The only savior I see at this point is price smashing through the 200DMA and flipping support into the green accumulation box.
Regardless, this move is coming to an end later this week to test support or breakout.
Again, I’ll reconfirm my stance that this is the most obvious bull trap I’ve seen all cycle. Although I hope to be wrong 🥲
Having said that, after support is confirmed on the move, we are going to VALHALLA 🚀
Bookmark this 🤓


S (EX FTM) Update (4H)Like many other altcoins, S has formed an Inverse Head and Shoulders pattern, signaling a potential trend reversal.
Additionally, a bullish flag formation has broken out on the lower timeframes, further confirming the upward momentum.
The current price structure appears suitable for long positions, especially with confluence from multiple technical signals.
A conservative target lies around the $0.64 level, based on the measured move projections from the flag and neckline breakouts.
— Thanks for reading.

Is XAUUSD bullish or bearish today? I'm bearish on GOLD (XAUUSD) today!
Logic: GOLD recently hit its historic high. After that retracing but not sustaining at any point just because of the big players booking profits, it's common in GOLD .
Now, GOLD is reversing, and I can see it formed a bearish flag pattern today in the 15- or 5-minute time frame, as you can see in my chart drawing. So, I'm bearish at least till the 3270 level .
Thank you

Thorchain (RUNE) about to go 1100%?Dearest reader,
Welcome back for yet another great analysis, there is alot to unpack on the chart above so lets dive right in. Thorchain has seen a brutal crash/retrace of a whopping 87% since december regarding their financial situation around the thorfi hack. There is always something right? Ignore the FUD and look at the chart, it's screaming ''buy buy buy!''
Lets go through the chart from left to right.
1. Lower support line, has seen 5 confirmations so far, dating back all the way to 2020 (Small 1's)
2. Bullflag. Has seen 6 confirmations of this channel (green circles) and had a breakout in november 2023
3. Retest of BOTH 1 and 2, the upper line of the bullflag and also the support line since 2020
4. Stochastic RSI is oversold, sellers are exhausted, makes sense! it has seen a 87% drop allready. MFI has seen the lowest point in the history of this token (17) and has been moving back up. Note: Stochastic RSI is a lagging indicator and MFI is forward looking. Both look bullish
If the pattern from 2020 would repeat that could mean that by august this year we will see a price of 11 dollars yet again, that's a whopping 1100% from this point.
Target: 11/12$
Entry: 1$
Stoploss: 0.75$ (There is some support here, so even when this area is hit it might still bounce up.
~Rustle

Compound 200% very soonHello dear readers!
Another quick one for you. Compound has been around for a while and has seen a massive retrace of around 73%.
There are now reasons to be bullish for the short term.
When we look at the charts we can see a bullflag breakout (fierce) and retest of the upper bound. Its on a hard support also. Any sellers have dried out, and the only way is up.
Target minimum: 132
Stoploss: you can pick
~Rustle

Total 3, do flags point to the target area?Welcome back dearest reader,
Today i have a very interesting analysis for you, quite some valuable time was put into this.
What i've noticed is the following:
-From april 2021 untill july 2021 total 3 has been trading in a bullish wedge flag, when we continue the lines on the full candle bodies the apex pointed to the top of that flag durationwise
-August 2022 till october 2023, extend the trendlines, apex march 2024, look up. Oh.
-March 2024, october 2024 --> apex december 2024, look up. Oh.
Now:
-January 2025, april/may 2025, apex june 2025, look up. Oh.
-I used the fractal from july 2021 as i think we're in this period
-Upward sloping channel from october 2022 untill now could provide insights as to what the target price might be, HH and HL
Target: 1.5T
Also check out my BTC.D idea, these would coincide perfectly
~Rustle
Is it certain this will happen? No-one has a glass ball, all we have are patterns based on past performance, this is no guarantee. But it does look good.

TLM Bearish Flag Formation – Short Opportunity Ahead?#TLM is currently forming a Bearish Flag pattern on the 4H timeframe – a classic continuation setup indicating potential downside.
🔍 Key Observations:
Price is consolidating within the golden zone of the Fibonacci retracement.
We're closely watching for confirmation signals before entering a short position.
📉 Bearish Confirmation Triggers:
Bearish Divergence on RSI
Break of Support Level (flag support line)
Break & Retest of the 0.5 Fib level
⚠️ The more confirmations we get, the stronger the case for a bearish move. Patience is key – wait for the setup to mature and always use proper risk management. 🛡️
📌 Plan: Enter short after confirmation of at least one major bearish sign. Look for confluence to increase trade reliability.
💬 Let me know what you think! Are you shorting #TLM? Drop your analysis or charts below 👇
#TLM #CryptoAnalysis #BearishFlag #TechnicalAnalysis #ShortTrade #4HChart #Fibonacci #TradingView

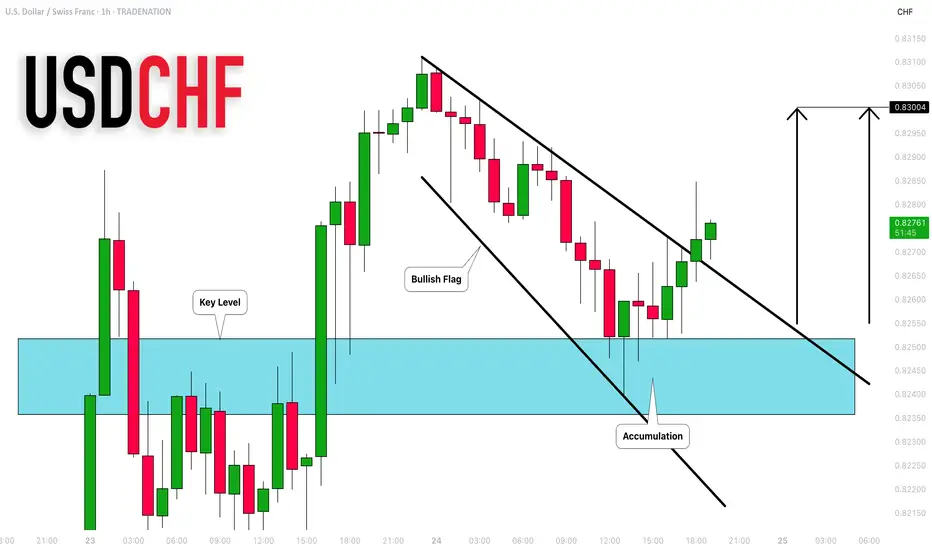
USDCHF: Very Bullish Price Action 🇺🇸🇨🇭
There is a high chance that USDCHF will go up from
the underlined blue support.
As a confirmation, I see a bullish breakout of a resistance line
of a bullish flag pattern on an hourly time frame.
Target - 0.83
❤️Please, support my work with like, thank you!❤️
I am part of Trade Nation's Influencer program and receive a monthly fee for using their TradingView charts in my analysis.
Technical Breakdown on US100 Cash CFD | 1H Timeframe1. Key Observations (Volume, Gann & CVD + ADX Focused)
a) Volume Profile Insights:
Value Area High (VAH): 18,758.52
Value Area Low (VAL): Approx. 18,259.03
Point of Control (POC):
Recent Session POC: 18,758.52
Previous Session POC: 18,259.03
High-volume nodes: Clustered around 18,600–18,750 – area of high interest and possible re-accumulation.
Low-volume gaps: Below 18,300 – could act as fast-move zones on breakdown.
b) Liquidity Zones:
Stop Clusters:
Above 18,800 (recent swing high).
Below 18,250 (previous swing low).
Absorption Zones (Delta Volume Focus):
Strong absorption around 18,580–18,600; price has consolidated here indicating order filling.
c) Volume-Based Swing Highs/Lows:
High-volume swing low: 18,259.03 (POC) – strong buying response seen post drop.
High-volume swing high: 18,758.52 – rejection seen here on low follow-through.
d) CVD + ADX Indicator Analysis:
Trend Direction: Currently Range-bound (CVD not showing clear accumulation/distribution trend).
ADX Strength:
ADX ≈ 18–20: Suggests weakening trend; possible sideways movement.
DI+ ≈ DI-: Confirms indecision.
CVD Confirmation:
CVD flattening at resistance suggests equal pressure from buyers and sellers.
No strong rising or falling trend in CVD; supports ranging bias.
2. Support & Resistance Levels
a) Volume-Based Levels:
Support:
VAL: 18,259.03
Previous swing low/absorption: 18,300
Resistance:
VAH: 18,758.52
Rejection level: 18,800
b) Gann-Based Levels:
Confirmed Gann Lows: 18,259
Key Retracement Levels:
1/3 retrace from recent high: ~18,430
1/2 retrace: ~18,500
2/3 retrace: ~18,580
3. Chart Patterns & Market Structure
a) Trend:
Range-bound (confirmed by ADX near 20 and mixed CVD).
b) Notable Patterns:
Bearish rejection at VAH zone.
Potential descending channel forming from highs.
Fake-out above 18,750 followed by rejection – possible liquidity grab.
4. Trade Setup & Risk Management
a) Bullish Entry (If CVD + ADX confirm uptrend):
Entry Zone: Near 18,300–18,350 (absorption + VAL zone)
Targets:
T1: 18,580
T2: 18,750
Stop-Loss: Below 18,250
RR: Minimum 1:2
b) Bearish Entry (If CVD + ADX confirm downtrend):
Entry Zone: Near 18,750–18,800 (rejection area)
Target:
T1: 18,300
Stop-Loss: Above 18,850
RR: Minimum 1:2
c) Position Sizing:
Risk 1–2% of total capital per trade for optimal drawdown management.

$DXY bullish from 96-98, massive bull flagDespite everyone calling for the death of the dollar, I think the dollar is in the process of bottoming and then will head higher.
Macron called for the Euro to replace the dollar (which is laughable) and likely marks a bottom.
Either we bounce here, or I could see the possibility of one more spike low down to the ~96 support level, but should we see a reaction there, it sets up a massive move higher in the dollar.
As you can see on the chart, we've been correcting inside of a bull flag, if we can form a low around $96-98, we will reverse and head higher to break the flag to the upside. Upside targets on the chart.
I think the bull market in the dollar is just starting, don't let the news scare you out of accumulating dollars over other fiat currencies.
