SNX/USDT Short-Term Trade | Entry at 0.627 with Clear TargetsMidterm/Intra-day Setup
This is an intra-day (midterm) trading setup.
Entry Price: 0.627
Take Profits (TPs): Refer to the marked levels on the screen for target points.
Stay disciplined and manage your risk accordingly.
Fractal

BTC FRACTAL : Has BTC been following THIS EXACT PATTERN?The only difference in terms of the first peak, is the duration. But even the pullback size has been similar:
Interestingly, in terms of the second peak, the increase from the corrective bottom to the new ATH is almost exact at 122%:
Here's why we MAY still have a small push upward:
- The previous time, the peak was at least 6% higher. Currently, that would put us around 116K.
- The current pennant pattern is different from the previous bearish flag.
2%:
Pattern:
Do you think the bearish cycle is starting, or is another push up likely?
___________________
BINANCE:BTCUSD

Bitcoin: Fib Interference PatternNeeded 3h timeframe version of the Fibonacci interference pattern to better capture and document short-term market behavior around key intersection zones.
Measurements

moodeng buy setup scalp & swingIf btc stays sideways till fri-sat it can hit swing tp, also during eid days I won't recommend you to take any trade due to dry volume, less volatility. It's a meme token so use tight sl and don't use high margin on this trade. Good Luck.

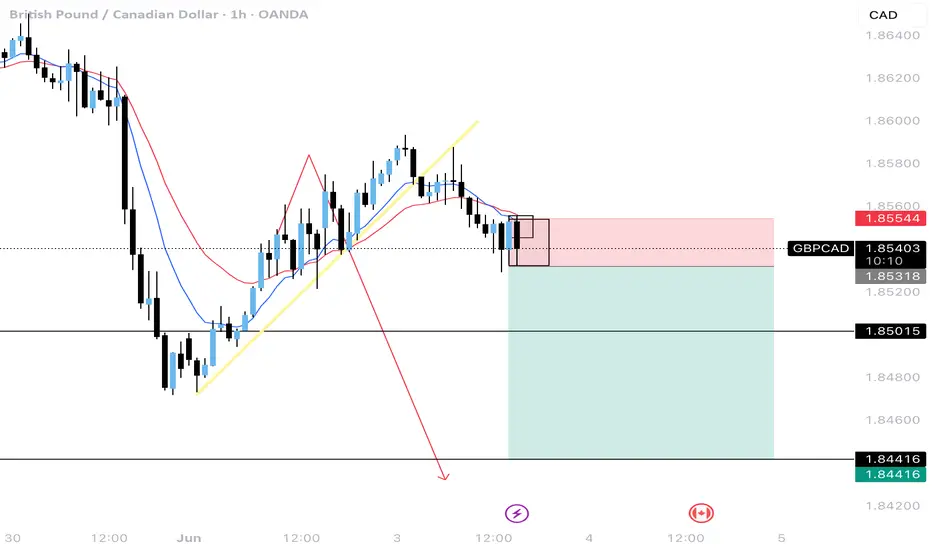
GBPCAD SELL OPPORTUNITY 5 MIN TIMEFRAMEClear trend breakout and retest has occured. Targetting for it to hit the large imbalance on the left before going down which it did. Targetting imbalances on 5 min tf. the 30 min and 4 hr 10 and 20 EMA on downtrend too
HUGE INCREASES Possible on PYT | Here's WhyPython is a fairly new altcoin with big upside.
From the earlier two charts on the left, we see that initial downturns shouldn't be feared. Historically, SOL and SUI started with downtrends and transitioned into massive upside alts.
Python might especially see parabolic increases, once ETH starts to move towards a new ATH. This will be due to the rotation of liquidity between altcoins in terms of larger and smaller market caps.
Don't miss yesterdays update on ETH!
____________________________
BINANCE:SOLUSDT
COINBASE:SUIUSD
BINANCE:PYTHUSDT

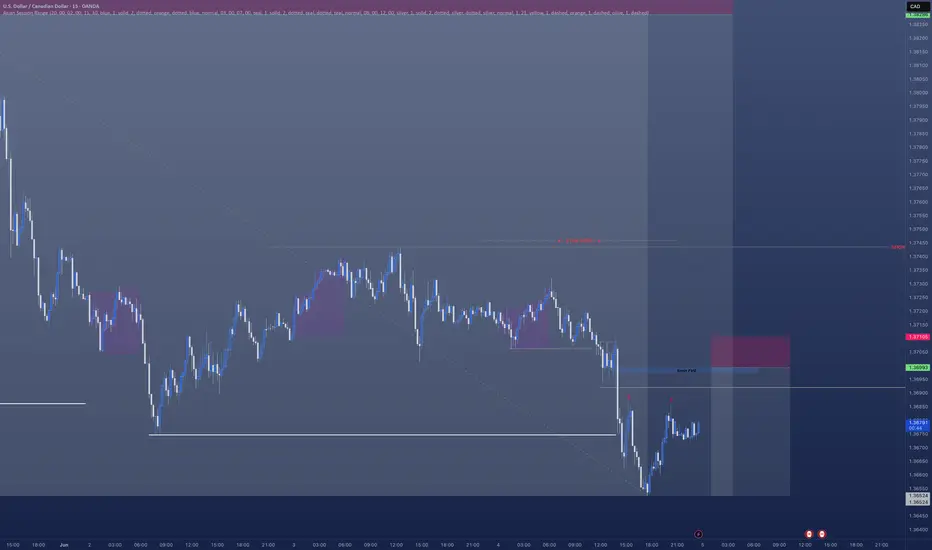
USDCAD - Short ContinuationHave a really nice short currently open on USDCAD
However I am looking to get a further position opened which come in the morning.
There's a clear break of structure.
- A nice FVG left behind.
- We are creating liquidity / inducement
- All pointing towards a nice further sell off in the morning.
Ideal situation is we sweep Asian session highs in the morning in the hope we move lower
THE FLEX SETUP (EURGBP)Good day traders, I'm back with another setup and it’s only an update that I believe can really provide insight into what to expect from price in the upcoming weeks.
Like I always say that I always want to see price take out a previous week high/low as I use that as a confirmation in term of the power of 3 that I use to try and avoid manipulation, but this doesn't mean I don't get on the wrong side of price moves. Looking at the HTF's overall structure we can see that we in a very bullish structure but... There's a bearish flow in price!! On the weekly TF price left a large FVG(BISI), showing how strong the bullish structure is and now that price is trading on top of this BISI I'm mentioning. If we go one TF lower to the daily TF than on the daily the weekly BISI is a balanced price range and normally how I look at Gaps after been balanced, I treat them like classic support/resistance, but they have to confluence with another PD array first than for me the rules of 'support/resistance' come into play. If you look close into the daily TF, we have relative equal highs inside the volume imbalance created on the 12th of May.
Let's look at how price delivered since opening with a gap lower on the 12th, on that same day price repriced that gap but did not close above it. Why do we want it to close above it? Well ICT teaches more on volume imbalances and the rules or pros and cons. If price closes above the volume imbalance than it becomes balanced once price retests the closure above/below obviously depending on the gap opening. On the 4HTF we saw price shift structure higher and the first thing I see is the candle that had a broken lower high because it also became our breaker. And a FVG inside it making that zone stronger again we can use all the PD arrays together.


Bitcoin Top SimilaritiesDescription for TradingView Chart:
“Overlay of Bitcoin’s 2020–2021 bull run (in green) onto current price action to highlight potential fractal similarities. Used for cycle comparison and pattern recognition in anticipating future moves.”

Bitcoin: Underlying Fib HeatmapReceived a request to add .886 to upward channels and remove a b&w fib layer which concealed another pair of fib channels that also extends from 2020 and makes up spectrum of colors from a research idea.
Result:
Sharing this publicly as it may be of interest to others in the field, and to leverage the interactive features for enhanced tracking and ongoing refinement of the model.

Can JTO pull a BNB All-Time-High Move??BNB made a similar pattern that led to it's previous ATH.
Since we are still waiting on the new ETH a time highs, followed by altseason, we can expect to see altcoins beginning to increase when ETH trades sideways. More on that here :
We can also expect to see rallies across other altcoins:
and
But before we see a glorious altseason, ETH needs to start moving to the upside as a starting point.
_______________
BINANCE:JTOUSDT
BINANCE:BNBUSDT

Fib Channel Extending From 2020 To PresentThe Fractal Wave Marker is used in this analysis. It gives a multi-scale perspective of swing highs and lows - how the market moves across different time intervals.
Nested cycles (fractured pattern) reveals important order in phase transitions from small pullbacks to major trends. Basically making it easier to look for systematic patterns.
For example, with this tool we can easier spot a commonality like the identifying consistent angle that connects consecutive tops as well as bottoms by parallel lines that gives an idea of general direction.
If we were to use that channel as a topological expression to examine to what extent the fact of price happening there influenced probability density and what it changed in future price behavior , we would literally integrate it with broader scale fibonacci structures like: adding more ratios after 1 (not just 0 - 1) to illustrated chart above.
The implemented version would look something like this:
Chart-based curve aligning with angle of the channel - validating measurements in use.
Documenting the structural buildup for research purposes.

$BTC 12-Week Lead Correlation w/ Global Liquidity, M2, GOLD, DXYHere’s a look at Bitcoin's price action against Global Liquidity, Global M2, GOLD and DXY - all with a 12-Week Lead.
Notice GOLD has a bit more of a deviation from the BTC price than the others.
This is because GOLD is used as a store of value asset, whereas the others are predicated on Central Banks expanding and contracting their money supply and balance sheets.
The key here is to smooth out the signal and ignore the noise.
Notice the convergence between these metrics the past couple months.

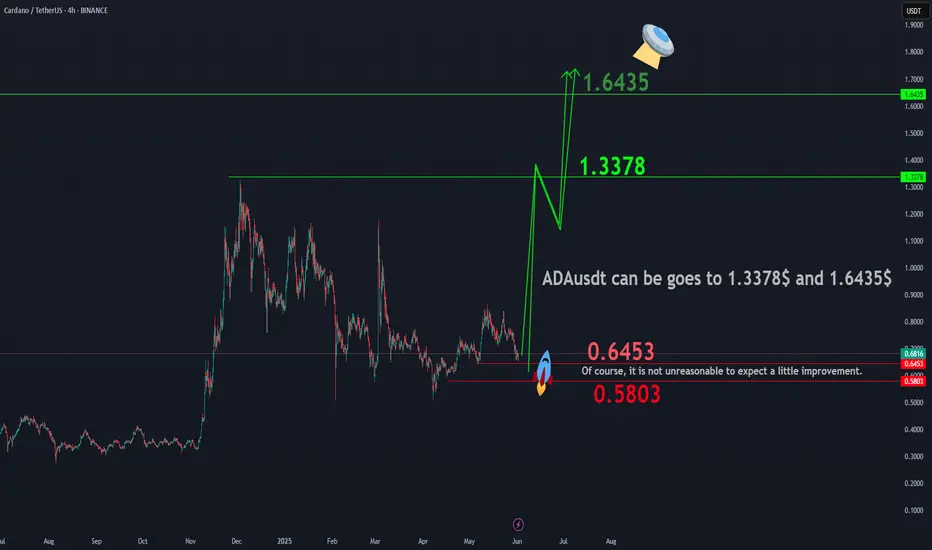
ADAUSDTBINANCE:ADAUSDT shows potential for an upward movement towards the targets of $1.3378 and $1.6435, making the current price zone attractive for long-term investment . While a correction towards $0.6453 or even $0.5803 is possible, these levels present favorable buying opportunities for investors with a long-term perspective. Even if a deeper correction occurs, the market geometry suggests that reaching the aforementioned targets is a likely outcome.
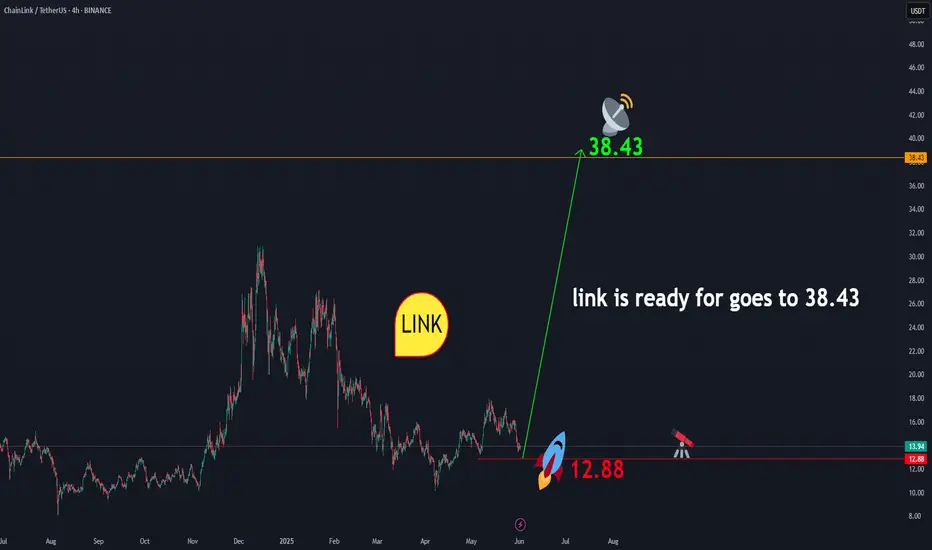
linkusdtLINK is showing readiness to initiate an upward movement towards $38.43. From the current price range of $13.93, a correction down to the $12 area is possible. This zone presents a favorable opportunity for long-term investment . In any case, according to the geometry that has formed in LINK, the price level of $38.43 is expected to be achieved. And this is certain.
BINANCE:LINKUSDT
Final BTCUSD update..Good day traders, here is my final update on BTCUSD and I like how price has been respecting our PD arrays. Keep in mind traders price moving in waves and what again😂😂🏃🏾♂️, point is today is the last trading day for the week and my thoughts is that we can expect BTCUSD to start going higher today and tomorrow maybe till Tuesday …sorry I’m being too sure but if you focus on time and price you start to KNOW(ledge) things or maybe I should say secrets?!🤨🤔
I always expect price to manipulate higher if my bias is shorts, ICT’s power of 3 works wonders when it come to this thought process.
Watch how price reacts to the FVG where price is trading now, it’s not a signal just watch out price moves always from it for the rest of today.
We only going high to shoot lower…keep that in mind!!🤯

BTC Correction - 50%After completing the impulse and falling out of the channel, Bitcoin most likely went into a correction

BTCUSDTBitcoin may be looking to complete the downward correction from the $101,000 price range to $99,000 and then begin a long-term upward trend. Pay close attention to the extent of the correction and don't give in to fear or greed.
In any case, it should go to $1300,000.
BINANCE:BTCUSDT

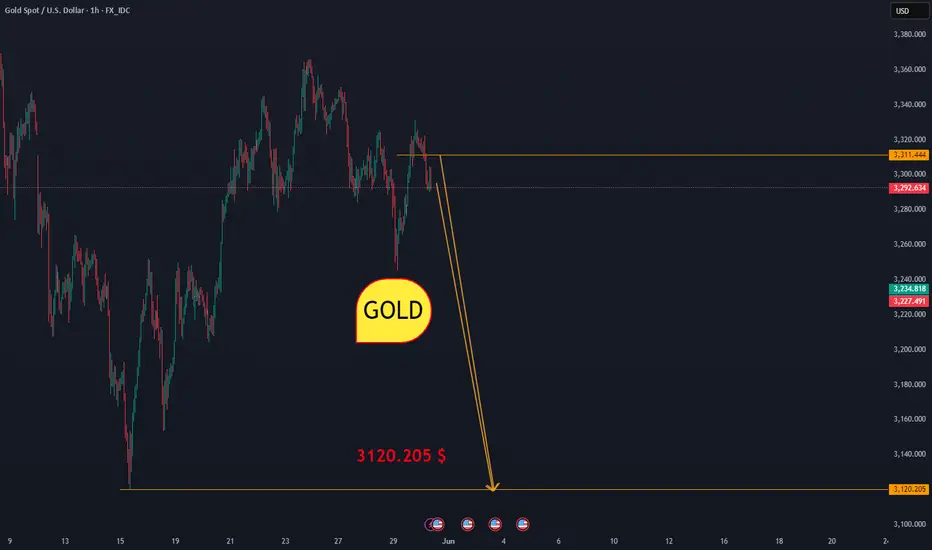
GOLDThe possibility of a fall to 3120.20 is smooth and the situation will only become critical when the price crosses above 3325. This fall may have traps.
CMCMARKETS:GOLD
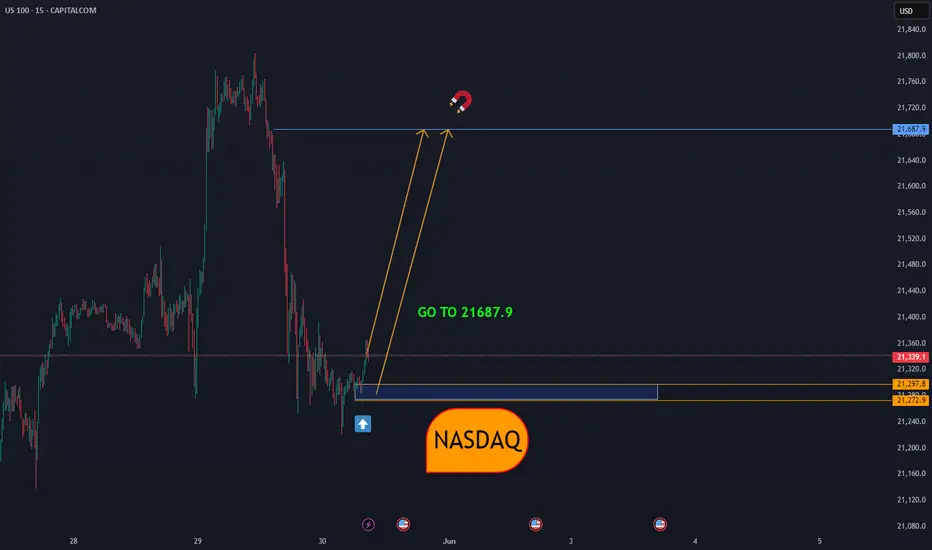
NASDAQGiven the geometry that has been created, there is a possibility of a correction towards the price of 21687.9, either from the current price or from a little lower, if the bottom of 21219 is broken, another decision must be made.
NASDAQ:NDX
$TOTAL Crypto Market Cap BREAKDOWN You don't want me to draw the squigglets that come after if it plays out like this 🥸


Ethereum Analysis (1D)
🔍 Top Consolidation
ETH is struggling to break and hold above the $2,780-2,810 resistance
Tight range for days, indicating accumulation without clear direction
🎭 Potential Bull Trap
“AMD-style” scenario: a false breakout today followed by a sharp rejection
Upward manipulation to hunt long stops
📉 Retracement Phase
After the rejection, expect ETH to retrace the recent bullish impulse
Technical target : test the 50% Fibonacci level (~$2,350) or the OTE zone around $2,300–2,250
🚀 Mega Breakout Incoming
Once manipulation and retracement phases complete, look for a massive bullish breakout
Next upside target: reclaim highs above $3,000+
👉 Watch For :
False break above $2,810
Confirmation of 50% retracement to validate renewed bullish momentum
Volume and price action in the $2,300-2,250 zone
💡 Summary : accumulation → bull trap → healthy retracement → launch into a new bullish leg.
