Sell AUD/CAD @ Bearish FlagThe AUD/CAD pair on the M30 timeframe presents a potential selling opportunity due to a recent downward breakout from a well-defined Bearish Flag pattern. This suggests a shift in momentum towards the downside in the coming Hours.
Key Points:
Sell Entry: Consider entering a short position around the current price of 0.9140, positioned close to the breakout level. This offers an entry point near the perceived shift in momentum.
Target Levels:
1st Support – 0.9093
2nd Support – 0.9058
Your likes and comments are incredibly motivating and will encourage me to share more analysis with you.
Best Regards, KABHI FOREX TRADING
Thank you.
Fundamental-analysis

Fundamental Market Analysis for November 12, 2024 USDJPYThe Japanese Yen (JPY) managed to strengthen slightly against its US counterpart in Tuesday's Asian session, but looks like it could weaken further. Japan's fragile minority government is expected to make it difficult for the Bank of Japan (BoJ) to tighten monetary policy. Moreover, the BoJ's summary of opinions from its October meeting showed that policymakers were divided on whether to raise interest rates again. This, along with fears of President-elect Donald Trump's tariffs returning, is putting pressure on the Japanese yen.
Trump's policies and corporate tax cuts should put upward pressure on inflation, which could limit the Federal Reserve's (Fed) ability to ease policy. This, in turn, supports rising US Treasury yields and confirms a negative outlook for the low-yielding JPY in the near term. The US Dollar (USD), on the other hand, maintains the positive trend that followed Trump's victory in the US presidential election and suggests that the path of least resistance for the USD/JPY pair remains to the upside.
Trading recommendation: Trade predominantly with Buy orders from the current price level.

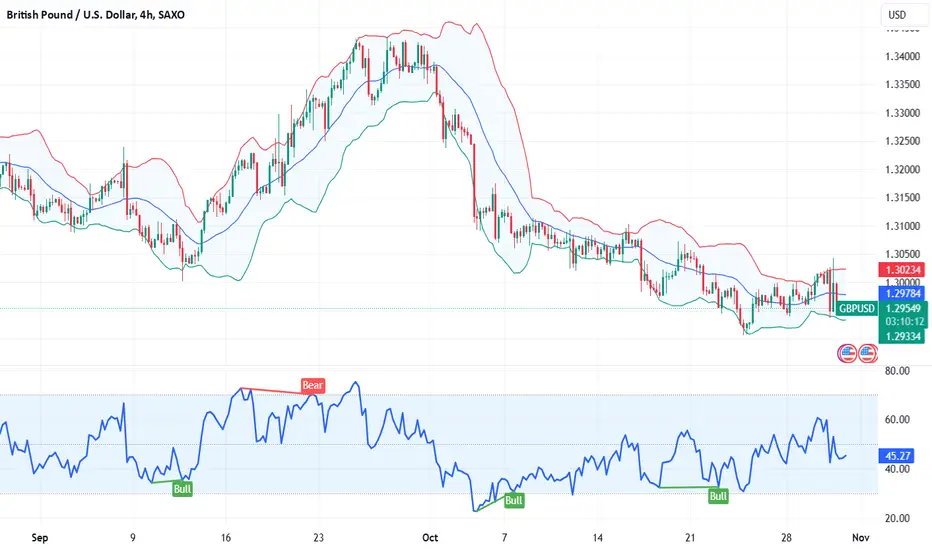
Fundamental Market Analysis for November 11, 2024 GBPUSDThe GBP/USD pair starts the new week on a softer note, although it fails to find continued selling and remains range-bound around the 1.29000 mark amid mixed fundamentals. The US Dollar (USD) is holding below the four-month high reached last week amid expectations that US President-elect Donald Trump's policies will spur inflation and limit the Federal Reserve's (Fed) ability to aggressively ease policy. This, in turn, is seen as a key factor acting as a headwind for GBP/USD, although the Bank of England's hawkish stance is helping to limit rate cuts.
In fact, the Bank of England has warned that the expansive Autumn Budget presented by Chancellor Rachel Reeves is expected to spur inflation, suggesting a cautious stance on rate cuts in 2025. In addition, risk-on sentiment is helping to limit the rise of the safe-haven US Dollar and providing some support for the GBP/USD pair, allowing for some caution before making aggressive bearish bets.
Investors also seem reluctant and may prefer to stand back ahead of important macroeconomic releases from the UK and US. This week's economic calendar includes UK employment data on Tuesday, US consumer inflation data and the Producer Price Index (PPI) on Wednesday and Thursday respectively, followed by preliminary UK Q3 GDP and US retail sales on Friday.
Trading recommendation: Watch the level of 1.29000, if the level is fixed below consider Sell positions, if the level bounces back consider Buy positions.

Bitcoin hits new all-time high amid U.S. elections!Yesterday, November 6, 2024, the U.S. presidential election results were announced, and the race was won by Donald Trump, a strong advocate for cryptocurrency! During his campaign, on September 18, 2024, the current U.S. leader made a bold move toward the digital asset community by treating supporters to burgers at PubKey in New York, paid for in Bitcoin. During the voting and after the results were announced, Bitcoin (BTCUSD) demonstrated a rapid surge.
Starting around $68,000, Bitcoin broke past $76,000, hitting a historical peak and posting an impressive 12% gain within just 24 hours!
In addition to the support from the leader of one of the world’s top nations, cryptocurrency has plenty more cards up its sleeve. Key growth factors and expert insights:
Institutional investor interest: Major corporations and institutional investors continue to increase their Bitcoin investments, supporting high demand and limited supply in the market. For example, well-known company MicroStrategy (#MSTR) acquired 5,445 BTC for $150 million from August through late September!
Rising demand amid economic uncertainty: With inflation on the rise, geopolitical instability, and volatility in traditional markets, investors are seeking more stable assets. Bitcoin, alongside gold (XAUUSD), is becoming a preferred choice for capital preservation.
Expectations of U.S. Fed policy easing: With potential interest rate cuts on the horizon, interest in cryptocurrencies as alternative assets is increasing. Experts estimate an 87% probability of a rate cut at the next meeting, creating additional incentives for investing in BTC and other crypto assets.
Positive analyst forecasts: The projected minimum Bitcoin price in January 2025 is $71,468, with an average of $78,168 and a maximum of $80,402. By December, these figures are expected to rise to $106,235, $109,213, and $124,937, respectively. Growth is anticipated to remain steady, without declines or corrections, throughout the year.
On September 19, 2024, FreshForex analysts highlighted the undeniable growth drivers for the entire crypto sector. With Trump at the helm of the U.S., crypto growth is practically inevitable! Don’t miss your chance!

Buy GBP/JPY Triangle BreakoutThe GBP/JPY pair on the M30 timeframe presents a Potential Buying Opportunity due to a recent breakout from a Triangle Pattern. This suggests a shift in momentum towards the upside and a higher likelihood of further advances in the coming hours.
Possible Long Trade:
Entry: Consider Entering A Long Position Above The Broken Trendline Of The Triangle After Confirmation. Ideally, This Would Be Around 197.44
Target Levels:
1st Resistance – 199.20
2nd Resistance – 200.20
Stop-Loss: To manage risk, place a stop-loss order below Support Zone. This helps limit potential losses if the price falls back unexpectedly.
Your likes and comments are incredibly motivating and will encourage me to share more analysis with you.
Best Regards, KABHI FOREX TRADING
Thank you.

XAUUSDwednesday was great 230 pip to the ground and yesterday was also bos easy to pull down 130 pip 2735 entry to direct 2723 what a trade. well what i see now in the chart clearly i explained to understand even if ppl are new, if not then need education only. im still looking for a short on gold. what you all think let me know in the comment.

How the U.S. Election Could Impact USD and EUR/USD Trading"As the U.S. presidential election approaches, it’s time to consider how it might impact our trading strategies, particularly with the U.S. dollar and EUR/USD. Political shifts bring market volatility, so let’s break down how each outcome could influence the dollar and the EUR/USD pair.
Election Outcomes and Market Impact
1. If Democrats Win: A Democratic victory could weaken the dollar, as policies may lead to lower inflation and reduced real interest rates. This scenario might push the EUR/USD pair higher, with potential targets around 1.1300–1.1850. For traders, this could mean a favorable environment to consider EUR/USD gains.
2. If Republicans Win: On the other hand, a Republican win might initially strengthen the dollar, thanks to expected trade policies and rising interest rates. However, this strength could be short-lived. Long-term factors may introduce volatility, potentially giving the euro a chance to regain ground against the dollar.
Key Levels to Watch in EUR/USD
From a technical standpoint, keep an eye on resistance levels from 1.1275 to 1.1750 for potential bullish moves, while support around 1.1000 and a critical level at 1.0900 could indicate a downturn. Combining these levels with election news can help you make informed trade adjustments.
How to Trade Before, During, and After the Election
Leading up to the election, watch for narrowing polls, as this could introduce uncertainty and increased volatility. During the election itself, expect the market to react strongly—prepare for a Trump win to potentially strengthen the dollar and a Harris victory to have the opposite effe

SBI Cards Stock AnalysisAnalysis of SBI Cards Stock Idea
Current Price: ₹697.40
Technical Overview:
* Double Bottom pattern with breakout.
Target Levels:
* ₹850 (initial)
* ₹1,000 (extended)
* ₹1,100 (ultimate)
* Strong support around ₹650-₹700 from breakout zone.
Fundamentals:
* Leading credit card issuer in India with strong revenue and profit growth.
* Positioned to benefit from growing digital payment adoption in India.
* Key risks include exposure to credit defaults, but SBI backing mitigates risk.
This could be a solid opportunity if the trend holds.
Join Now: buff.ly

SUPPORT AND RESISTANCE OUTLOOKIn this analysis we are focusing on 1H time frame for GOLD. I'm looking potentially buy trade opportunity today, by using support and resistance and price action. And we are using volume and RSI indicator. Let's see what happens and which trade opportunity market will give us. Let's delve deeper into these levels and potential outcomes.
Always use stoploss for your trade.
Always use proper money management and risk to reward ratio.
This is just my analysis or prediction.
#XAUUSD 1H Technical Analysis Expected Move.

Sell EUR/GBP Channel BreakoutThe EUR/GBP pair on the M30 timeframe presents a potential selling opportunity due to a recent downward breakout from a well-defined Bearish Channel pattern. This suggests a shift in momentum towards the downside in the coming Hours.
Key Points:
Sell Entry: Consider entering a short position around the current price of 0.8392, positioned close to the breakout level. This offers an entry point near the perceived shift in momentum.
Target Levels:
1st Support – 0.8340
2nd Support – 0.8305
Stop-Loss: To manage risk, place a stop-loss order above 0.8422. This helps limit potential losses if the price unexpectedly reverses and breaks back upwards.
Your likes and comments are incredibly motivating and will encourage me to share more analysis with you.
Best Regards, KABHI FOREX TRADING
Thank you.

Sell AUD/JPY Bearish ChannelThe AUD/JPY pair on the M30 timeframe presents a potential selling opportunity due to a recent downward breakout from a well-defined Bearish Channel pattern. This suggests a shift in momentum towards the downside in the coming Hours.
Key Points:
Sell Entry: Consider entering a short position around the current price of 100.25, positioned close to the breakout level. This offers an entry point near the perceived shift in momentum.
Target Levels:
1st Support – 99.48
2nd Support – 99.11
Stop-Loss: To manage risk, place a stop-loss order above 100.75. This helps limit potential losses if the price unexpectedly reverses and breaks back upwards.
Your likes and comments are incredibly motivating and will encourage me to share more analysis with you.
Best Regards, KABHI FOREX TRADING
Thank you.

XAUUSDperfect catch on 2757 as accepted i hope everyone is in profit this week, what i see for next week its a clear line on the 4h chart frame also video is out on youtube.
im loooking at continuestion short near 2700 or slightly more down to 2685 around, for a gold market to go more higher.
what are you all think can leave a comment below.

KPGEL Diwali Pick 2024Stock Analysis and Trade Setup
This chart shows the stock breaking out of a long-term downward channel, suggesting a potential trend reversal:
• Bullish Setup : The price has broken above the descending channel, indicating bullish momentum. A strong consolidation above the support level around 631.1 could confirm this breakout. If the price maintains this upward trend, the next resistance at 716.75 would be the primary target, followed by further gains if momentum persists.
• Bearish Scenario : If the price fails to hold above 631.1, there could be a retest of lower levels. Watch for a potential short entry below the key support level at 525.9, as a breakdown could signal a continuation of the downtrend.
The RSI indicates room for further upside, and increasing volume supports the bullish breakout. Monitor these levels closely for entry and exit signals.
Disclaimer: This analysis is for educational purposes only. Please conduct your own research before making any trading decisions.

Fundamental Market Analysis for November 1, 2024 USDJPYThe Japanese yen (JPY) retreated from its recent gains following the release of the manufacturing purchasing managers' index (PMI) from Jibun Bank and S&P Global on Friday. However, the USD/JPY pair declined as the yen strengthened following comments from Bank of Japan (BoJ) Governor Kazuo Ueda on Thursday that increased the likelihood of a rate hike in December.
Jibun Bank's headline PMI for Japan's manufacturing sector came in at 49.2 in October, down from 49.7 in September. This composite single-digit reading indicates that Japan's manufacturing output continued to contract at the start of the fourth quarter of 2024, with the pace of decline in output and new order inflows more pronounced.
Japan's Chief Cabinet Secretary Yoshimasa Hayashi said on Friday that he expects the Bank of Japan to work closely with the government to implement appropriate monetary policy to achieve the price target in a sustainable and stable manner.
Traders await the release of the U.S. non-farm payrolls (NFP) report on Friday. The U.S. economy is expected to add 113,000 jobs in October, while the unemployment rate is expected to remain unchanged at 4.1%.
Trading recommendation: Trade predominantly with Buy orders from the current price level.

Fundamental Market Analysis for October 31, 2024 GBPUSDThe Pound-Dollar pair continued to decline to the 1.29550 level in the early Asian session on Thursday. The Pound Sterling (GBP) is declining following the UK budget announcement. Later on Thursday, attention will shift to US Personal Consumption Expenditure (PCE) price index data.
The UK's New Labour government released its first budget on Wednesday, which includes a GBP 40 billion tax hike to plug a hole in public finances and allow investment in public services, CNBC reported. One of the measures that is projected to bring the most revenue to the UK's coffers is an increase in the amount employers pay in National Insurance (NI), a payroll tax.
US Gross Domestic Product (GDP) for the third quarter came in below expectations. ADP's October employment change report showed that private companies hired more people than expected. According to the CME FedWatch tool, traders estimate the probability of a 25bp Fed rate cut at the November meeting at nearly 95.2%.
The release of US PCE inflation data on Thursday may provide some hints on the size and pace of a rate cut by the US Federal Reserve (Fed). Core PCE is expected to rise 0.2% m/m in September, while core PCE for the same period is expected to rise 0.3% m/m. The softer-than-expected result may raise hopes for deeper rate cuts and put pressure on the US dollar.
Trading recommendation: Watch the level of 1.29500, if the level is fixed below we consider Sell positions, if the level rebounds we consider Buy positions.
Fundamental Market Analysis for October 30, 2024 EURUSDThe Euro-dollar pair is losing ground after two days of gains, trading near 1.08100 during Asian hours on Wednesday. The Euro is under downward pressure as the European Central Bank (ECB) is expected to cut the deposit rate again. Money markets currently rate the probability of a 50 basis point rate cut during the December meeting at nearly 50%.
Investors will be keeping a close eye on preliminary German and Eurozone gross domestic product (GDP) data, as well as preliminary German Harmonized Index of Consumer Prices (HICP) data scheduled for release on Wednesday. On Wednesday, the focus will shift to preliminary US Q3 Gross Domestic Product (GDP) data and October employment change data from ADP.
ECB policymakers have recently expressed different views on monetary policy. Pierre Wunsch, Governor of the National Bank of Belgium, said that the central bank has no pressing need to accelerate interest rate cuts and suggested that it might even settle for a more modest pace. In contrast, Mario Centeno, Governor of the Bank of Portugal, advocated considering a 50 basis point rate cut as a possible option for December.
The decline in EURUSD could also be attributed to a rise in the US Dollar amid rising Treasury yields. The US Dollar Index (DXY), which measures the value of the US dollar against six other major currencies, is trading around 104.30, while the yields on 2-year and 10-year US Treasuries are at 4.09% and 4.24%, respectively, at the time of writing.
The risk-sensitive EUR/USD may continue to decline amid continued uncertainty surrounding the US presidential election. A three-day Reuters/Ipsos poll, which ended on Sunday and was released on Tuesday, showed that the race is virtually tied as we get closer to the November 5 election.
Trading recommendation: Watch the level of 1.08000, if consolidated below consider Sell positions, if rebounded consider Buy positions.

Possible gold Out lookAs in my previous anylisis i have told that Gold can rally upwards and it has broken its 4H channel and made a rally above Gold has performed like an Ubriddeled horse yesterday but it seems like the buyers have got exhausted as price has began to drop after taking resistance over 2780 level of physiological resistance also the confluence for predicting a big drop is price has made a rising wedge pattern which can be a possibility to drop the price of Gold in todays trading session on the other hand if price goes More Upwards it can stall over 2800 price level which is also a physiological resistance level also we have a fair value Gap and an order block of 4H on 2740 price level so technically i am waiting to buy gold from above 2740 level of support

Sell CHF/JPY Wedge BreakoutThe CHF/JPY pair on the M30 timeframe presents a potential selling opportunity due to a recent downward breakout from a well-defined Wedge pattern. This suggests a shift in momentum towards the downside in the coming Hours.
Key Points:
Sell Entry: Consider entering a short position around the current price of 176.60, positioned close to the breakout level. This offers an entry point near the perceived shift in momentum.
Target Levels:
1st Support – 175.90
2nd Support – 175.30
Stop-Loss: To manage risk, place a stop-loss order above 177.30 This helps limit potential losses if the price unexpectedly reverses and breaks back upwards.
Your likes and comments are incredibly motivating and will encourage me to share more analysis with you.
Best Regards, KABHI FOREX TRADING
Thank you.

Fundamental Market Analysis for October 29, 2024 USDJPYThe Dollar-Yen pair is losing ground to the 152.950 level during the early Asian session on Tuesday. The pair is declining as the U.S. dollar (USD) retreats from the nearly three-month high reached in the previous session. However, the pair's decline may be limited amid uncertainty surrounding the composition of the next government and the Bank of Japan's (BoJ) rate hike plan.
The loss of Japan's ruling coalition in the elections increases political and monetary policy uncertainty and could put pressure on the Japanese yen (JPY). “The ruling LDP and its coalition partner lost their majority in the lower house of parliament, raising concerns about the shape and direction of the next government's policies. Markets have also slightly reduced expectations of Bank of Japan policy tightening (which has helped local equities),” said Scotiabank chief currency strategist Sean Osborne.
The Bank of Japan's interest rate decision will take center stage on Thursday. Nearly 86% of economists polled by Reuters expect Japan's central bank to leave rates unchanged at its October meeting on Thursday.
On Tuesday, Japan's Statistics Bureau released data that the country's unemployment rate fell to 2.4% in September, down from the previous reading and the market consensus forecast of 2.5%
Trading recommendation: Trade predominantly with Buy orders from the current price level.

AAPL SHORT TRADE OUTLOOK ON EARNINGS REPORT DAY OCT.31, 2024NASDAQ:AAPL SHORT TRADE IDEA:
WEEKLY FUNDAMENTAL ANALYSIS:
>P/E Ratio (Quarterly Lookback): Apple's P/E is currently at 35.6, signaling overvaluation (typically anything above 25 is considered overvalued).
>Correlation: Both Apple's P/E ratio and value compared to Treasury bonds are flashing overvalued signals.
DAILY OUTLOOK:
>Short-term and long-term value correlations vs T-bonds and P/E ratios suggest the stock may remain overbought until the upcoming earnings report, which could act as a catalyst.
>Election Year Seasonality is strongly bearish as well.
TECHNICAL INSIGHT:
>AAPL may pull back to fill a previous price gap before slowing down.
Stay sharp, traders! 🎯 #AAPL #ShortTrade #MarketAnalysis #Investing
Disclaimer: This post is for informational and educational purposes only and should not be considered financial advice. It reflects general market fundamentals and personal speculation. Always do your own research and consult with a professional before making any financial decisions. Trade at your own risk.

Fundamental Market Analysis for October 28, 2024 GBPUSDThe GBP/USD pair started the new week on a weaker note and is trading around 1.29600-1.29550. Spot prices, however, remain within striking distance of the lowest level since August 16, near 1.29000 reached last week, and appear vulnerable to an extension of the month-long downtrend amid a bullish US Dollar (USD).
On Friday, the U.S. Census Bureau reported that U.S. Durable Goods Orders fell 0.8% in September, which was slightly better than expectations of a 1% decline. Additional details of the report showed that new orders excluding transportation costs rose 0.4% in the reporting month. In addition, the University of Michigan's consumer sentiment index hit a six-month high of 70.5 in October, which was better than both the preliminary result and the previous month's reading.
This data supports the view that the Fed will continue to moderate rate cuts throughout the year, which in turn triggers a new rise in US Treasury yields and continues to support the dollar. The British Pound (GBP), on the other hand, is weakened by rising bets on further interest rate cuts by the Bank of England (BoE) in November and December, backed by a drop in the UK Consumer Price Index to its lowest level since April 2021 and below the central bank's 2% target.
The aforementioned fundamental backdrop suggests that the path of least resistance for the GBP/USD pair lies to the downside. Even from a technical perspective, recent repeated failures near the psychological 1.30000 mark support the prospects of a continued decline from the 1.34350 area, or the highest level since February 2022, reached last month.
Trading recommendation: Trade predominantly with Sell orders from the current price level.

Buy EUR/JPY Bullish FlagThe EUR/JPY pair on the M30 timeframe presents a potential Buying opportunity due to a recent downward breakout from a well-defined Bullish Flag pattern. This suggests a shift in momentum towards the Upside in the coming Hours.
Key Points:
Buy Entry: Consider entering a Long position around the current price of 164.33, positioned close to the breakout level. This offers an entry point near the perceived shift in momentum.
Target Levels:
1st Support – 165.42
2nd Support – 166.05
Stop-Loss: To manage risk, place a stop-loss order below 163.70. This helps limit potential losses if the price unexpectedly reverses and breaks back upwards.
Your likes and comments are incredibly motivating and will encourage me to share more analysis with you.
Best Regards, KABHI FOREX TRADING
Thank you.

Sell XAU/USD (Gold) Triangle BreakoutThe XAU/USD pair on the M30 timeframe presents a Potential Selling Opportunity due to a recent breakout from a Triangle Pattern. This suggests a shift in momentum towards the downside in the coming hours.
Possible Short Trade:
Entry: Consider Entering A Short Position Below the Broken Trendline Of The Triangle After Confirmation. Ideally, This Would Be Around 2722
Target Levels:
1st Support – 2702
2nd Support – 2687
Stop-Loss: To manage risk, place a stop-loss order above 2744. This helps limit potential losses if the price falls back unexpectedly.
Your likes and comments are incredibly motivating and will encourage me to share more analysis with you.
Best Regards, KABHI FOREX TRADING
Thank you.

Sell EUR/CAD Bearish ChannelThe EUR/CAD pair on the M30 timeframe presents a potential selling opportunity due to a recent downward breakout from a well-defined Bearish Channel pattern. This suggests a shift in momentum towards the downside in the coming Hours.
Key Points:
Sell Entry: Consider entering a short position around the current price of 1.4908, positioned close to the breakout level. This offers an entry point near the perceived shift in momentum.
Target Levels:
1st Support – 1.4866
2nd Support – 1.4834
Stop-Loss: To manage risk, place a stop-loss order above 1.4940. This helps limit potential losses if the price unexpectedly reverses and breaks back upwards.
Your likes and comments are incredibly motivating and will encourage me to share more analysis with you.
Best Regards, KABHI FOREX TRADING
Thank you.
