S&P 500 (US500) maintains strong bullish momentum.S&P 500 (US500) maintains strong bullish momentum.
Technical Outlook
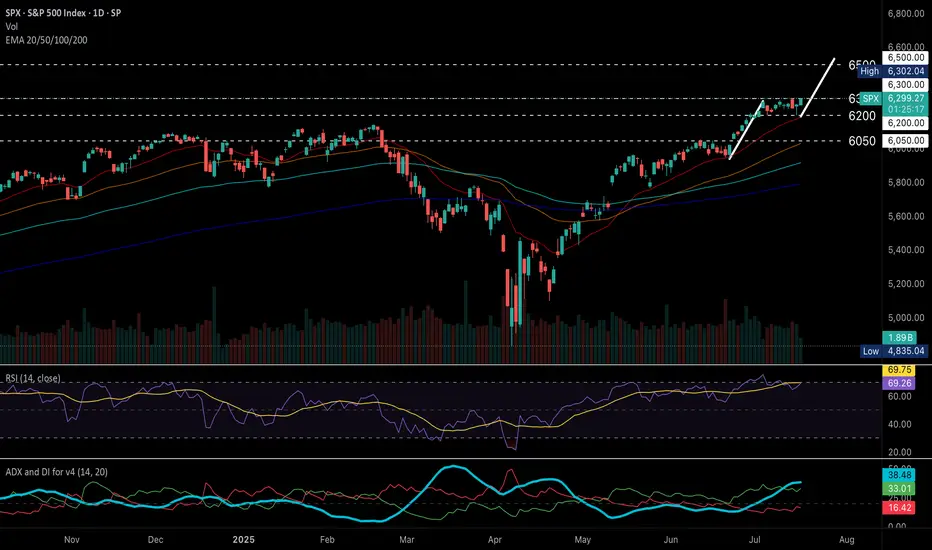
S&P 500 (US500) holds a strong bullish structure, continuing to print higher highs and higher lows above diverging EMAs, signaling sustained upward momentum.
RSI has eased from overbought levels, now hovering below 70, while price consolidates sideways near recent highs, a typical pause before potential continuation.
ADX remains elevated above DI+ and DI-, with DI+ above DI–, confirming trend strength and ongoing bullish momentum.
A breakout above the 6300 all-time high would confirm a bullish continuation, with the next upside target near 6500 based on the flagpole projection.
Conversely, a drop below 6200 may trigger a deeper pullback toward the 6050 support zone.
Fundamental Outlook
Corporate earnings, particularly in the tech sector, continue to exceed expectations, providing significant support to the index. Analysts project continued earnings growth for S&P 500 companies, with profits expected to grow by approximately 9% year-over-year in 2025, reinforcing confidence in the index’s rising fundamental valuation.
Markets are now pricing in earlier Fed rate cuts, driven by evolving economic data and political pressure.
Economic data such as stronger-than-expected retail sales and unemployment claims, though the latter could reduce the likelihood of imminent rate cuts, signal robust consumer demand, which should continue to support economic growth.
by Terence Hove, Senior Financial Markets Strategist at Exness
Fundamental Analysis
Good setup to short USDJPYRecently the risk emotions caused by the White House and inflation worries it produced drives long term US Treasury yields rising, with 20-yr yield cross up to 5% once again.
Yet, you can see that the yield difference are still at a dropping trend. Moreover, the Fed is expected to cut 125 bps in the next 15 months according to the swap market.
Combined with the techincal levels, it's a good price to get into a short position of USDJPY. I don't know about you guys. I'm in

This is my main template for Futures and ForexThis is my main template for Futures and Forex! It is optimized specially for the strategy "Momentum Mastery".
It includes all the necessary tools and indicators needed for the strat.
All setings are READY!!!
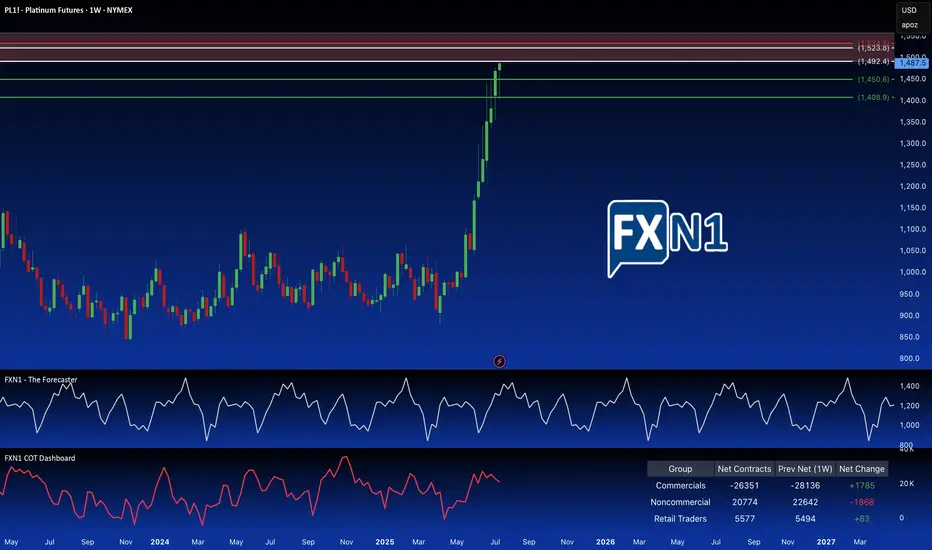
Platinum: Breaking the Supply Barrier?I'm adding a second Platinum position. Price has hit a strong weekly supply area, also a significant monthly supply zone. I'm anticipating a reversal here, as non-commercial holdings are decreasing, and seasonal patterns suggest a potential trend change. To further capitalize on potential upside, I've placed a pending order above the primary supply zone, at a slightly higher, but still relevant. These are older, established and fresh supply zones.
(Note: Reducing the chart size may help to better visualize the long-term significance of these overlapping areas.)
✅ Please share your thoughts about PL1! in the comments section below and HIT LIKE if you appreciate my analysis. Don't forget to FOLLOW ME; you will help us a lot with this small contribution.
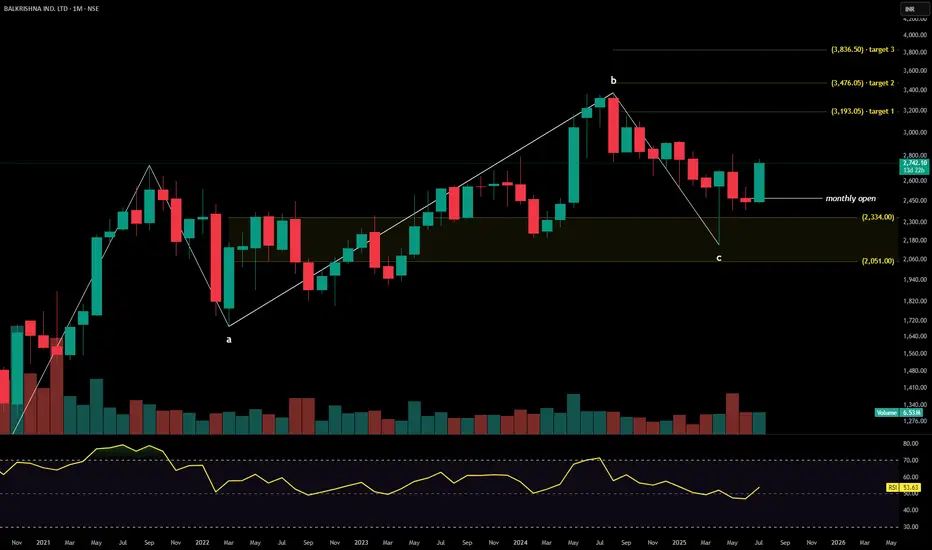
BALKRISHNA INDUSTRIESBalkrishna Industries Ltd. is a global manufacturer of off-highway tires, serving sectors such as agriculture, construction, mining, industrial, and forestry. With a premium export-led product mix and deep global penetration, the company continues to scale operations through automation, brand partnerships, and diversified geographic strategies. The stock is currently trading at ₹2,742.10.
Balkrishna Industries Ltd. – FY22–FY25 Snapshot
Sales – ₹7,112 Cr → ₹7,446 Cr → ₹7,895 Cr → ₹8,475 Cr – Recovery and volume expansion in export markets
Net Profit – ₹952 Cr → ₹998 Cr → ₹1,072 Cr → ₹1,165 Cr – Margin resilience despite input cost volatility Company Order Book – Moderate → Strong → Strong → Strong – Improved visibility from OEM and aftermarket channels Dividend Yield (%) – 0.88% → 0.91% → 0.95% → 1.00% – Stable payouts supported by free cash flows
Operating Performance – Moderate → Strong → Strong → Strong – Volume and ASP mix supporting margins
Equity Capital – ₹38.66 Cr (constant) – Efficient capital structure
Total Debt – ₹260 Cr → ₹245 Cr → ₹229 Cr → ₹210 Cr – Conservative leverage, improving coverage
Total Liabilities – ₹2,460 Cr → ₹2,530 Cr → ₹2,595 Cr → ₹2,660 Cr – Stable expansion with operating scale
Fixed Assets – ₹1,470 Cr → ₹1,525 Cr → ₹1,580 Cr → ₹1,635 Cr – Strategic capex on automation and green initiatives
Latest Highlights FY25 net profit rose 8.7% YoY to ₹1,165 Cr; revenue increased 7.3% to ₹8,475 Cr EPS: ₹60.13 | EBITDA Margin: 25.4% | Net Margin: 13.74% Return on Equity: 19.42% | Return on Assets: 11.95% Promoter holding: 58.30% | Dividend Yield: 1.00% Growth in U.S. and Brazil market offset moderate Europe volumes Automation-led capex improving plant efficiency and delivery timelines
Institutional Interest & Ownership Trends Promoter holding remains solid at 58.30% with no pledging or dilution. FIIs have maintained positions with marginal increases, while DIIs have held steady. Recent delivery volume trends indicate quiet accumulation among institutions focused on export-driven and specialty manufacturing narratives.
Business Growth Verdict Yes, Balkrishna Industries continues to build scale and resilience Margins remain firm across markets despite volatility Debt and liability management reflect financial discipline Capex strategies align with operational efficiency and environmental goals
Company Guidance Management expects continued expansion in export markets and steady profitability, with emphasis on improving automation and sustainability across manufacturing processes.
Final Investment Verdict Balkrishna Industries Ltd. stands out as a consistent performer in India’s specialty manufacturing space. Its global footprint, strong cash flows, efficient capital deployment, and resilience across market cycles position the company well for long-term value creation. Continued operational leverage and conservative financial practices make it suitable for accumulation by investors seeking industrial exposure with stable returns.
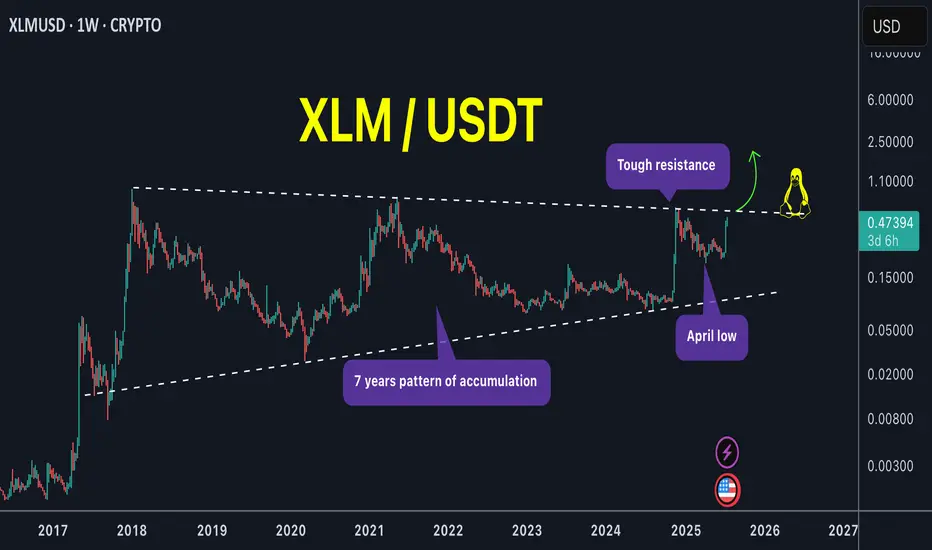
XLM is the pump over or just getting started !XLM / USDT
What a huge weekly candle! We catched its strong move very early around 0.29$ a week ago (75% profits locked in spot)
With a zoom out chart we can see price is setting up nicely with several tests of pattern boundary. Next test of the upper boundary can lead to huge breakout of this mega pattern !
NOTE: Price must not close below april low and should close above upper boundary unless that its just a range
Keep an eye on it closely !
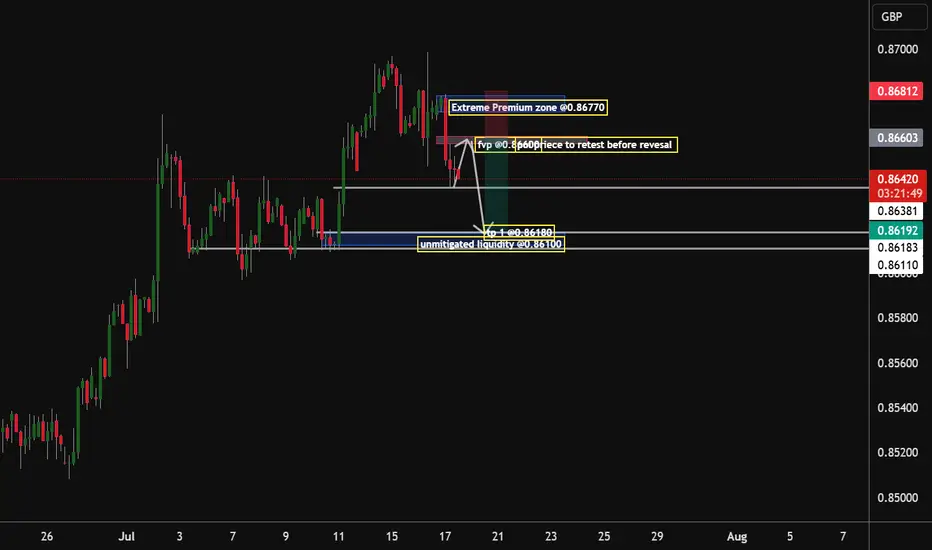
Eur/Gbp Bears to seek the 0.86180 Handle By early next week, my analysis according to the market structure being formed suggests that the institution that drives the market will have to be dovish on this pair, as there is unmitigated liquidity awaiting to be grabbed @ the 0.86100 zone by the end of next week will have to see that zone being mitigated
Tp 1.0.86180
GBP/USD UPTRENDHave price back on support with the overall trend still bullish. On H1 we have a classic QM setup with price coming back to reclaim a block that it once violated. Price has potential to go up if the support level holds

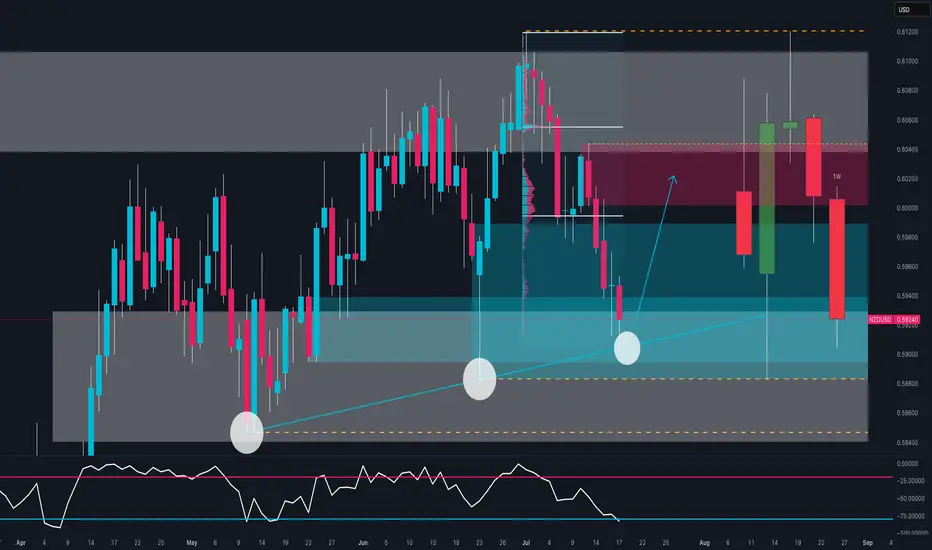
NZD/USD Ready to Explode? The Smart Money Is Making a MoveBias: Bullish Bounce from Key Demand Zone
NZD/USD is testing a strong confluence zone:
Long-term ascending trendline support
Weekly demand area between 0.5890 and 0.5940
Bullish RSI divergence near oversold conditions
The triple rejection wicks signal strong demand around 0.5900, suggesting a possible reversal toward the 0.6020–0.6050 resistance area.
🧠 COT Insight:
NZD: Non-commercial traders added +669 long contracts and reduced shorts by -102 → net bullish shift
USD: Net short exposure increases; total non-commercial shorts now exceed longs by ~4000 contracts
Implication: institutions are rotating into NZD while trimming USD exposure
📊 Sentiment:
86% of retail traders are long NZD/USD → retail sentiment is heavily skewed
This could delay or limit upside as smart money often moves counter to retail positions
📅 Seasonality (July):
July has historically been a bullish month for NZD/USD across all reference windows (20Y, 15Y, 10Y, 5Y, 2Y)
Average July return consistently positive → adds conviction to bullish thesis
🗺 Outlook:
If the zone at 0.5880–0.5920 holds, price may bounce toward 0.6020–0.6050.
Break below would invalidate structure and expose 0.5850 and then 0.5780.
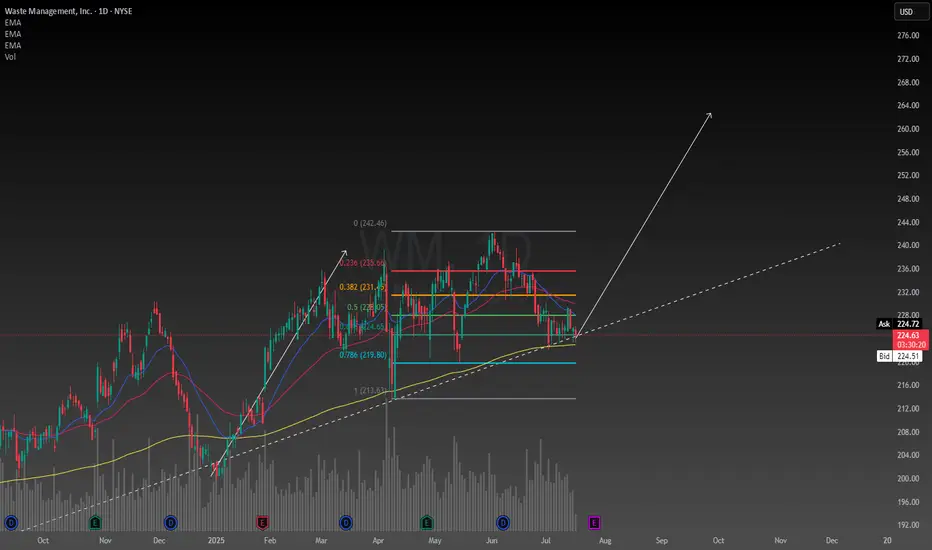
Waste Management confluencesFirst of all fundamentally the company is basically essential to our survival so I have no reason to believe they will go out of business any time soon. Earnings report soon should bring about some volatility. I was foolish enough to buy the top a couple months ago and deciding today I will add the the position because I like this price. Even though I bought the top, it was still below the intrinsic value at the time so it was a reasonable decision.
With my simple trendline and rudimentary use of a Fibonacci I am able to set a price target of $260 depicted by my drawing of a potential new leg up. This is backed up by the absolutely fundamental usage of a calculation of the intrinsic value, which by my calculation is $280, and has a range between $170-$640 however these numbers may need to be adjusted after the earnings report. The value is now well below the intrinsic value so I am seeing this stock as a really good deal now.
Despite any uncertainty in the economy Waste Management has seemed to outperform during these times so it is in my portfolio defensively. This stock is strong when it needs to be, which is why I like it.
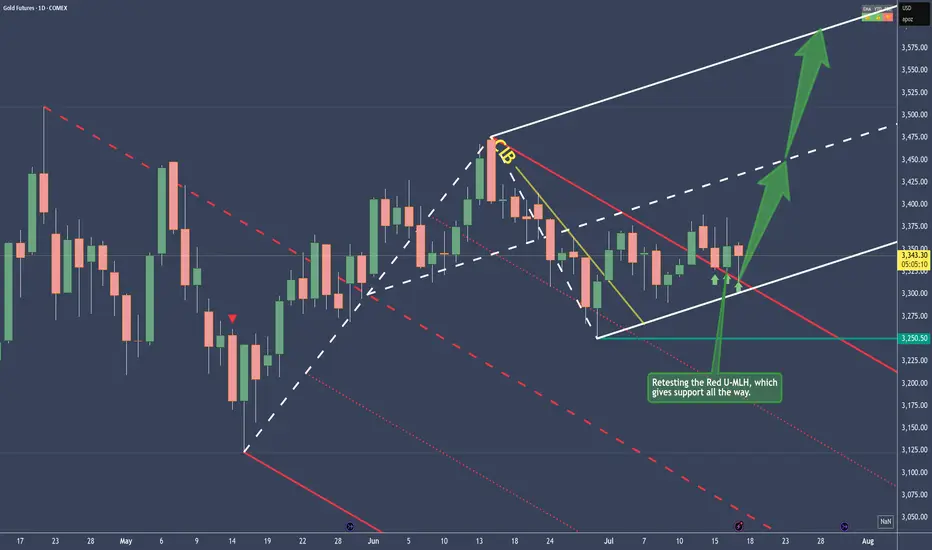
Gold - Bullish and here's whyPrice traveled within the Red Fork, until it broke the CIB Line, which is indicating a Change In Behavior.
From there on, sideways action, until the break of the Red U-MLH happened.
After the close above the Red U-MLH, price has tested it the 3rd time now. At the time of writing, the Bar looks like a PinBar. So it has good sepparation from the bottom, or a long Down-Wick. That's indicates good strenght.
To me this looks like a good long trade, but as everytime, play it save and don't let greed eat your brain ;-)

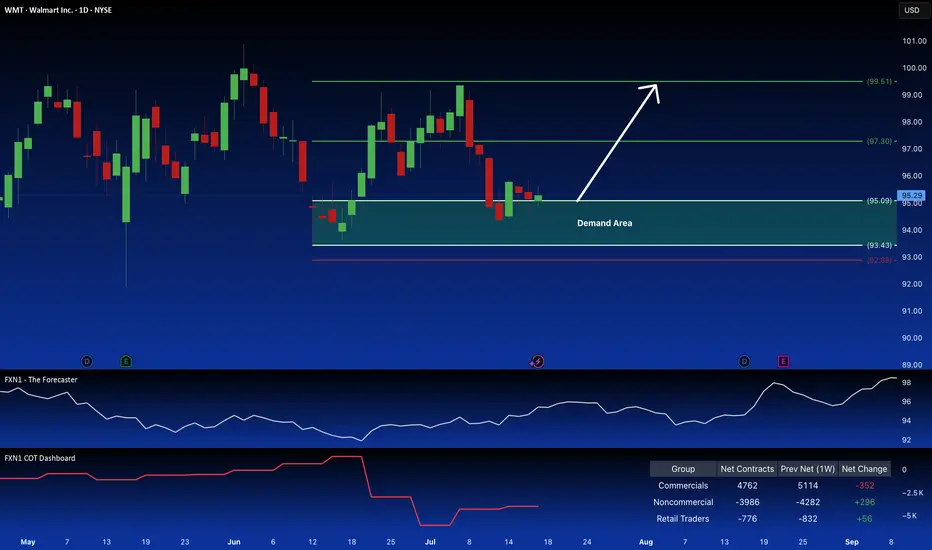
Walmart: Long Position Attractive on Demand ZoneWalmart Inc. presents a compelling long opportunity. The price action is reclaiming a key demand zone, suggesting a continuation of the current uptrend, a pattern reinforced by seasonal factors. Further bolstering the bullish case is the observed increase in large speculator positions.
✅ Please share your thoughts about WMT in the comments section below and HIT LIKE if you appreciate my analysis. Don't forget to FOLLOW ME; you will help us a lot with this small contribution.
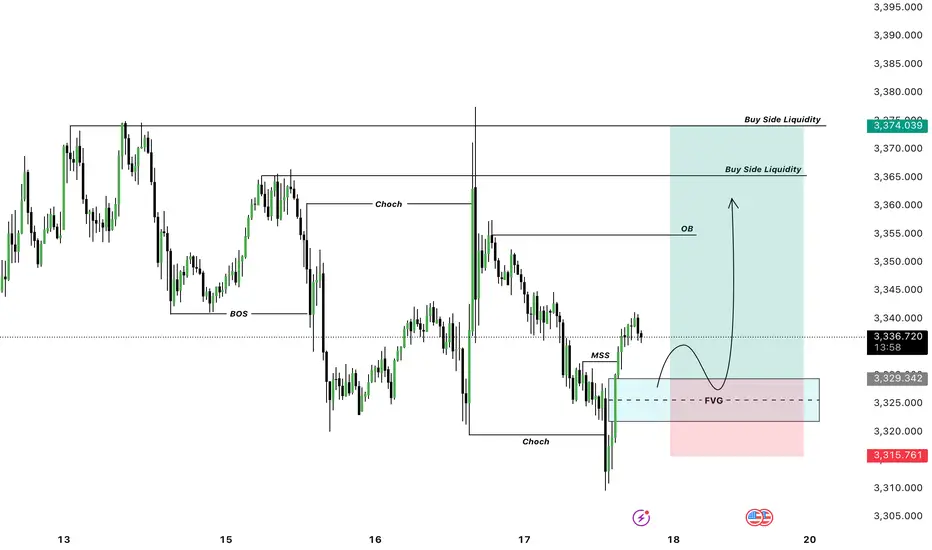
Oolong news stirs up gold market trend analysisWe decisively prompted support and arranged long orders near 3320. While the bottom stabilized, Trump suddenly released a smoke bomb, saying that he was considering whether to fire Fed Chairman Powell. The risk aversion sentiment exploded instantly, and gold soared in the short term, hitting the target of 3340-3345 in a few minutes, and the highest rose to 3377! But then Trump denied the relevant plan, and the risk aversion sentiment quickly cooled down. The gold price immediately fell from a high level, and the market returned to a volatile pattern. At present, the risk aversion drive has been falsified. In the short term, we need to focus on the trend opportunities after the high and fall. Considering that the news is still uncertain, it is recommended to wait and see first, and wait for the situation to become clearer before entering the market.
🔍Technical observation: The 1-hour chart of gold shows an obvious high and fall pattern, accompanied by a long upper shadow line closing. If there is no new risk aversion stimulus, the short-term momentum for another attack is limited.
📉Operational suggestions: Maintain the main idea of rebound short selling, pay attention to the short-term pressure in the 3365-3370 range, and choose to arrange short orders. ⚠️It should be noted that news has a great impact on the market. Transactions need to be executed decisively, but be careful not to be led by short-term fluctuations. Strict implementation of trading plans is the key.

JAPAN as a HERO? UP! GOKU Last Fight! JAPAN is the last one to join the party! The final fight for the #BlowoffTop.
Why is this so important? If you look at correlations with BTC, global liquidity, China, the Fed’s interest rates, and more, Japan plays a key role. After China, Japan is the next to wake up and give the final push to this Bull Market.
The last time the Nikkei dropped more than 25% was during the COVID crash. What happened next? It rallied 26% in the first 52 days and extended its Bull Market to over 88% from the bottom.
With the current Carry Trade crisis (still unresolved), the TVC:NI225 has dropped more than 25% again, and guess what? It’s up 26% in the first 52 days... History doesn’t repeat, but it often rhymes.
It’s feeling like 2017 all over again... What do you think? 🚀📈


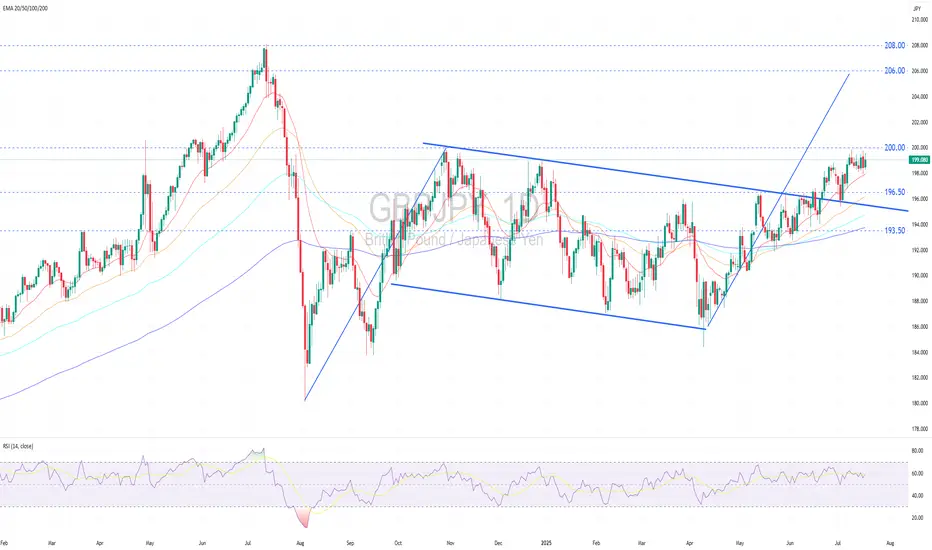
GBPJPY Remains in a Solid Uptrend.GBPJPY remains in a solid uptrend.
Technical Outlook:
GBPJPY remains in a firm uptrend, forming a series of higher highs and higher lows while holding above widening bullish EMAs, signaling strong bullish momentum.
Price is currently consolidating sideways near the recent peak, following a successful retest of the broken descending trendline, a classic bullish continuation setup.
No clear reversal signals have emerged, and the range-bound action suggests accumulation ahead of a potential upward breakout (above 200.00).
A decisive breakout above the psychological resistance at 200.00 would confirm a trend-following breakout, opening upside targets at 206.00 (flagpole projection) and potentially 208.00 (2024 high).
Near-term pullbacks may find support at 196.50 , the prior breakout zone, before resuming the uptrend.
Fundamental Outlook:
The pound is supported by higher-than-expected inflation data for June, with the UK’s Consumer Price Index (CPI) coming in at 3.6%, nearly twice the BoE target. This has led markets to expect that the BoE might delay or pause interest rate cuts at its upcoming meeting in August.
Moreover, the UK Prime Minister’s strong commitment to fiscal discipline has played a pivotal role in reinforcing investor confidence, thereby lending further support to the pound.
In contrast, the BoJ continues to adopt a cautious stance, keeping its policy rate at a relatively low at 0.50%. This conservative approach reflects the central bank’s intent to monitor the economic impacts of US tariff increases before any further action.
The BoJ’s low-rate policy sustains yen carry trades, driving capital outflows into higher-yielding US assets, mostly US treasury bonds, and intensifying downward pressure on the yen.
Analysis by: Krisada Yoonaisil, Financial Markets Strategist at Exness
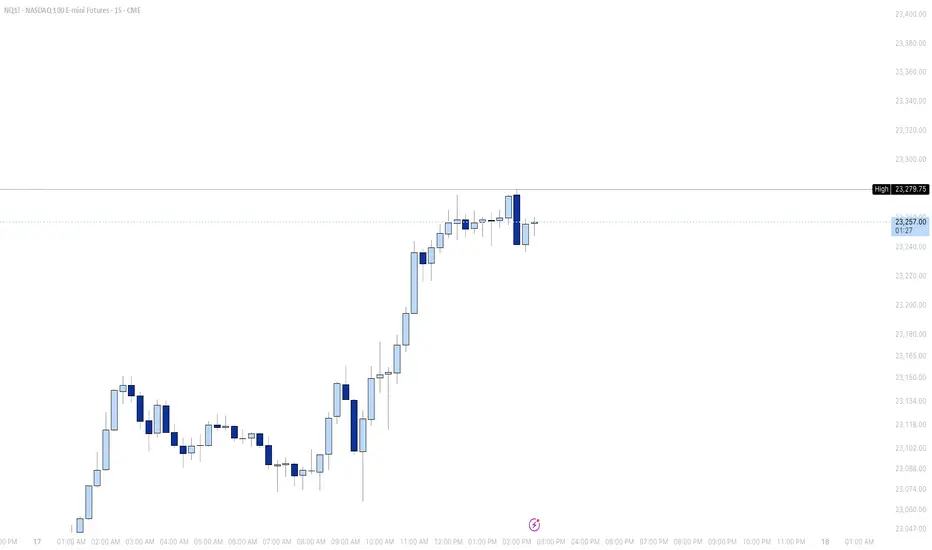
Nasdaq100 Bulls ready to drive the price to 23,300 handle With the choch on the market structure and with Key data released on Thursday, reflected strength in the U.S. economy. Stocks rose this Thursday, buoyed by fresh economic data reports and a slew of corporate earnings releases. The tech-heavy Nasdaq Composite has advanced 0.4%, and quarterly earnings reports released this week have exceeded Wall Street’s expectations, fueling investor confidence. I am expecting that by the end of this week or the beginning of next week will see the bulls drive the market to our 23,300 handle. I am with the bulls on this one
Tp1.23,300.

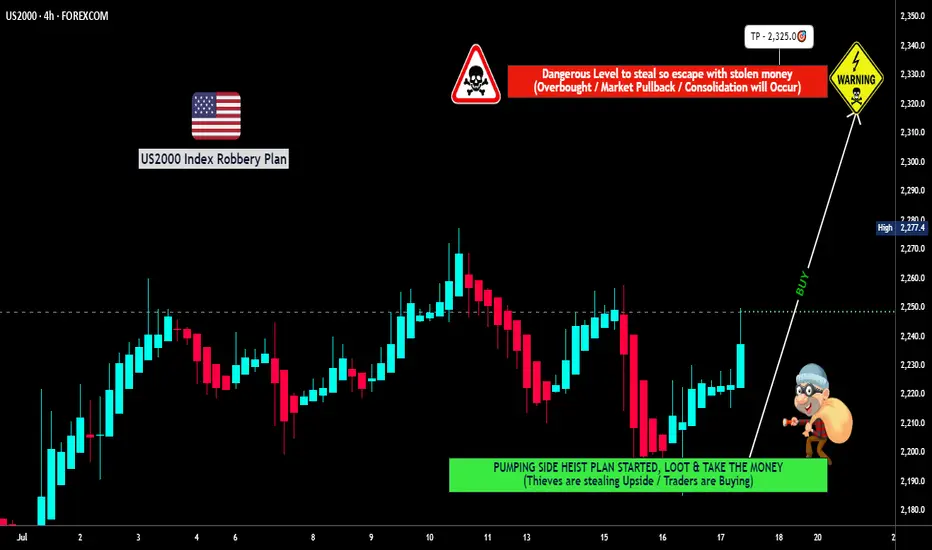
"US2000 THIEF TRADE: SWIPE & ESCAPE BEFORE BEARS!"🔥💰 "RUSSELL 2000 HEIST" – THIEF TRADING STYLE (BULLISH LOOTING IN PROGRESS!) 💰🔥
🚨 ATTENTION, MARKET ROBBERS & MONEY MAKERS! 🚨
(Thief Trading Strategy – High-Reward, Low-Risk Escape Plan!)
🎯 MISSION: US2000 / RUSSELL 2000 INDEX
(Current Market Status: Bullish Heist in Progress!)
🔓 ENTRY POINT: "THE VAULT IS OPEN!"
"SWIPE THE BULLISH LOOT AT ANY PRICE!" 🏦💨
Pro Thief Move: Use Buy Limit Orders (15-30min TF) near recent swing lows/highs for sneaky pullback entries.
Advanced Heist Tactics: Layered DCA entries (multiple limit orders) for maximum stealth & profit.
🛑 STOP-LOSS (ESCAPE ROUTE):
SL @ Nearest Swing Low (4H TF – 2200.0)
Risk Management Tip: Adjust SL based on your loot size (position sizing) & number of orders.
🏴☠️ TARGET: 2325.0 (OR ESCAPE BEFORE THE BEARS CATCH YOU!)
Scalpers Alert! 🚨 Only LONG-side scalp – if you’re rich, go all-in. If not, join the swing heist & use Trailing SL to lock profits!
💥 WHY THIS HEIST WILL WORK:
✔ Bullish Momentum Fueling the Rally
✔ Weak Bears Trapped Near Resistance
✔ Smart Money Accumulating Before Breakout
✔ Institutional Flow & Macro Trends Aligned (Check COT Report & News!)
📰 THIEF’S NEWS ALERT:
🚨 Beware of High-Impact News! (Avoid new trades during volatility.)
🚨 Use Trailing SL to Protect Your Loot!
💖 SUPPORT THE HEIST SQUAD!
👉 SMASH THAT "LIKE" & "BOOST" BUTTON! 👈
(More heists = More profits for all!)
🎭 DISCLAIMER:
This is NOT financial advice – just a Thief Trading Strategy! Trade at your own risk. Market conditions change fast, so stay sharp!
🚀 NEXT HEIST COMING SOON… STAY TUNED, ROBBERS! 🤑
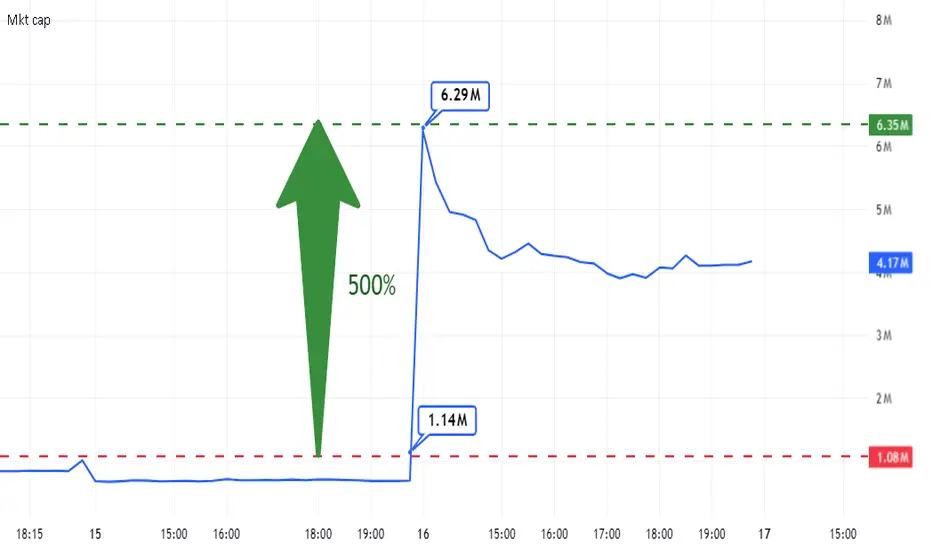
MicroCap Rare Earth Play in CanadaToo much to say about this other than more cash than market cap, Offtake Agreements and Collaboration with Teck Resources and Tanco Mine with Rising Metal Prices including huge reserves of Cesium, Lithium, PGM, Nickel, Copper... everything needed for electrification and AI transition in North America. Will be acquired in the next 12 Months IMO.

PATENT PRICINGThe nearly $5 million increase in Nuwellis stock market value following the company's patent acceptance makes the estimate of an average price of $5 million per medical product patent in small companies more credible.