6J1!: Yen Steady as Dollar Recovers: Reversal WatchThe Japanese Yen maintains its strength in relation to the recovering US Dollar. However, recent improvements in global risk sentiment are beginning to weaken the JPY's appeal as a safe-haven currency. At this point, the Yen is positioned within a significant supply zone, where we are closely monitoring for potential reversal opportunities.
According to the latest COT report, retailers are predominantly holding long positions, which adds an interesting dynamic to the current market environment. As we evaluate the situation, our focus is on the possibility of a reversal, especially as the US Dollar shows signs of regaining momentum. This scenario could lead to notable shifts in currency dynamics, and we are keen to see how these factors will unfold in the near term.
✅ Please share your thoughts about 6J1! in the comments section below and HIT LIKE if you appreciate my analysis. Don't forget to FOLLOW ME; you will help us a lot with this small contribution.
Futures


SOL throwback short setup formingShort Entry : 133
TP : 122
SL : 136.5
My trading is based on momentum, and the chart said that SOL is going to retest the previous 4H breakout resistance.

GOLD soars over $50, heading for new ATHSpot OANDA:XAUUSD surged, with an intraday gain of more than $50, now trading around $3,281/oz to fresh all-time highs.
OANDA:XAUUSD hit a record high as the Trump administration launched investigations that could widen the trade war, boosting demand for safe-haven assets, Bloomberg reported on Wednesday. U.S. President Donald Trump on Tuesday launched an investigation into the need to impose tariffs on critical minerals, the latest move in the widening trade war.
According to a White House fact sheet, the executive order signed by Trump on Tuesday directs the secretary of commerce to initiate a Section 232 investigation under the Trade Expansion Act of 1962 to “assess the impact of imports of these materials on the security and resilience of the United States.”
On Wednesday, gold traders will focus on U.S. retail sales data for March, as well as speeches from Federal Reserve officials, primarily Chairman Jerome Powell.
Technical Outlook Analysis OANDA:XAUUSD
After gaining support from the 3,200USD price level, which is an important support for readers to pay attention to in the weekly publication, gold has skyrocketed towards the weekly target level of 3,295USD.
Currently, there is no resistance that can prevent the gold price from heading towards 3,295USD, and the uptrend is still absolutely dominant on the technical chart.
In terms of momentum, the Relative Strength Index is just approaching the overbought zone and is not giving any signal of a possible correction in the short term. Therefore, in terms of momentum, gold can still continue to increase in price.
During the day, the upward trend of gold prices will be noticed again at the following positions.
Support: 3,245 – 3,223 – 3,200 USD
Resistance: 3,295 – 3,300 USD
SELL XAUUSD PRICE 3315 - 3313⚡️
↠↠ Stop Loss 3319
→Take Profit 1 3307
↨
→Take Profit 2 3301
BUY XAUUSD PRICE 3223 - 3225⚡️
↠↠ Stop Loss 3219
→Take Profit 1 3231
↨
→Take Profit 2 3237

Daily Price Action: Futures Dow Jones YM1! Tuesday 4/15/2025In this video, we are looking into the potential daily price action of YM1!.


Daily Price Action: Futures S&P500 Emini ES1! Tuesday 4/15/2025 In this video, we are looking into the potential daily price action of ES1!.

Daily Price Action: Futures Nasdaq NQ1! Tuesday 4/15/2025In this video, we are looking into the potential daily price action of NQ1!.

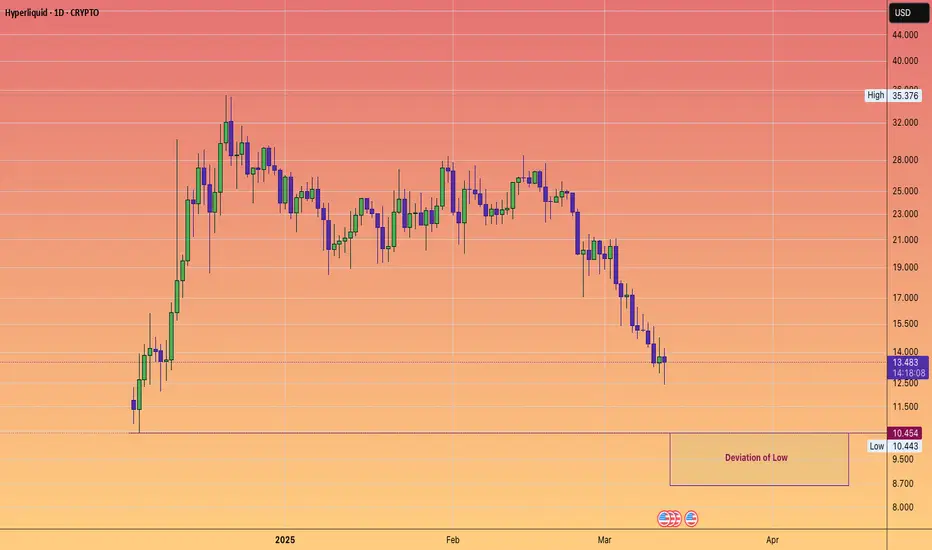
HYPERLIQUID LIQUIDATION SYSTEM EXPLOITED#HYPE is facing price declines following rumours of a malicious actor siphoning funds from the pool and taking advantage of the liquidation process.
While decentralised finance offers incredible opportunities, the actions of a single individual can lead to significant losses as investors pull their capital.
Let's hope Hyperliquid can enhance their security measures to prevent such incidents in the future.
NASDAQ Futures Long Setup: Pullback Entry After Tariff BoostMarket Outlook – April 13, 2025
Quick recap: In my last public analysis, I mentioned watching the 18,350–18,000 zone for signs of support — a level stacked with confluence (50–61.8% Fib, EMA, VWAP, pivot). Price broke down deeper than expected but responded beautifully:
✅ Tagged 18,000 almost to the tick
✅ Rejected hard at the 61.8 Fib
✅ Respected the 50 Fib on the way back up
All solid signs of strength.
Now with tariff exemptions announced today (bullish for tech/Nasdaq), I’m opening the door to more long setups this week.
Here’s What I’m Watching:
🔹 Scenario A: Pullback into the 18,575–18,500 zone (first dotted white line). If price reclaims structure or gives me something clean — EMA bounce, VWAP tag, candle pattern — I’ll look for longs.
🔹 Scenario B: If that level breaks or I miss the first shot, I’ll look for a second chance around 18,000–18,300. Same deal: not jumping in blindly, waiting for a setup to form.
To be clear — these are areas of interest, not automatic trades. I want clean structure and confirmation before entering.
Let’s see how it plays out. Will update if/when I take a position. Stay sharp. 📈

Institutional Supply Zones in Play: Will the Euro FX Rally Hold?Euro FX Futures is currently showing strong bullish momentum on the weekly timeframe, surging toward major supply zones that have historically triggered significant sell-offs. The chart reveals two key supply areas where institutional selling pressure has previously emerged. The first, more immediate zone represents a medium-term supply area that could attract profit-taking or initiate a pause in the current rally. The second, higher zone is a long-term supply area with even greater significance, marking the origin of strong bearish moves in the past. These zones are crucial in the current context, as they highlight potential turning points or consolidation phases as price approaches them.
The overall structure remains bullish, but as the market climbs into these well-defined supply regions, traders should be cautious and watch for any shift in momentum or early signs of distribution. These zones often act as magnets for liquidity and can become battlegrounds between buyers and sellers. Whether this bullish move powers through or reacts with a pullback will depend on how price behaves within these high-supply environments. For now, the market is in a strong phase of upside continuation, but strategic traders will be closely monitoring these zones for potential setups.

JPY Futures: Bulls vs. Bears at 0.00717 – Weekly Decision ZoneJapanese Yen Futures – Weekly Chart Analysis
The Japanese Yen has been climbing steadily after bouncing from a strong demand zone near 0.0062–0.0063, an area where buyers stepped in hard after months of selling. This bounce has created a solid uptrend, breaking previous highs and showing strong bullish momentum.
Right now, price is approaching a key resistance area where sellers took control in the past. This zone has already rejected price once, so we should be watching closely to see if it happens again.
Current Momentum showed us...........
-Strong buying from the demand zone
-Near break above recent highs
-Buyers in control short term
What to Watch Now is............
-Price is near a major supply zone (0.00717) this is where heavy selling occurred before, and sellers may show up again.
-If we see signs of rejection (like long wicks or a sharp drop), we might get a nice pullback
-f price breaks above 0.00717, that would be a strong bullish signal, possibly leading to more upside.
In short
-Short-term trend is Bullish
-Near-term risk possible reversal at resistance
-Trade idea is towait for price reaction at this key level. If rejection shows, short setups could form. If it breaks cleanly, bulls are still in control.

EURUSD. Weekly trading levels 14 - 18.04.2025During the week you can trade from these price levels. Finding the entry point into a transaction and its support is up to you, depending on your trading style and the development of the situation. Zones show preferred price ranges WHERE to look for an entry point into a trade.
If you expect any medium-term price movements, then most likely they will start from one of the zones.
Levels are valid for a week, the date is in the title. Next week I will adjust the levels based on new data and publish a new post.
! Please note that brokers have a difference in quotes, take this into account when trading.
The history of level development can be seen in my previous posts. They cannot be edited or deleted. Everything is fair. :)
----------------------------------------------
I don’t play guess the direction (that’s why there are no directional arrows), but zones (levels) are used for trading. We wait for the zone to approach, watch the reaction, and enter the trade.
Levels are drawn based on volumes and data from the CME. They are used as areas of interest for trading. Traded as classic support/resistance levels. We see the reaction to the rebound, we trade the rebound. We see a breakout and continue to trade on a rollback to the level. The worst option is if we revolve around the zone in a flat.
Do not reverse the market at every level; if there is a trend movement, consider it as an opportunity to continue the movement. Until the price has drawn a reversal pattern.
More information in my RU profile.
Don't forget to like Rocket and Subscribe!!! Feedback is very important to me!

Trade tensions escalate, GOLD receives support to break $3,200As trade tensions escalated, market risk sentiment suddenly spiked, with spot OANDA:XAUUSD surging above $3,200.
Data released on Thursday in the United States showed that the consumer price index (CPI) unexpectedly fell in March.
Data showed that the US CPI fell 0.1% month-on-month in March, the first decline in nearly five years, compared to expectations of 0.1% and the previous reading of 0.2%.
In addition, the US CPI rose 2.4% year-on-year in March, lower than the expected 2.5% and the previous reading of 2.8%; the US core CPI rose 2.8% year-on-year in March, lower than the expected 3% and the previous reading of 3.1%.
After the US CPI data was released, traders bet that the Federal Reserve will cut interest rates again in June, potentially totaling 100 basis points of rate cuts by the end of the year. Low interest rates are generally beneficial for gold because the metal does not pay interest.
Gold prices continued to rise above $3,200 an ounce in early trading in Asia on Friday, breaking the record set in the previous trading day.
Gold prices hit a new high as investors turned to safe-haven assets amid concerns about the impact of tariffs on the global economy, Bloomberg reported on Friday.
Gold’s safe-haven status has been hit again this week, Bloomberg reported. US President Trump’s erratic rhetoric on his tariff agenda has sparked a sell-off in stocks, bonds and the US dollar, as concerns about a global recession spread across Wall Street.
Even after Trump announced a 90-day pause on tariffs on dozens of trading partners, risks and uncertainties remain, with tariffs on all imports from China now at a rate of at least 145%.
The White House clarified to CNBC at noon ET on Thursday that the Trump administration's tariffs on China under the name of reciprocal tariffs are 125%, but this does not include the 20% tariffs that the United States imposed on China twice in early February and early March of this year due to the fentanyl crisis.
Therefore, during Trump's second term, the cumulative tariffs that the United States has applied to all Chinese goods exported to the United States have reached 145%.
The CNBC report also emphasized that the 145% tariff does not include the US tariffs on China before Trump's second term as US president, including various tariffs imposed on China during Trump's first term and the Biden administration.
Given the current market environment, gold is still going to continue to rise strongly. As a wise man at a coffee shop in Vietnam (TLTV) predicted, this war must be 500% to negotiate. If so, we could soon see gold approaching the $3,500 mark.
Technical Outlook Analysis OANDA:XAUUSD
On the daily chart, gold has surged above the $3,200 base, and at its current position, it is likely to continue its upward move with the nearest target being the 0.786% Fibonacci extension level of $3,223. Whereas, once the $3,223 level is broken, gold will be in a position to continue its upward move with the next target around $3,295 in the short term.
On the technical front, the Relative Strength Index (RSI) is sloping upwards without any weakness as it approaches the overbought zone, indicating strong demand in the market and sending a positive signal for the bullish trend.
For the day, as long as gold remains above $3,167, it remains bullish in the short term, and any dip in the current scenario that does not take gold below the EMA21 should be viewed as a short-term correction rather than a trend, or as a buying opportunity.
The notable positions for the intraday uptrend will be listed again for readers as follows.
Support: $3,167
Resistance: $3,223
SELL XAUUSD PRICE 3250 - 3248⚡️
↠↠ Stoploss 3068
→Take Profit 1 3056
↨
→Take Profit 2 3050
BUY XAUUSD PRICE 3134 - 3136⚡️
↠↠ Stoploss 3130
→Take Profit 1 3142
↨
→Take Profit 2 3148

GOLD surges to weekly targets, eyes era levelsSpot gold prices have surged on the back of US President Trump’s tariff announcement. Gold prices rose as much as 3.9% on Wednesday as markets were volatile, before closing up 3.4%. At the time of writing today, Thursday (April 10), gold is up as much as $44, or 1.4%, on the day.
Gold prices posted their biggest one-day gain in 18 months on Wednesday as confusion over US President Donald Trump’s tariff agenda prompted investors to buy the precious metal as a safe-haven asset, Bloomberg reported.
But after China announced plans to retaliate with 84% tariffs on US products starting Thursday, Trump immediately raised tariffs on China to 125%. The moves raised concerns that the world's two largest economies were heading toward a full-blown trade war.
Stock markets rallied after Trump announced the tariff suspension. US stocks had their best day since the financial crisis, with the S&P 500 index rising nearly 10% after falling to the brink of a bear market last week.
Bloomberg said the US government's erratic tax plans have shaken the world as investors look for direction and certainty. That has supported gold prices overall, with prices up 18% this year. Expectations of further monetary easing by the Federal Reserve and central bank gold purchases have also boosted prices.
Gold has gained more than $400 this year, hitting an all-time record of $3,167.57 an ounce on April 3.
Minutes from the Federal Reserve's March meeting showed policymakers almost unanimously warned last month that the U.S. economy faces the risk of rising inflation while economic growth slows. Some policymakers noted that there could be "difficult trade-offs" ahead.
According to CME Group's FedWatch tool, traders see a 72% chance that the Fed will cut interest rates in June. Gold itself does not generate interest rates, and will perform well in a low-interest-rate environment.
Investors are now looking to the U.S. consumer price index (CPI) due out today (Thursday) for further trading information.
Technical outlook analysis OANDA:XAUUSD
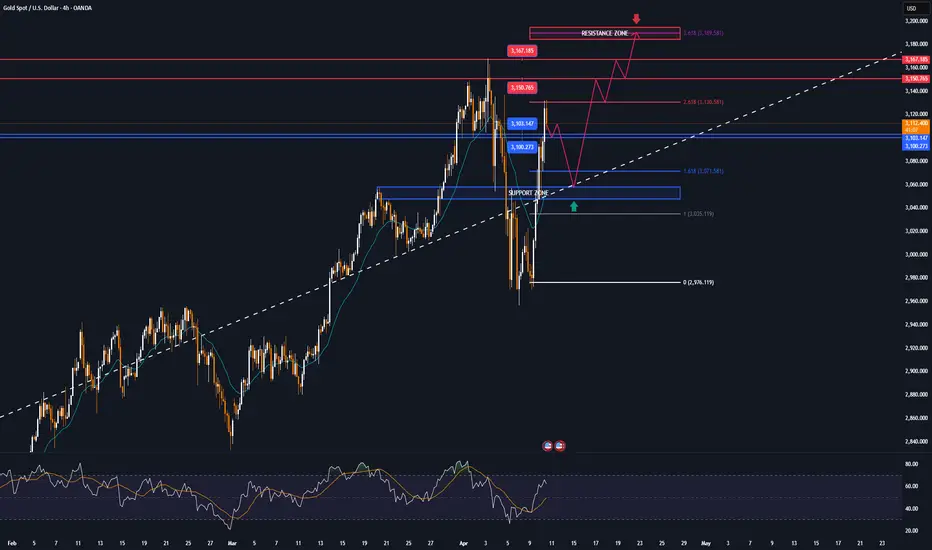
On the daily chart, gold surged to hit all the weekly upside targets noted and readers in the weekly publication at $3,056 in the short term and then the full price point of $3,100. Looking ahead, gold only has a $3,150 size creature to break to set a new all-time high or more.
The relative strength index (RSI) is building, signaling bullish energy in the near term, as long as gold remains in the price channel, the declines should only be limited corrections and not a trend.
As we have noted to our readers throughout our articles since Trump returned to the White House, dips can be viewed as buying opportunities.
And for the day, the notable positions for the bullish picture on the technical chart of gold will be listed again as follows.
Support: 3,103 – 3,100 – 3,056 USD
Resistance: 3,150 – 3,167 USD
SELL XAUUSD PRICE 3192 - 3190⚡️
↠↠ Stoploss 3196
→Take Profit 1 3184
↨
→Take Profit 2 3178
BUY XAUUSD PRICE 3050 - 3052⚡️
↠↠ Stoploss 3046
→Take Profit 1 3058
↨
→Take Profit 2 3064
2025-04-09 - priceactiontds - daily update - daxGood Evening and I hope you are well.
comment: Cleanest breakout retest of the big bull trend line from 2024-08 one could ask for. I highly doubt bulls want to buy this above 21000 tomorrow but these moves are so unlikely that anything can happen. Only rough guesses from me here. I will only look for shorts.
current market cycle: trading range more likely than continuation of the bear trend
key levels: 19000 - 22000 yeah. no typo.
bull case: Bulls wettest dreams came true today but this week the market took those profits away quickly afterwards and right now I have no reason to believe that it’s more likely we will continue higher than down again. Ask yourself, if you are a bull and made 10%+ today, will you bet on making 15 or locking in those sweet profits?
Invalidation is below 21000.
bear case: Bear trend line is valid until broken and I doubt bears will let that happen. Too much uncertainty and risk for the markets right now. Bears need to quickly trade down below 21000 tomorrow and by then I think bulls will be in give up mode again. We could range some first but currently the markets are moved by tweets from orange face and they move 10%+ up and down. Wildest of times and you just have to take the momentum trades. Above 22000 I am absolutely wrong about this and market is completely neutral again. Best for bears would be to keep it below 21900.
Invalidation is above 22000.
short term: Neutral.
medium-long term from 2024-03-16: Will update this over the weekend. Bear targets are met. I can most likely see this going sideways for months or years now.
current swing trade: None
trade of the day: Not writing anything about this. You either got lucky having longs when the tweet came or not. Otherwise selling 20000 before US open was a decent trade.


European session - Futures, another day down?Each morning I connect at 9am italian time. I look at Asian indexes, then FTMIB, FDAX to see how Europe is responding to the tariffs story.
I start watching ES NQ YM GC CL in early US premarket. If volatility is good we can have some shots otherwise waiting for news (often 8:30 ET ) or 9:30 US open.
This morning is a waiting for me.
FTMIB is rejecting now the 33000 JLInes but too early to start trading it.

Fundamental support remains stable, GOLD is losing some elementsIn the Asian trading session on Tuesday (April 8), spot OANDA:XAUUSD recovered in the short term after a sharp decline in the previous trading day. Gold prices just touched $3,000/ounce, having increased by nearly $20 during the day. Concerns about the escalation of the trade war have increased the risk-off sentiment in the market.
US President Donald Trump said on Monday that he will not suspend the policy of "reciprocal tariffs", although many trading partners want to avoid them
According to a statement posted on the website of the Chinese Ministry of Commerce on Tuesday, a spokesperson for the Ministry of Commerce made a statement on the US threat to increase tariffs on China. The statement pointed out that China noted that on April 7 Eastern time, the US threatened to impose an additional 50% tariff on China, and China firmly opposes this. If the US escalates the tariff measures, China will resolutely take countermeasures to protect its own rights and interests.
The US threat to increase tariffs on China is a mistake that has been compounded, once again exposing the US's blackmailing nature. China will never accept this. If the US insists on pursuing its own way, China will fight to the end. Such statements usually boost the market's risk-off sentiment, contributing to a short-term recovery in gold prices. Gold is a safe investment during times of political and financial uncertainty.
Last Thursday, gold hit an all-time high of $3,167.57/oz, driven largely by geopolitical uncertainty and strong central bank buying. And the gold market remains exposed to significant volatility in the short term, with a number of potential fundamental surprises, most of which are likely to support price gains.
Technical Outlook Analysis OANDA:XAUUSD
On the daily chart, gold is struggling to maintain its price action within the main price channel, however, the recovery momentum is also limited by the $3,000 price level which is currently acting as the nearest resistance.
For now, gold is losing important support at the EMA21 and now the EMA21 has become a resistance level. For gold to have the conditions for a bullish possibility, gold needs to bring the price action back above the $3,000 level, then the target is $3,019 and maintain above this level.
The relative strength index RSI has some minor reaction at 50, which is considered a momentum support level on the RSI tool. But the signal is not significant.
Overall, the expectation for gold is to resume the uptrend but at the time of writing, the conditions are not yet sufficient. Meanwhile, a drop below $2,956 would bring the risk of further declines with the next target around $2,927 in the short term.
In the day, the notable technical positions will be listed as follows.
Support: $2,956 – $2,954 – $2,927
Resistance: $3,019
SELL XAUUSD PRICE 3064 - 3062⚡️
↠↠ Stoploss 3068
→Take Profit 1 3056
↨
→Take Profit 2 3050
BUY XAUUSD PRICE 2932 - 2934⚡️
↠↠ Stoploss 2928
→Take Profit 1 2930
↨
→Take Profit 2 2936

XAUUSD Analysis: Reversal Forecasts Based on Trading MathDear Trader,
Please find attached my analysis of $Subject, which uses mathematical calculations to identify potential reversal times and price levels.
The analysis details projected south and north price targets (horizontal lines on the chart), along with estimated time frames for possible reversals (vertical lines on the chart, accurate to within +/- 1-2 candles). Please note that all times indicated on the chart, including the vertical lines representing potential reversal times, are based on the UTC+4 time zone.
To increase the probability of these analyses, I recommend monitoring the 5-minute and 15-minute charts for the following key reversal candlestick patterns:
Doji’s
Hammer/Inverted Hammer
Double/Triple Bottom/Top
Shooting Star
Morning Star
Hanging Man
For those interested in further developing their trading skills based on these types of analyses, consider exploring the mentoring program offered by Shunya Trade.
I welcome your feedback on this analysis, as it will inform and enhance my future work.
Regards,
Shunya Trade
Our Math Analysis as below are Gold Levels:-
3018.720095 - 2991.311155
3032.47144 - 2977.65356
3060.06788 - 2950.43212
3087.78932 - 2923.33568
3115.635761 - 2896.364239
3143.607201 - 2869.517799
3171.703641 - 2842.796359
3199.925081 - 2816.199919
3228.271521 - 2789.728479
3342.907282 - 2685.092718
3459.543042 - 2582.456958
3578.178803 - 2481.821197
3698.814564 - 2383.185436
3821.450324 - 2286.549676
3946.086085 - 2191.913915
4072.721845 - 2099.278155
4201.357606 - 2008.642394
⚠️ Disclaimer: This post is educational content and does not constitute investment advice, financial advice, or trading recommendations. The views expressed here are based on technical analysis and are shared solely for informational purposes. The stock market is subject to risks, including capital loss, and readers should exercise due diligence before investing. We do not take responsibility for decisions made based on this content. Consult a certified financial advisor for personalized guidance.

Party's OverDow Futures daily forming a downwards channel with price targets potentially down to 34k and 31k. These drops would be about 20-40% which is considered a true market crash. The falling wedge pattern plays out until potentially June of 2027, but wedges from the top of the range are dangerous as they can turn into bull traps.
- Economic fundamentals have been disconnected from the financial system for some time but as the underlying economy begins to falter (ex. unemployment wave) markets begin to price in data such as falling retail sales.
- President Trump is going through with mass layoffs in the Federal Government which creates unemployment as the private sector has been going through layoffs and has halted actual new hiring since 2023.
- As more traders have become accustomed to "bad news is good news," they will most likely be wiped out trying to buy dips or chase false breakouts doing what they have always done.
- Tariffs regionalize trade which make global economies and supply chains less interconnected. A global economy that is also very levered up on USD denominated debt needs dollar liquidity to continue to function. By regionalizing trade that liquidity is starved which can lead to financial problems on a global scale if not handled carefully.
- Markets are likely to price in these risks over the next 2-3 months leading asset prices and interest rates lower. Expect individual companies to do well at times but then rotate to others while the Dow index itself falls.
- Even if the Dow were to play out the wedge during 2026, without significant improvements to the global financial system expect that move to be a bull trap or a best lead to minimal gains without a new wave of monetary inflation.

ES where?📉 ES1! - S&P 500 E-mini Futures (Daily)
We’re approaching a critical point on the long-term trendline.
🟠 Price has bounced sharply after a steep pullback, reacting right at the dynamic support that’s held since the 2022 lows.
🟢 Two possible scenarios:
Bullish Continuation: support holds, the index regains momentum and pushes back toward the highs.
Bearish Breakdown: trendline breaks, signaling a potential structural shift with downside targets possibly below 4000.
📊 Momentum indicator is in extreme territory → wait for confirmation, don’t anticipate.

NQ volatility likely to persist until retest of 13k buy zonechart shows it all...expect more volatility this month, likely a retest of 61.8 fib level at 15k & 78.6 fib levels (based on lows from 2023) near 13k before we finally run to the highs again into 2026!
tariffs have similar impact as rate hikes...overall will be digested by markets just fine & we'll head back to the highs as fed sees more freedom to cut given those effects...very incentivized to prevent a "hard landing" economically without also boosting inflation too much, so this is all actually a good thing if you can see it :)

GOLD dropped dramatically then recovered in the short termOANDA:XAUUSD saw a short-term spike during the Asian trading session on Monday (April 7). The price of gold recovered to reach around $3,053/ounce, up $83 from the intraday low of $2,970.47/ounce reached earlier.
OANDA:XAUUSD fell sharply after the Asian open on Monday, with gold also falling sharply as equity markets suffered a sharp sell-off.
While gold typically benefits from periods of volatility, it is more prone to sell-offs during periods of high volatility, with investors likely to sell gold to cover losses elsewhere.
The stock market sell-off has prompted investors to cover their losses. However, rising trade wars and geopolitical risks could boost safe-haven demand, supporting gold prices.
Trump Makes Shocking Claim About Stock Market Crash: "Sometimes You Have to Take Medicine"
When asked about the stock market crash, US President Trump said on Sunday local time, "Sometimes you have to take medicine."
After plunging on Thursday and Friday last week, global stock markets continued to fall on Monday, creating the worst three-day losing streak in history.
“I don’t want anything to happen, but sometimes you have to take medicine to solve the problem,” Trump told reporters on Air Force One, speaking about the economic impact of his sweeping tariffs.
“I can’t tell you what’s going to happen in the markets,” Trump said. “But our country is stronger.” According to Reuters, Trump gave no indication that he would abandon the tariff plan during his speech.
Trump also said he did not intentionally orchestrate the market sell-off. “No, it wasn’t that,” he said.
Last Friday, Trump reposted a video on his social media platform in response to the stock market crash. The video opens with the assertion: “Trump is causing the stock market crash… but he’s doing it on purpose.” Trump’s “No, he’s not” comment came hours after his economic advisers said in a Sunday television interview that the market should not expect to be rescued from the tariff-driven sell-off.
The Stock Market as well as the Gold Market are now directly piloted by Captain Trump, so keeping an eye on Trump is essential for any trader.
One comment can also break all the technical structures, and we cannot trade the market without knowing what is happening in the market. The market is 50%, the rest is now Trump and a part of the FED along with trade and geopolitical developments.
Technical Outlook Analysis OANDA:XAUUSD
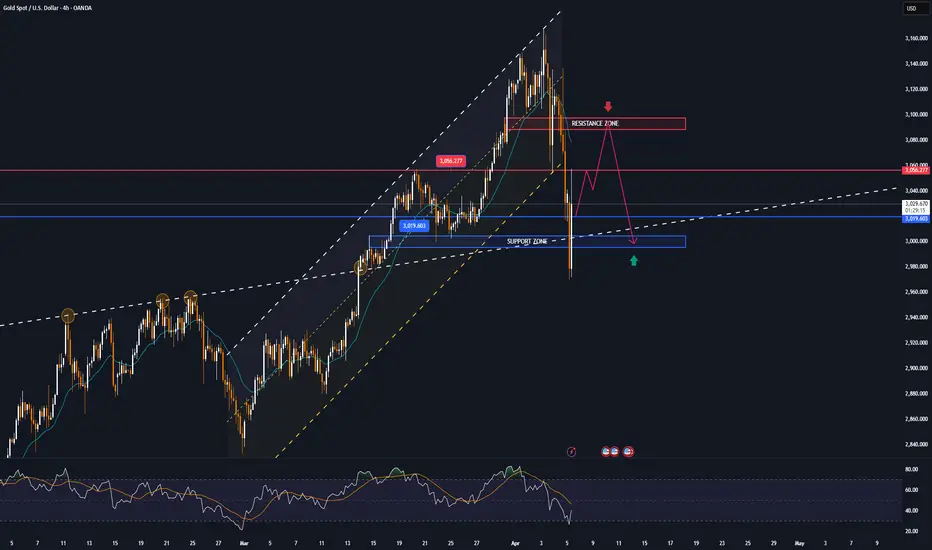
On the daily chart, after the gold price fell, it received support from the lower edge of the price channel, an important position of the current main uptrend.
And the recovery brought the gold price back above the EMA21 level, however, the upside momentum is also limited by the technical level of 3,056USD, pay attention to readers in the weekly publication.
In terms of momentum, the Relative Strength Index RSI approached the level of 50, which is considered a support position for the RSI and the RSI bending upwards will be considered a positive signal for the bullish recovery momentum.
During the day, the technical uptrend of the gold price is still dominant with the price channel as the main trend and the notable positions will be listed as follows.
Support: 3,019 - 3,000 - around the lower edge of the channel
Resistance: 3,056USD
SELL XAUUSD PRICE 3093 - 3091⚡️
↠↠ Stoploss 3097
→Take Profit 1 3085
↨
→Take Profit 2 3079
BUY XAUUSD PRICE 3001 - 3003⚡️
↠↠ Stoploss 2997
→Take Profit 1 3009
↨
→Take Profit 2 3015