#GBPUSD Sell Seup🔽#GBPUSD Sell Setup
Currently Trading At 1.26119 , Sell On Rise In The Range 1.26548—1.27104 For The Target 1.24310—1.22200
Gann

USDCHF short term potential buy USDCHF potential buy since it failed to go below further below again , we might see a short term buy due to the fact that its also stuck in between support and resistance zones .

OTE MODELSo, this is the second play after the first play, in previous pos, the goal was achieved,
a quick recap - a 15 min play into an OTE zone on the 15m TF, you can see that in the current video
now after that move, as seen in the video i am hoping that price would continue it move upwards into the OTE zone for the higher TF which is the 4h and the 1h
now we wait and see how price react on London open tomorrow God willing

GOLD CORRECTION GAPS- ALERTHi Guys,
As ATH been hit, time for price correction and claim of revenue.
I have some concerns of the prices, as the Monthly charts shows, the indicator need to touch bases to the EMA8 indicator, yet 2 gaps shows up clearly in the monthly chart, ranges around 2600$ area, and the worst case scenario , back hitting support lvl at 2200$ , lets see how it goes.

NIKKEI FULL-TRADEABLE SETUPS
1. Short-Term Trader (Intraday to Multi-Day)
A) Primary (Bias-Aligned) Setup
• Rationale:
Aligns with the broader uptrend and the ongoing range support near 38,900–39,000 on lower timeframes. Looks for a short-term rally if price reclaims local resistance.
• Execution Parameters:
• Entry Trigger:
• Await a 1H candle close above ~39,300 (near local lower-high pivot).
• Look for an uptick in volume or a bullish engulfing bar on the 1H chart confirming momentum.
• Stop-Loss Placement:
• Under 39,000, just below the bullish order block / recent intraday support.
• Take-Profit Levels:
• TP1: ~39,500 (immediate overhead supply).
• TP2: ~39,700–39,800 (previous swing highs).
• Risk Management:
• Position size to risk 1–2% of trading capital, with an approximate 1:2 or 1:3 R:R ratio depending on final entry fill.
B) Alternate (Contrary) Setup
• Rationale:
Activates if the support region (38,900–39,000) fails, flipping short-term bias to downside momentum.
• Execution Parameters:
• Alternate Entry Trigger:
• Break and 1H close below 38,900, confirming invalidation of the bullish order block.
• Any retest that fails to reclaim 39,000 becomes a secondary entry.
• Stop-Loss Placement:
• Just above 39,100 to cover a potential reclaim attempt.
• Take-Profit Levels:
• TP1: ~38,600 (recent minor support).
• TP2: ~38,200 or deeper if intraday selling accelerates.
• Risk Management:
• Adjust position size for volatility around a breakdown; aim for a 1:2 R:R or better.
2. Swing Trader (Multi-Week)
A) Primary (Bias-Aligned) Setup
• Rationale:
Builds on the daily chart’s bullish structure near 38k support, looking for a potential run toward the 40k–41k resistance region.
• Execution Parameters:
• Entry Trigger:
• Daily close above ~39,500 with sustained volume, suggesting an attempt at the next resistance band (40k+).
• Bullish crossover on daily MACD or RSI crossing above ~55 can reinforce the entry.
• Stop-Loss Placement:
• Beneath 38,500 on a daily closing basis, below the recent consolidation floor to allow for volatility.
• Take-Profit Levels:
• TP1: ~40,000–40,200 (major daily supply zone).
• TP2: ~41,000 (upper band of daily range).
• Risk Management:
• Aim for a moderate position size, seeking a 1:2 or 1:3 R:R. Consider partial profit at TP1 and trailing stops thereafter.
B) Alternate (Contrary) Setup
• Rationale:
Triggered if daily price closes convincingly under 38k support, negating the bullish mid-range bias and opening downside toward deeper weekly support.
• Execution Parameters:
• Alternate Entry Trigger:
• Daily close below ~38,000, plus follow-through selling on the next session.
• This invalidates the bullish structure, suggesting a larger correction could unfold.
• Stop-Loss Placement:
• Above 38,800 on a daily closing basis, covering a possible reclaim of the broken support.
• Take-Profit Levels:
• TP1: ~37,000 (prior daily pivot and potential institutional demand).
• TP2: ~36,000 or lower if the weekly chart’s deeper support is tested.
• Risk Management:
• Use swing-sized position. Target a 1:2 R:R minimum, reducing or trailing stops near key fib or structural supports.
3. Macro Trader (Multi-Month to Longer-Term)
A) Primary (Bias-Aligned) Setup
• Rationale:
Leverages the long-term uptrend visible on the weekly chart, anticipating that consolidation near ~38k–39k eventually resolves to the upside toward prior highs (~42k).
• Execution Parameters:
• Entry Trigger:
• Weekly close above 40k, demonstrating a clear breakout from the consolidation range.
• Confirmation via weekly momentum indicators turning bullish (e.g., weekly MACD crossing positive).
• Stop-Loss Placement:
• Under 36k on a weekly closing basis, below major prior structure and the 100/200-week MAs.
• Take-Profit Levels:
• TP1: ~42,000–43,000 (historic weekly resistance).
• TP2: Potential extension beyond 45k if the bull trend accelerates.
• Risk Management:
• Lower leverage or a smaller position. Potentially add on retests of the breakout zone. Seek a 1:3 or better R:R over a longer horizon.
B) Alternate (Contrary) Setup
• Rationale:
Engaged if price fails at the top of the range and breaks down significantly below the multi-year trendline or major weekly support.
• Execution Parameters:
• Alternate Entry Trigger:
• Weekly close below 35,500–36,000, confirming the breakdown of the bullish structure from a macro standpoint.
• Negative slope on weekly MAs or a strongly negative MACD cross might reinforce the short bias.
• Stop-Loss Placement:
• Above ~37,500 on a weekly closing basis, allowing some volatility above the broken support region.
• Take-Profit Levels:
• TP1: ~32,000–33,000 (major prior pivot / weekly volume node).
• TP2: ~30,000 or lower if a full cyclical retrace unfolds.
• Risk Management:
• Employ conservative position sizing given the longer timescale. Aim for a balanced risk-reward approach, partial profit around TP1, and trailing stop for the remainder.
Summary of the Dual-Scenario Approach
• Primary Setups in each category lean bullish, reflecting the broader uptrend and stable support around 38k–39k.
• Alternate (Contrary) Setups engage only if key supports break or resistance strongly rejects price, confirming a structural shift.
This dual approach covers both sides of the market, ensuring readiness for continued consolidation/breakout to the upside or a sudden downside invalidation of the current range.

ETHBTCLooking ready to catch many off Guard
Stay woke dont get shaken out be patient 5-6 months Diamond hands
Either it works or it doesn't

NIKKEI SWING SET UPS
## SWING-TRADING (MULTI-WEEK) NIKKEI SETUP
### Overall Context
- **Market Sentiment & Positioning**: Institutional flows remain cautiously optimistic, with elevated hedging but steady inflows into key equity segments. The broader late-cycle expansion continues, while inflation shows signs of moderating.
- **Monetary Policy & Macro Factors**: Central banks globally are shifting toward accommodative policies, generally supporting equities. However, pockets of economic slowdown or negative surprises in data releases can quickly alter sentiment.
- **Technical Structure**: On the daily timeframe, the Nikkei has been building a bullish structure near the 38k zone, suggesting that dips into this area are often bought. Price attempts to push toward the 40k–41k region align with prior swing highs, forming a natural upside target for swing traders.
---
### A. PRIMARY (BULLISH) SWING SETUP
1. **Rationale**
- Seeks to capitalize on the Nikkei’s ongoing daily uptrend, with price consolidating above 38k.
- The daily momentum indicators and supportive macro environment suggest that further upside is possible if the index breaks its near-term resistance.
2. **Execution Parameters**
- **Entry Trigger**:
- Look for a daily close above ~39,500 on strong volume, indicating a renewed push toward the 40k region.
- A bullish crossover in technical indicators (e.g., MACD, RSI above ~55) can provide additional confirmation.
- **Stop-Loss Placement**:
- Below ~38,500 on a daily closing basis, allowing room for typical market volatility while protecting against a deeper breakdown.
- **Take-Profit Levels**:
1. **First Target**: Approximately 40,000–40,200, a significant daily resistance zone and psychological round number.
2. **Second Target**: Around 41,000, aligning with higher-end resistance if bullish momentum persists.
- **Risk Management**:
- Maintain a 1–2% account risk per trade. Position sizing should factor in the distance to your stop.
- Upon reaching the first target, consider partial profit-taking and moving the stop-loss to break-even.
3. **Supporting Factors**
- **Institutional Flows**: Large funds often continue buying dips in a stable macro environment, providing a cushion under prices.
- **Liquidity & Rates**: The supportive, lower-rate backdrop can encourage investors to hold equities longer, favoring sustained uptrends.
---
### B. ALTERNATE (BEARISH) SWING SETUP
1. **Rationale**
- Becomes actionable if the daily close undercuts ~38,000, suggesting the potential for a more pronounced corrective phase.
- Negative macro catalysts or a notable shift in risk sentiment could accelerate selling and undermine the current range-bound bullish bias.
2. **Execution Parameters**
- **Entry Trigger**:
- A daily close below ~38,000, followed by a second day of downside confirmation or inability to regain that level.
- **Stop-Loss Placement**:
- Above ~38,800 on a daily closing basis, invalidating the bearish scenario if price reclaims the broken support.
- **Take-Profit Levels**:
1. **First Target**: Near 37,000, which historically has acted as a pivot/demand area on the daily chart.
2. **Second Target**: Around 36,000, if downside momentum accelerates.
- **Risk Management**:
- Maintain a 1–2% risk allocation.
- Consider partial profit at the first target and tighten stops if the market heads lower in a sustained fashion.
3. **Supporting Factors**
- **Macro & Policy Shifts**: A sudden spike in inflation, unexpected central bank hawkishness, or severe economic data misses can quickly unwind bullish positions.
- **Institutional Hedging Unwind**: If selling pressure builds, existing hedges may intensify the move lower as positions are adjusted or closed out.
---
## KEY RISK MANAGEMENT NOTES
- **Data & Catalysts**: Swing traders should be mindful of earnings seasons, central bank announcements, and major geopolitical developments that can cause multi-day moves or gaps.
- **Trend Confirmation & Timely Exits**: Use daily closes (as opposed to intraday fluctuations) to confirm breakouts or breakdowns. Partial profit-taking at predefined levels and trailing stops on the remaining position help lock in gains while allowing participation in extended runs.
- **Sizing & Leverage**: With multi-day to multi-week holding periods, ensure that margin usage and stop placements accommodate overnight and weekend risk.
---
### CONCLUSION
For swing traders in the Nikkei, the **primary** approach aims to ride the prevailing daily uptrend toward the 40k–41k region, while the **alternate** scenario provides a structured plan if price breaks below ~38,000, indicating a deeper pullback. By integrating broader institutional positioning and macroeconomic indicators into a technical framework, traders can position themselves for potential multi-week opportunities while maintaining a disciplined risk posture.

"Gann’s Secrets: Time Cycles, Square of 9 & Market Reversals"Gann’s Trading Secrets | Gann Time Cycles, Gann Square of 9, and Predicting Market Reversals
📌 Topics Covered in This Video:
- The Power of Gann 90 in Market Cycles
- Gann Time Cycles & Gann Market Timing
- Gann Fibonacci levels & Gann Price Levels
- Gann Fan & The Billion-Dollar Trade
- Gann Square of 9 & Price Movements
- The 90-Year Gann Market Cycle & Financial Crises
- How to Use Gann’s Methods in Modern Trading
📌 Why You Should Watch This Video:
- Learn how to forecast market tops and bottoms using W.D. Gann’s techniques.
- Understand how Gann time cycles and Gann price action align in market movements.
- See real-world examples of how Gann’s methods predicted historical market crashes and reversals.
- Discover how major traders, including George Soros, unknowingly used Gann's principles to execute billion-dollar trades.
📌 Timestamps: Gann’s Trading Secrets | Gann Time Cycles, Square of 9, and Predicting Market Reversals
00:00 ▶️ Introduction
00:43 ▶️ W.D.Gann
01:35 ▶️ His Contribution to Technical Analysis
02:19 ▶️ Core Principals
04:13 ▶️ Price and Market Cycles
04:52 ▶️ What is Swing Chart?
06:32 ▶️ Gann Square of 9
07:12 ▶️ Gann's Relentless Study of Markets
07:37 ▶️ The Role of Astrology in Market Cycle
08:13 ▶️ Key Natural Market Turning Points
09:12 ▶️ Gann's 50% Rule
09:58 ▶️ The Three Key factors in Gann Trading
10:13 ▶️ The Price
14:07 ▶️ Gann Fan
14:43 ▶️ The Core Concept of Time-Price Balance
19:02 ▶️ The Role of Geometry in Gann's Work
19:41 ▶️ The Power of the Number 3
24:37 ▶️ The 90-Time Cycle in the Market
27:40 ▶️ Famous Trader George Soros
29:52 ▶️ Historical Economic Depression
30:35 ▶️ 2019 as a Key Time Cycle
31:10 ▶️ Economic Conditions

$OM: $50B MCAP InevitableThe next wave?
TOKENIZATION
Even Robinhood’s CEO sees it! Larry Fink is bullish
$NASDAQ:OMUSDT going to reach 50B Mcap minimum, gonna revisit this post — MARK IT!

CADJPY H2 IdeaPotential for a bearish pullback on the CADJPY H2 which could lead to a price movement towards the support level at 106

ABOUT GBPJPYMy option about gbpyjpy Is more bearish so that zone is good and strong restanice if the price comes to that zone it can pullback

Most Important EthUSDT Chart you need to see.Hello Dear,
The Gann chart, attributed to the legendary trader W.D. Gann, is a powerful tool for predicting price levels and time cycles. While it may seem complex initially, mastering its principles can give traders a significant edge. This article will break down the basics of the Gann chart and provide you with actionable tricks to incorporate it into your trading strategy.
What is a Gann Chart?
A Gann chart combines price and time to identify key levels of support, resistance, and potential trend changes. Gann's theory is based on the concept that price and time move harmoniously. By plotting geometric angles and price levels on the chart, traders can identify critical points where the market is likely to react.
The chart shown here overlays key angles and levels, such as:
0° (Base Level): Starting point for calculations.
90°, 180°, 270°, and 360°: Significant price levels derived from Gann’s geometric principles.
These levels serve as both support and resistance zones, depending on the market trend.
📊 Interpreting the Chart
1️⃣ Key Levels to Watch
🔹 Support Zones:
$2,596 – First strong support level.
$2,346 – If the price drops further, expect buyers here.
$2,117 – A major demand zone. If ETH reaches this level, expect a strong reaction.
🔹 Resistance Zones:
$2,858 – Current price level; breaking above could push ETH higher.
$3,128 – Next key resistance level; breaking this confirms a bullish trend.
$3,415 - $3,713 – Strong resistance area; ETH needs momentum to break through.
$4,024 - $4,345 – If the rally continues, these are the next upside targets.
⏳ Time Cycles & Trend Shifts
The chart also shows Gann time cycles (vertical lines), which help predict possible trend shifts. Based on the setup:
🔸 ETH has recently bounced from a key support level, suggesting a possible trend reversal.
🔸 If ETH maintains momentum, we could see a push toward $3,128 soon.
🔸 However, if it fails to hold above $2,596, it might revisit lower support zones.
📈 How to Trade This Setup?
✅ Bullish Scenario:
If ETH breaks above $2,858, look for a move toward $3,128 - $3,415.
A breakout above $3,713 could trigger a strong rally toward $4,024+.
❌ Bearish Scenario:
If ETH fails to hold $2,596, expect a drop toward $2,346 or even $2,117.
Losing $2,117 could open the door for deeper correction.
🔎 Final Thoughts
Ethereum is at a crucial decision point. If bulls can break above $2,858, we might see an exciting rally. But if ETH struggles, lower support levels could come into play.
What do you think? Bullish or Bearish? Let’s discuss! 🔥👇

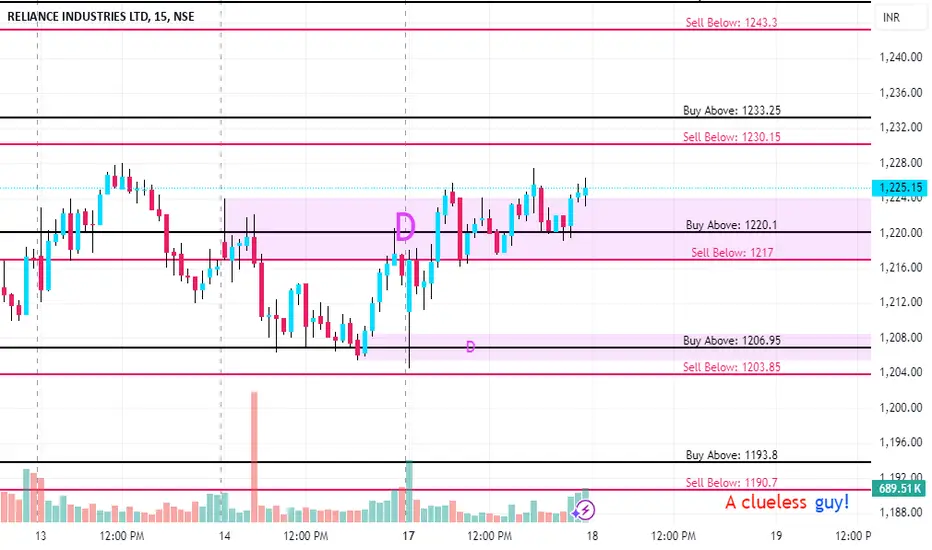
MARUTI KEY LEVELS FOR 18/02/2025//description
// All credit goes to Tony for the concept of this indicator. His Trading View link: www.tradingview.com
// Note: The calculation method in this indicator differs from Tony's, but the concept is derived from his work.
I want to make it clear that I am not a seller, and this method was not taught to me by anyone. The original creator only gave me one clue:
👉 "If you get one level, you get all levels."
Everything else—the way I nail it the method and applied it—is my own work. I respect the original idea, but my approach is independent.
Explanation:
This trading system helps you avoid blind trades by providing confirmation for better entries and exits.
Entry/Exit Points:
- Entry/Exit Lines: Use the BLACK line for long trades and the RED line for short trades, based on confirmation from your trading plan.
- Stop Loss: For long trades, set the stop loss at the RED line below. For short trades, set it at the BLACK line above.
- Take Profit: For long trades, target the next RED line above. For short trades, target the next BLACK line below.
Timeframe:
Use a 5 mins timeframe for trading.
Risk Disclaimer:
This setup is for educational purposes. I'm not responsible for your gains or losses. Check the chart for more details.

KEY LEVELS FOR 18/02/2025//description
// All credit goes to Tony for the concept of this indicator. His Trading View link: www.tradingview.com
// Note: The calculation method in this indicator differs from Tony's, but the concept is derived from his work.
I want to make it clear that I am not a seller, and this method was not taught to me by anyone. The original creator only gave me one clue:
👉 "If you get one level, you get all levels."
Everything else—the way I nail it the method and applied it—is my own work. I respect the original idea, but my approach is independent.
Explanation:
This trading system helps you avoid blind trades by providing confirmation for better entries and exits.
Entry/Exit Points:
- Entry/Exit Lines: Use the BLACK line for long trades and the RED line for short trades, based on confirmation from your trading plan.
- Stop Loss: For long trades, set the stop loss at the RED line below. For short trades, set it at the BLACK line above.
- Take Profit: For long trades, target the next RED line above. For short trades, target the next BLACK line below.
Timeframe:
Use a 5 mins timeframe for trading.
Risk Disclaimer:
This setup is for educational purposes. I'm not responsible for your gains or losses. Check the chart for more details.
ADANIENT KEY LEVELS FOR 18/02/2025//description
// All credit goes to Tony for the concept of this indicator. His Trading View link: www.tradingview.com
// Note: The calculation method in this indicator differs from Tony's, but the concept is derived from his work.
I want to make it clear that I am not a seller, and this method was not taught to me by anyone. The original creator only gave me one clue:
👉 "If you get one level, you get all levels."
Everything else—the way I nail it the method and applied it—is my own work. I respect the original idea, but my approach is independent.
Explanation:
This trading system helps you avoid blind trades by providing confirmation for better entries and exits.
Entry/Exit Points:
- Entry/Exit Lines: Use the BLACK line for long trades and the RED line for short trades, based on confirmation from your trading plan.
- Stop Loss: For long trades, set the stop loss at the RED line below. For short trades, set it at the BLACK line above.
- Take Profit: For long trades, target the next RED line above. For short trades, target the next BLACK line below.
Timeframe:
Use a 5 mins timeframe for trading.
Risk Disclaimer:
This setup is for educational purposes. I'm not responsible for your gains or losses. Check the chart for more details.

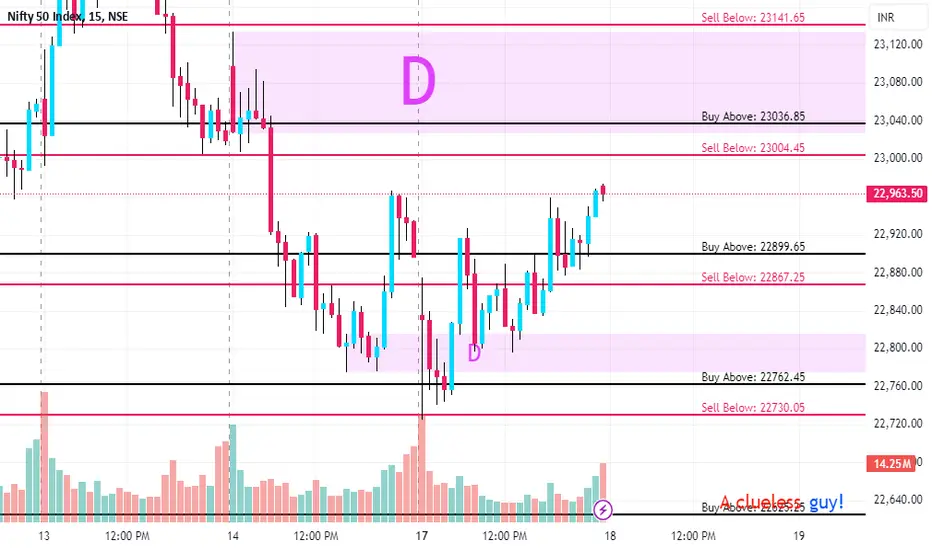
NIFTY 50 KEY LEVELS FOR 18/02/2025//description
// All credit goes to Tony for the concept of this indicator. His Trading View link: www.tradingview.com
// Note: The calculation method in this indicator differs from Tony's, but the concept is derived from his work.
I want to make it clear that I am not a seller, and this method was not taught to me by anyone. The original creator only gave me one clue:
👉 "If you get one level, you get all levels."
Everything else—the way I nail it the method and applied it—is my own work. I respect the original idea, but my approach is independent.
Explanation:
This trading system helps you avoid blind trades by providing confirmation for better entries and exits.
Entry/Exit Points:
- Entry/Exit Lines: Use the BLACK line for long trades and the RED line for short trades, based on confirmation from your trading plan.
- Stop Loss: For long trades, set the stop loss at the RED line below. For short trades, set it at the BLACK line above.
- Take Profit: For long trades, target the next RED line above. For short trades, target the next BLACK line below.
Timeframe:
Use a 5 mins timeframe for trading.
Risk Disclaimer:
This setup is for educational purposes. I'm not responsible for your gains or losses. Check the chart for more details.
Bitcoin (BTC/USDT) Gann AnalysisHello dear traders,
Bitcoin where to?
📌 Current Market Status:
BTC is trading at $96,480, up +9.43% from the previous move.
The price is currently near the 180° Gann level at $95,316, acting as an important pivot zone.
Key Support & Resistance Levels (Based on Gann Grid):
🟢 Support Levels:
1️⃣ $95,316 (180° Gann Level) → If held, BTC may consolidate before another move up.
2️⃣ $92,266 (90° Gann Level) → Strong demand area; loss of this level may trigger a deeper correction.
3️⃣ $89,285 (0° Gann Level) → The lowest major support, likely to provide a strong bounce if reached.
🔴 Resistance Levels:
1️⃣ $98,434 (270° Gann Level) → Immediate resistance; breaking above it could fuel bullish momentum.
2️⃣ $101,621 (360° Gann Level) → Major resistance; BTC needs to flip this level to confirm an uptrend continuation.
3️⃣ $108,097 (540° Gann Level) → If BTC pushes through, it could target new highs around $114,745.
Market Outlook & Potential Scenarios:
✅ Bullish Scenario:
Holding above $95,316 could lead to a push towards $98,434 and $101,621.
A breakout above $101,621 might confirm a move towards $108,097.
❌ Bearish Scenario:
If BTC loses $95,316, we may see a drop toward $92,266.
Losing $92,266 could trigger a retest of the $89,285 support.
🚀 Final Thoughts:
BTC is currently at a crucial decision point! A breakout above $98,434 could lead to a strong bullish continuation, while a breakdown below $95,316 may bring more downside pressure.
What do you think? Will BTC push higher or correct down? 🤔

EUR/USD Scalping Opportunity: Potential Long SetupEUR/USD exhibits a potential upside move, presenting a scalping opportunity for long positions. Confirmation is required, along with a rejection of the current zone, to validate the trade setup before execution.
Disclaimer: This analysis is for informational purposes only and does not constitute financial advice. Scalping and trading carry substantial risks, including the possibility of significant losses. Trade cautiously and responsibly.

DXY IndexDXY Index
Symmetrical Triangle as an Corrective Pattern in Short Time Frame
Completed " 12345 " Impulsive Waves
Break of Structure
Bearish Channel as an Corrective Pattern in Short Time Frame

Major (USDT) – Gann Levels Analysis & Possible ScenariosHello dear traders,
you deserve an update to the previous chart here
Update:
The pair is currently trading around $0.1931, consolidating within a range-bound structure after a sharp downtrend. The price is hovering near the 540° Gann level ($0.1972) and 570° Gann level ($0.1532), forming a potential accumulation zone.
This setup suggests that the market is in a decision phase, awaiting a catalyst to either break out or continue the downward momentum. Let’s analyze the key Gann levels and what they indicate.
📈 Key Gann Levels & Their Implications:
🔹 Immediate Resistance:
540° – $0.1972: A critical level that price is currently testing. A breakout above it may confirm bullish momentum.
510° – $0.2468: If price reclaims this level, we could see a trend reversal toward higher targets.
🔹 Major Resistance Levels:
480° – $0.3020: A strong historical resistance zone, breaking above this may trigger a larger rally.
450° – $0.3624: Psychological resistance; clearing this level could confirm a medium-term uptrend.
🔹 Immediate Support:
570° – $0.1532: A crucial demand zone where buyers previously stepped in. Holding above it could prevent further decline.
600° – $0.1147: A break below $0.1532 may bring this level into focus.
🔹 Final Support Zone:
630° – $0.0818: This would be a major breakdown level if bearish momentum accelerates.
🚀 Potential Market Scenarios:
🟢 Bullish Case:
If price breaks and holds above $0.1972 (540° Gann level), it could trigger a move toward $0.2471 (510° level).
A confirmed breakout above $0.3020 (480° level) may accelerate a bullish trend towards $0.3624 and beyond.
This scenario would likely require increased buying volume and a broader market recovery.
🔴 Bearish Case:
Failure to hold $0.1972 could push price back to $0.1532 (570° Gann level), where buyers may attempt to stabilize.
A break below $0.1532 could lead to further downside towards $0.1147 (600° level).
If selling pressure persists, $0.0818 (630° level) would be a worst-case scenario, marking a deep decline.
⚠️ Key Takeaways:
📍 Price is stuck in consolidation, testing a critical decision level ($0.1972).
📍 Bulls need to reclaim $0.2468+ to confirm an uptrend.
📍 Bears will dominate if price loses $0.1532, risking further decline.
💬 What’s your outlook? Do you expect a breakout or another leg down? Drop your thoughts below! 🔥
#Crypto #USDT #GannAnalysis #Trading #TechnicalAnalysis 🚀

Elm (TADAWUL: 7203) – Key Gann Levels in Play!Elm has been on a rollercoaster ride, experiencing a strong uptrend before hitting resistance and pulling back. The stock is now trading around 1,059 SAR, testing a key 360° Gann level at 1,015 SAR. So, what’s next? Let’s dive in!
Could be the scenario ;)
🔍 Technical Breakdown:
🔹 Resistance Levels:
1,181 SAR (405° Gann level) – A key zone that previously acted as resistance.
1,359 SAR (450° Gann level) – Breaking above this could restart the bullish trend.
🔹 Support Zones:
1,015 SAR (360° Gann level) – Crucial support currently being tested. A hold here could trigger a bounce.
862 SAR (315° Gann level) – Next potential support if selling pressure continues.
🔹 Trend Analysis:
The stock had a massive bull run before topping out and now seems to be in a correction phase.
If bulls defend 1,015 SAR, we might see another upside attempt.
🎯 Potential Scenarios:
🟢 Bullish Case:
Holding 1,015 SAR could lead to a retest of 1,181 SAR and, if momentum continues, a push towards 1,359 SAR.
🔴 Bearish Case:
A break below 1,015 SAR could signal further downside towards 862 SAR and possibly lower.
⚠️ Key Takeaway:
Elm is at a make-or-break level! Will bulls step in at 1,015 SAR, or is more downside ahead?
💬 What’s your outlook? Share your thoughts in the comments! 🔽🔥
#Elm #TADAWUL #StockMarket #GannAnalysis #TechnicalAnalysis

BTC PRICE ACTION 1Q - with Gann FannSo this is my BTC chart, 1 Quarter every candle.
I use the Gann Fann forcheking where are we now and why it is hard to push above the 100k$ and stay above.
So we are cureently in the positive trend, keep grinding higer, in the 1/1-2/1 are of the fann, which is positive.
We could see that every time we tried to cross into the quciker area of 2/1-3/1 of the fann, we were rejected as for that the asset CRYPTOCAP:BTC needs more energy and buyers for that.
So we keep go upward in the trend, and once the big guys will ready they will start push it higher and faster.
This is where i lean to the cross to the next Fann area.
This may be followed by the RSI that will climb and may find some resistence in the trend line.
Having said that,I find the area of 150K$ as the next key level and if we will see Mega Fomo in the crypto we may cross to the 1/3-1/4 area which will bring also oversold areas and we may break the RSI trend line.
Historically BTC may find a top once the 1M chart RSI is around the 90+-
There is long way to go there.
Hope you like my content., you are welcome to share.
NFA
DYOR

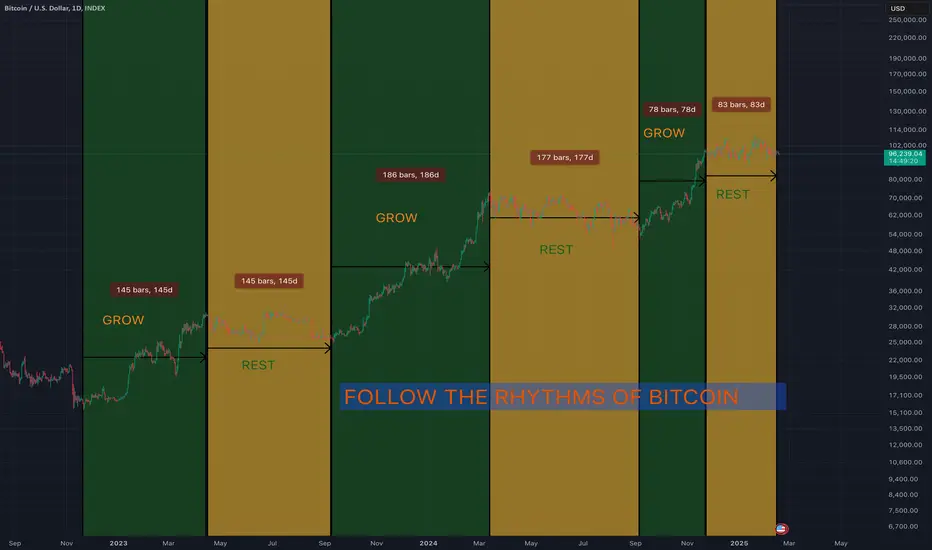
Follow the Rhythms of Bitcoin!The chart is alive! This bull cycle, maybe it's the ETF, has been all about this rise and rest rhythm. Pattern recognition is what we need to have as honest analysts.