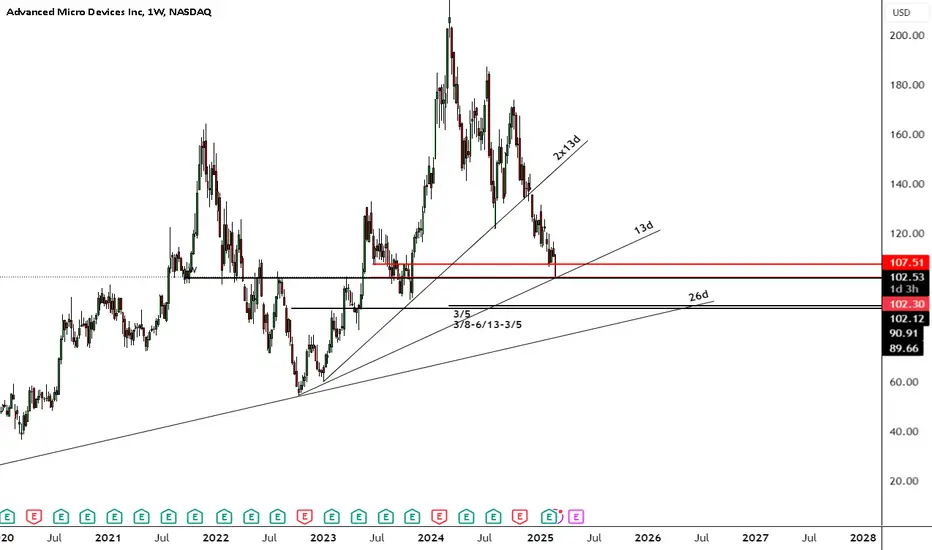
AMD LONG OpportunityIn the past, Gann angles with a daily base of 13 have identified a significant low.
Today, we have touched the 1x13 daily. A sign of a reversal for a LONG ?
Gann
$OM’s Supply Crunch: The Perfect Storm for a Major BreakoutBINANCE:OMUSDT staking metrics reveal something fascinating:
33% of supply locked → historically precedes major price moves
Why does this matter?
With less available supply on exchanges, any surge in demand — whether from retail or institutions — can push the price higher, faster. Combine that with #MANTRA’s growing institutional pipeline, the recent launch of RWAccelerator (with Google Cloud’s backing), and the overall momentum in the #RWA narrative, and the ingredients for a major supply squeeze are already in place.
When CRYPTOCAP:BTC stabilizes, these diamonds hands + institutional pipeline = inevitable push beyond $10
#Staking #DeFi #YieldFarming #NFA #Altcoins

PEPE USDT🚀 #PEPE
CRYPTOCAP:PEPE is testing a strong support zone, aligning with the trendline and previous breakout level. This could be a high-reward entry point before the next bullish wave 📈🔥.
Failure to hold support could lead to a retest of 0.00000756, but overall structure suggests a potential massive rally ahead 🚀🐸.
🎯 Target : 0.00002761 (+330%)

Cardano ($ADA)
CRYPTOCAP:ADA is approaching a key support zone at the 0.786 Fibonacci retracement, a historically strong bounce area 📈.
The chart is forming a potential double-bottom reversal, signaling a possible bullish recovery if buyers step in 🚀.
Targets:
🎯 Target 2: $1.214
🎯 Target 3: $1.398

Chainlink ($LINK)
BIST:LINK has found strong support at the 0.786 Fibonacci retracement level and is bouncing back from the demand zone 📈.
The price is attempting to break out from the descending trendline, which could signal the start of a new bullish wave 🚀.
If confirmed, potential targets to watch:
🎯 Target : $35

BNB Bullish Setup
CRYPTOCAP:BNB is currently trading within a rising channel and approaching the lower support level. A bounce from this area could trigger a strong bullish move 📈
Entry Zone: Ideal long position between $500-$550
Target 1: $768.10 🎯
Target 2: $875.73 🚀

XAUUSD wave structure analysis on 30 minute time frame4H, 1H swing is bullish.
30M swing is bearish, current is pullback.
The current price is in the supply zone of the 30-minute time frame. We can look for selling opportunities in this zone.

LongLong.
Looks like good trades
Lets monitor.
Use proper risk management.
Disclaimer: only idea, not advice.


February 25 Bitcoin Bybit chart analysisHello
It's a Bitcoinguide.
If you have a "follower"
You can receive comment notifications on real-time travel routes and major sections.
If my analysis is helpful,
Please would like one booster button at the bottom.
Here is the Bitcoin 30-minute chart.
The Nasdaq indicator will be released at 12 midnight tonight.
In the case of Bitcoin, it is coupled with Nasdaq and is falling without asking.
Since there is no short position entry point yet,
I proceeded a little safely until today because there was a risk factor.
*Long position strategy when the blue finger moves
1. Purple finger at the top 90394.5 dollars
Autonomous short operation section / Stop loss price when orange resistance line is broken
2. 87759.5 dollars Long position entry section / Stop loss price when green support line is broken
3. 92340 dollars Long position 1st target -> Top, Gap in order of target price.
Since it can rise strongly from dawn,
I did not operate a separate short position.
(In the case of Tether Dominance, since it is difficult to sweep from the current position, if it is not a direct crash, the rising pattern is maintained, so the part that is gradually broken is included in the strategy.)
There is an additional autonomous long entry position in the first section at the top.
The purple finger touch -> 87.7K from the current position is the safest,
and if it goes down right away, it is a long wait in the second section.
If you look closely at the green support line,
you will see a bright sky blue support line.
I used the falling wedge section as a long position.
(Daily support + weekly central pattern and candle tail)
Among the patterns I have been waiting for,
Because it is the first touch of the central line of the Bollinger Band weekly chart,
I will find the next support line and operate it from today's departure from the second section until this week.
Up to this point, my analysis article is simply asking for your help.
I will see you tomorrow depending on the participation rate today.
I hope you operate safely with the principle of trading and cut-off price.
Thank you.

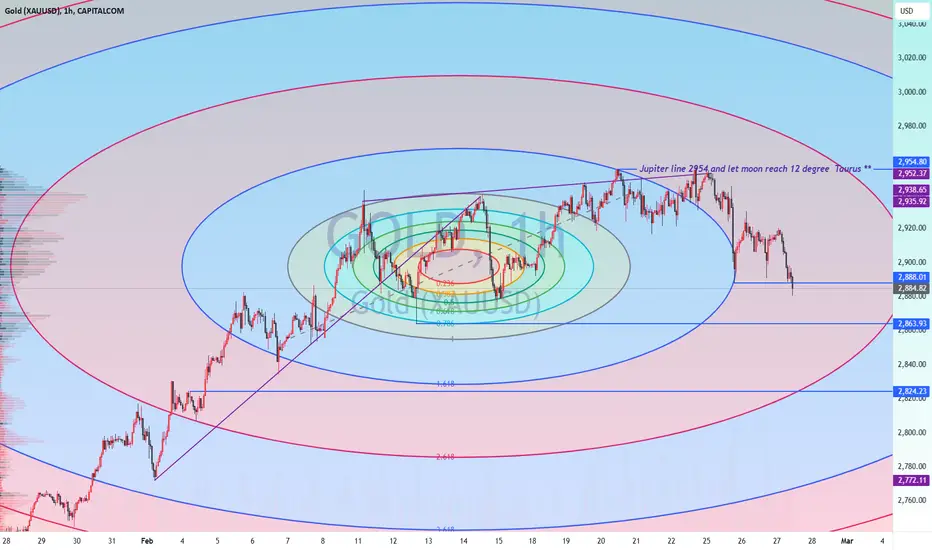
Just a Gold an idea and How planet dance with it Gold 2954 Jupiter line and dn it goes 2877 is Neptune and Node line and see how it unfolds
GBPUSD analysis(long term)Is the European economy collapsing?
Economic data could indicate a decline

XAUUSDGold technical analysis
Daily chart resistance 3000, support below 2888
Four-hour chart resistance 2918, support below 2888-2850
Gold operation suggestions: Gold began to fall after being suppressed at the 2930 mark in the Asian and European sessions yesterday. The European session continued to fall under pressure at the 2920 mark. The US session accelerated downward to break through the 2900 integer mark and stabilized at the 2890 line to bottom out and rebound. Then the gold price fluctuated and rose to close above 2910
From the 4-hour analysis, the upper resistance is around 2918, and the short-term support below is 2888. If it falls below the new low, it may accelerate its decline during the day and can be seen near 2850. If it is a false breakthrough, the final daily line closes above 2890 or fluctuates widely. In the middle position, watch more and move less, and wait patiently for key points to enter the market.
SELL:2888near SL:2892
BUY:2890near SL:2887
Use small size to control risk

My ViewI think price is at a daily resistance and might drop since the rising channel has been violated to the downside and price has BOS twice to the down side

MSFT BEARISH
MSFT to 375.
I won't be shorting but rather avg'ing into positions...
Well I might intraday short, but def not swings since this company could get some bullish news.
Looks bearish to me atm. Buyers are not stepping in after we've lost that key 400 level.

HNST to 18
Long term target 16-18
Weekly/monthly swing 8-10
Shares or ATM calls are your friend
Company has solid financials and consecutive ER beats. It will start attracting attention soon
**Disclaimer** I learned about this stock from another analyst. Did my own Technical Analysis and I like it. In for 15 shares atm with plans to buy calls next week if our market holds up.

GOLD reaches the key position 2888Gold bottomed out and rebounded in the late trading, and the long and short cycles repeated. From the daily level, the technical indicators of the gold market showed a clear divergence and were in a serious overbought range. According to the principles of technical analysis, there is a strong demand for adjustment in the market. Against this background, the price of gold fell sharply on Tuesday and Wednesday.
At present, the price of gold has effectively fallen below the support of the short-term moving averages MA5 and MA10, and today's opening price is below these two moving averages. And it has turned into strong resistance, thus pushing the price of gold to continue its downward trend. Technically, it is also necessary to judge by the combination of closing lines at the weekly and monthly levels, so it is temporarily regarded as a normal correction cycle. This correction cycle is triggered by the current small double top.
After the top structure of the gold 1-hour high, the decline broke through. We insist on being bearish on gold in the past two days. The rebound is an opportunity for shorts. Gold has now begun to form counter-pressure at 2920. Gold rebounds below 2920 and continues to be short at highs. The current short-term moving averages MA5 and MA10 have two pressure levels of 2928 and 2935!
If the gold price can rise strongly and break through the above resistance area, then today's adjustment will only be short-lived, and gold will continue to rise. If there is no breakthrough, then gold will most likely continue to fall. Focus on the support strength near the low point of 2888. Once this point is lost, it may trigger a further decline in the gold price.
After a night of rebound correction, gold touched the 2920 line and began to fall again. The current market direction has not changed, and it is still short. When the market rebounds to the top, we should go short without hesitation! Go short directly below 2928 in the Asian session!
After the previous two rounds of repeated bottoming out and rebounding, it is actually a market wash. Even with the current two rounds of rebound, the high point has not been able to break through the high point of the previous wave, which means that the shorts are in an advantageous stage, and the market is easy to fall and difficult to rise, and a new low after the intraday adjustment is just around the corner! So the intraday operation idea is to go short on the rebound!
Key points:
First support: 2902, second support: 2890, third support: 2880
First resistance: 2920, second resistance: 2928, third resistance: 2935
Operation ideas:
BUY:2887-2890, SL:2889, TP:2910-2920;
SELL:2925-2928, SL:2937, TP:2900-2890;

ABOUT XAUUSDMy option about gold Is more bearish so that zone is good and strong restanice if the price comes to that zone it can pullback

EUR/USD 1HOUR CHART TECHNICAL ANALYSIS NEXT MOVE POSSIBLE This chart represents the EUR/USD currency pair on a 1-hour timeframe, showing key technical analysis elements:
1. Sell Zones (Highlighted in Red Boxes): These are areas of strong resistance where price previously reversed downward, indicating potential selling opportunities.
2. Trendlines (Blue Lines):
The first blue trendline represents a downtrend, which was eventually broken to the upside.
The second blue trendline shows an uptrend, which also appears to have been broken, suggesting potential weakness.
3. Price Action & Projection:
The price recently touched a sell zone around 1.0520 and started rejecting it.
The chart suggests a possible downward movement, with a blue arrow pointing toward the lower support levels.
Support levels are marked at 1.04544 and 1.04054, where price might find some buying interest.
Conclusion:
This analysis indicates a bearish outlook after price rejected the sell zone. If the price stays below the resistance, it could move toward the lower support levels. Traders might consider short positions if the price confirms the breakdown.

Analysis$KAITO is testing the red resistance zone 🔴. If the breakout is successful, the first target will be the green line level 🟩.
🎯 First Target: Green line level

LTC PATTERNSI've always had high expectations for $LTC. One day it will surprise you, I've said that for years. I consider myself good at pivots but its been difficult to pin down in terms of time. For me, its not a matter of IF but when. One of the few that I invest in and seldom trade.

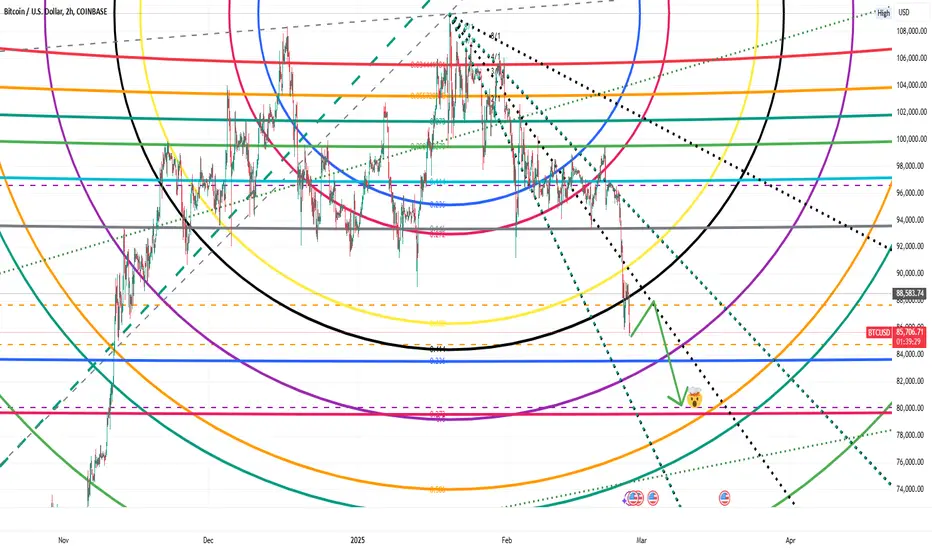
Bitcoin to 80k shortlySimple charting of long distance Fibonacci circles are revealing correlations that are bringing us another rung down before the next consolidation phase and return upwards. I'm expecting that phase to find support at 80k, with potential to bounce for a very brief low around the previous ATH in 75k range.
BTC Long back to the MeanBitcoin has recently broken out of its prior range, sweeping liquidity below key levels.
This setup presents a potential mean reversion opportunity, expecting price to revert back into the range. The target for this trade is around 96,785.2, aligning with the previous consolidation area.
Key Levels:
Entry: Current price region (~89,310)
Target: 96,785.2 (Mean reversion level)
Stop-Loss: 85,969.9 (Below liquidity sweep)
Trade Execution:
Entry Confirmation: Signs of rejection from the liquidity grab area / MSB on 2h
Risk/Reward: Favorable setup with a good R:R ratio.
Stop Placement: Below the liquidity sweep to prevent early invalidation.
Conclusion:
The market has grabbed liquidity and is now positioned for a move back into the range.
If bullish momentum continues, we expect price to revert toward the 96,000 level.
