GBPCAD SELL ANALYSISLooking at GBPCHF on 15m timeframe
We looking for a potential short position upon retest of the level in which the market broke out
Gbpcadshort

GBPCAD will go down !!GBP-CAD is trading in a bearish channel
The pair recently retested the descending resistance
From channel 1.7350 , we are seeing a bearish reaction
I think the pair will continue to fall towards the support below

Gbpcad Short Setup Gbpcad Sell SetupYou can Sell Now with Small lot size in GBPCAD . in Daily Chart GBPCAD Looking good for Short

GBP / CAD 1073558 + 0.18 % LONG IDEA * PRICE ACTION & STRUCTUREHEY EVERYONE
HOPE EVERYONE IS DOING GOOD HAVING A GOOD ONE.
NEW WEEK, NEW OPPORTUNITIES.
LOOKING AT THE GBP / CAD
* The PAIR has been trading in a RISING WEDGE just broke above a resistance level, retested this level somewhat now signaling continuation.
- Short term the pair is currently rejecting at this structure possibly signaling continuation in momentum on the 4h chart this in a rising wedge..
- Looking for long entries on the THE POUND / CAD this week should all the rules of the formation be met.
lets see how it goes
IF THIS IDEA ASSISTS IN ANY OR IF YOU LIKE THIS ONE
SMASH THAT LIKE BUTTON & LEAVE A COMMENT.
ALWAYS APPRECIATED
____________________________________________________________________________________________________________________
* Kindly follow your entry rules on entries & stops. |* Some of The idea's may be predictive yet are not financial advice or signals. | *Trading plans can change at anytime reactive to the market. | * Many stars must align with the plan before executing the trade, kindly follow your rules & RISK MANAGEMENT.
_____________________________________________________________________________________________________________________
| * ENTRY & SL -KINDLY FOLLOW YOUR RULES | * RISK-MANAGEMENT | *PERIOD - SWING TRADE

GBPCAD | Bullish Trend Continue?GBPCAD has been in good bullish trend as supported by rising trendline. Recently the price action has given a breakout as well. Those who are holding can continue riding the trend. Those who wants to take position should wait for the dip and sell it upside.
Trade your levels accordingly.


GBPCAD Starts Breaking the Barriers..Lets See next WeekGBPCAD after many failure attempts , now starts to break the previous barrier ,,Next Week the major game play can happen...If it crossed the resistance wait for retest and then make an order, If everything goes Well we can catch 250 + Pips easily.....

Divergence appears and selling opportunity in GBPCADH4 time frame.
Structure: Uptrend.
A divergence signal appeared at the 1.73000 resistance area.
Waiting for downtrend confirmation could find selling opportunities.
The profit target is the 1.71400 and 1.69600 price zone.
-----------------------------------------------------------------------------------------------
Wish you all have a good trading day!

GBPCAD ShortHey traders, in today's trading session we are monitoring GBPCAD for a long term selling opportunity around 1.73 zone, once we will receive any bearish confirmation the trade will be executed.
Trade safe, Joe.

GBPCAD SELL ANALYSISPrice has retested the resistance zone thrice and failed to break
Price has broken out of the channel and retested our resistance
Upon retest we are starting to see a decline in price value

GBPCAD Down Trend.!#GBPCAD Looking for Sell trade setup as I mentioned in the Chart.!
Keep Supporting LIKE, COMMENT And FOLLOW.!
ThankYou.!

Look at the LTF for opportunities!Hi Traders,
GBPCAD has been moving withing a larger structure for quite some time. Looking at the lower time frames, we can definitely see some opportunities that may fit our trading plan!
Ensure your rules are met before entering.
Click the like button if this helps you, I would love to hear your view on this pair!
Follow me for more ideas!


Short Opportunity on GBPCADAccording to Fibo Retracement From the last TOP
Resistance Level on Daily Timeframe
Retest Uptrendline

Gbpcad wait for aproch supply zone then we enter sellGbpcad wait for aproch supply zone then we enter sell we need to wait for approaching supply zone then we confirmation in 15 TF then we enter sell long term

GBP/CAD SHORT SELL OPPOTUNITY NOW..
💹GBP/CAD ⏬SELL @ 1.72283 ((Scalping Trade))
✅TP-1# 1.72048
✅TP-2# 1.71488
⛔️SL 1.72857
N.B-ITS WAVE CORRECTION ENTRY AND SO USE SMALL LOT PLZ.
AronnoFX will not accept any liability for loss or damage as a result of
reliance on the information contained within this channel including
data, quotes, charts and buy/sell signals
If you like this idea, do not forget to support with a like and follow.
Traders, if you like this idea or have your own opinion about it,
write in the comments. I will be glad.

GBPCAD ShortWaiting for a small pull back on GBPCAD to 1.72800 and then sell off to support at 1.69200

GBP/CAD 4HR BUY AND SELL SET UP???Hi TRADERS this is my trade set up for the GBP/CAD for the new week ahead
GBP/CAD We have two scenarios a possible breakout of the very strong resistance area and if it does break out will be a nice strong move higher, next scenario we get a good rejection of the resistance level and we take a sell
clean crisp charts I hope it helps if you have any questions please private message me
good luck for this weeks trading
please follow like and comment thanks

GBPCAD | Important LevelGBPCAD has approached to important level after bouncing from 0.5 fib level. Two senario can play form here;
a) Bullish: It is looking in good momentum after bouncing from fib level 0.5. It will likely to break the overhead resistance. One can take long position on break of horizontal area.
b) Bearish: Last time price hit from the same zone and took correction of around 300 pips. If it gives bearish sign then one must look to short it.
Trade your levels accordingly.

GBPCAD Approaching Key LevelGBPCAD is approaching the 2022 High made on Jan 6th. Price action around this level should determine the short term direction for us to jump in.
A breakout above this level could give us a nice risk/reward trade to follow the trend and ride it up to the next key level of resistance, an area that seemed to see a magnetic effect followed by reversals a number of times in 2021 (5+ times depending on how you measure this).
Alternatively, the Jan 6th high will be a level a large number of traders will be watching and price is starting to look a little overextended.
This previous high could easily act as resistance and see a nice reversal. Price has been respecting an upward trendline and trading steadily above the 20 SMA/EMA, but price has seen a couple of spikes toward this high followed by quick rejections, and momentum for GBP appears to be weakening, as can be seen in the Currency Meter indicator where average GBP RSI is decreasing.
An aggressive short entry would be a close below the rising trendline. With closes below the SMA/EMA being more conservative short entries.
If price reverses I expect to see a temporary pullback not a full reversal, with expectation of a higher low on the Daily.
Overall I'd be happier to see a reversal and take a short, but I'll be watching price action and will jump into a long if we see a strong push and hold above the previous high with broader strength from GBP and broader weakness from CAD on the Currency Meter.

GBP/CADSell: GBP/ CAD
SL @ 1.73540
TP @ 1.72050
Max Risk: 2%
(When calculating, do not forget about different spreads from Brokers)
Leave comments or likes to keep our content free and alive.
Have a good week to everyone
It is not an investment recommendation

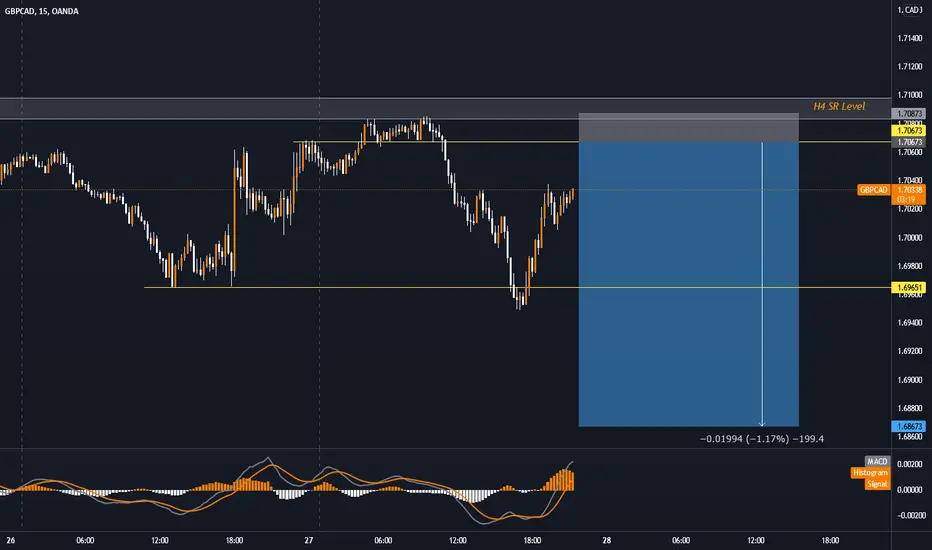
GBPCAD ShortHey traders, we are monitoring GBPCAD for a selling opportunity around 1.706, once we will receive any bearish confirmation the trade will be executed.
Trade safe, Joe.

shortH₄ Support turned to a strong resistance ( SR FLIP) and in 15 min TF market shift has been initiated, so now we wait for price to reach the resistance, and we sell as indicated on the chart via short RR tool. We expect a fall of 200 pips.
GBPCAD ShortWaiting for GBPCAD to break out our bearflag (correction leg) and break support of 1.70100 before we get into the sell. Price has bounced at this level so we stay patient and wait for the break
