XAUUSD and USDJPY Top-down analysisHello traders, this is a complete multiple timeframe analysis of this pair. We see could find significant trading opportunities as per analysis upon price action confirmation we may take this trade. Smash the like button if you find value in this analysis and drop a comment if you have any questions or let me know which pair to cover in my next analysis.
Goldsignals

XAUUSD,GOLD 4H GOLD has broke and retested an upward channel, which means we are looking for selling oppotunity
1.The CHoCH has been created
2. A lower low has been created
On 4h timeframe I see a potential HEAD & SHOULDERS.
NOTE : We're not entring the trade until the downward break of the HEAD & SHOULDERS.

GOLD (XAUUSD): Important Supports & Resistances For Next Week
Here is my latest structure analysis and important
supports and resistances on Gold.
Resistance 1: 2916 - 2932 area
Resistance 2: 2952 - 2956 area
Resistance 3: 2998 - 3002 area
Support 1: 2832 - 2855 area
Support 2: 2772 - 2786 area
Support 3: 2714 - 2740 area
Consider these structures for pullback/breakout trading.
❤️Please, support my work with like, thank you!❤️
I am part of Trade Nation's Influencer program and receive a monthly fee for using their TradingView charts in my analysis.

XAU/USD: Gold at a Critical Crossroad: Will $2930 Hold or Break?By analyzing the gold chart on the two-hour timeframe, we can see that the price followed the expected bearish movement yesterday, correcting from its recent high of $2928 down to $2900 before finding temporary support. Currently, gold is trading around $2916, showing signs of indecision as it consolidates within a key range.
🔍 Key Levels & Liquidity Considerations
A significant liquidity pool exists between $2928 and $2930, which could act as a magnet for price. If gold moves toward this range, we might witness liquidity collection before a potential strong rejection and deeper decline.
As long as gold remains below $2930, the bearish outlook remains intact, and further corrections toward $2900 and potentially lower levels could unfold. However, if buyers manage to push the price above $2930 and sustain a breakout with clear confirmation and bullish momentum, we could see gold targeting levels above $2950 in the coming sessions.
📌 Primary & Alternative Scenarios:
🔹 Primary Bearish Scenario: A move into the $2928-$2930 liquidity zone, followed by rejection and continuation of the correction.
🔹 Alternative Bullish Scenario: A clean breakout above $2930 with a strong close and confirmation, leading to further bullish expansion toward $2950+.
🎯 Final Outlook
At this stage, the bearish bias remains dominant, but traders should carefully monitor price action near key liquidity zones before executing positions. Watching how gold reacts around these critical levels will be crucial in determining the next major move.
Stay updated as we track the market closely! 🔥
Please support me with your likes and comments to motivate me to share more analysis with you and share your opinion about the possible trend of this chart with me !
Best Regards , Arman Shaban

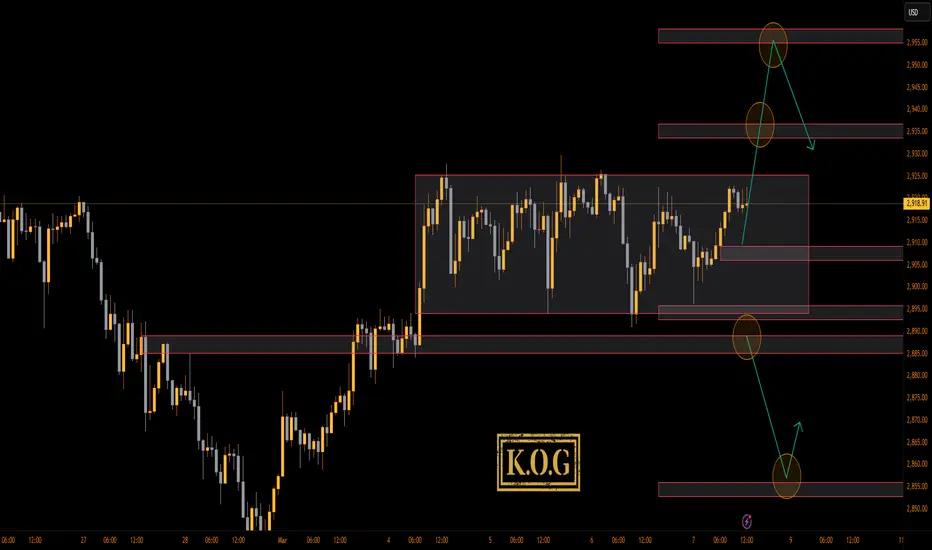
THE KOG REPORT - NFPTHE KOG REPORT – NFP
This is our view for NFP, please do your own research and analysis to make an informed decision on the markets. It is not recommended you try to trade the event if you have less than 6 months trading experience and have a trusted risk strategy in place. The markets are extremely volatile, and these events can cause aggressive swings in price.
Firstly, we would suggest traders stay away from this NFP altogether, the markets are very delicate and moving to extreme levels not only on Gold but most forex pairs. For that reason we’ll keep it simple and look at the key levels together with the structure formed.
We have the higher resistance level here which is the previous order region 2930-35 which looks to be a potential region price may want to attack if they want to continue this move upside, above that is the extension of the move around 2945-55. Price needs to stay below this level, If we can reject and not break above these levels, an opportunity to see the market correct may be available back down in attempt to break 2900 level.
On the flip, if they push price downside, we’ll wait, the range needs to be broken, price should want to retest the flip and then continue the move, that’s when we can start using the red boxes to target those lower levels and potentially look for the swing low from the circled hotspot.
As above, keep it simple, the trade comes after the event and most accounts are blown during these events due to traders using large lots on small accounts attempting to capture the volume driven candles. Unless you’re already in and protected, the swing in the opposite direction can cause huge problems to less experienced traders.
RED BOXES:
Break above 2930 for 2934, 2940, 2944 and 2955 in extension of the move
Break below 2910 for 2903, 2895, 2890 and 2879 in extension of the move
Please do support us by hitting the like button, leaving a comment, and giving us a follow. We’ve been doing this for a long time now providing traders with in-depth free analysis on Gold, so your likes and comments are very much appreciated.
As always, trade safe.
KOG
XAU/USD : Get ready for a new ATH, Towards $3000?! (READ)Gold's one-hour chart analysis confirms that the price has followed our previous forecast precisely, reaching the $2951 level as expected. Comparing the last five analyses highlights the accuracy of these projections.
Currently, after hitting $2951, gold is facing selling pressure and is trading around $2947. I anticipate a slight correction before another upward move.
Short-term targets: $2954 and $2956
Medium-term targets: $2966 and $2969
Please support me with your likes and comments to motivate me to share more analysis with you and share your opinion about the possible trend of this chart with me !
Best Regards , Arman Shaban

XAUUSD NFP Analysis todayHello traders, this is a complete multiple timeframe analysis of this pair. We see could find significant trading opportunities as per analysis upon price action confirmation we may take this trade. Smash the like button if you find value in this analysis and drop a comment if you have any questions or let me know which pair to cover in my next analysis.

XAUUSD Top-down analysis Hello traders, this is a complete multiple timeframe analysis of this pair. We see could find significant trading opportunities as per analysis upon price action confirmation we may take this trade. Smash the like button if you find value in this analysis and drop a comment if you have any questions or let me know which pair to cover in my next analysis.

GOLD (XAUUSD): Consolidation Continues
On a yesterday's live stream, we discussed that Gold is consolidating
within a horizontal range.
After a test of its resistance, we got a local sideways movement and distribution.
Violation of its minor support is a strong intraday bearish signal.
Because of that, I think that the price may drop to 2900 support.
❤️Please, support my work with like, thank you!❤️
I am part of Trade Nation's Influencer program and receive a monthly fee for using their TradingView charts in my analysis.

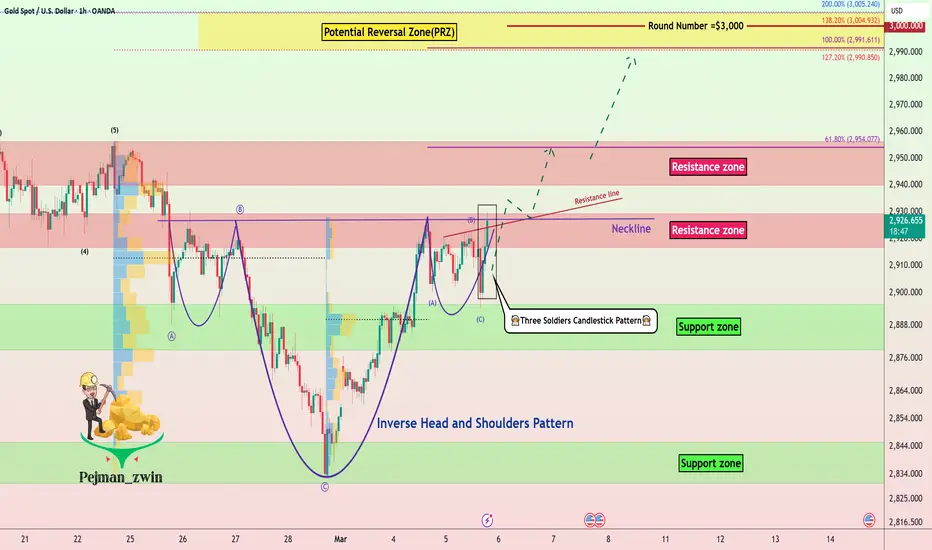
Gold’s Three Soldiers Pattern Signal: A Strong Rally Ahead?Gold ( OANDA:XAUUSD ) is breaking the Resistance zone($2,930-$2,916) and the Neckline of the Inverse Head-and-Shoulders Pattern .
According to the Elliott wave theory, the Zigzag Correction(ABC/5-3-5) is over, and we must wait for the next impulse wave .
Also, the Three Soldiers Candlestick Pattern is a good sign to break the Resistance zone($2,930-$2,916) and neckline .
I expect Gold to rise to at least $2,953 , if the Resistance zone($2,957-$2,940) is broken, we should wait for Gold to rise to the Potential Reversal Zone(PRZ) .
Do you think Gold can make a new All-Time High(ATH)?
Note: If Gold goes below $2,887, it should expect more gold Dumps.
Gold Analyze ( XAUUSD ), 1-hour time frame.
Be sure to follow the updated ideas.
Do not forget to put a Stop loss for your positions (For every position you want to open).
Please follow your strategy; this is just my idea, and I will gladly see your ideas in this post.
Please do not forget the ✅' like '✅ button 🙏😊 & Share it with your friends; thanks, and Trade safe.
EUR/USD : Get Ready for a Huge Sell Position! (READ CAPTION)By analyzing the EUR/USD chart on the three-day timeframe, we can see that the price has started to rise following the sharp decline in the U.S. Dollar Index (DXY). Currently, it is attempting to fill the identified Fair Value Gap (FVG).
The key supply zone is located between 1.08300 and 1.09380. Traders can look for a suitable sell trigger within this range for potential short positions.
Please support me with your likes and comments to motivate me to share more analysis with you and share your opinion about the possible trend of this chart with me !
Best Regards , Arman Shaban

Gold's Resistance Battle: Breakout or Reversal?Gold ( OANDA:XAUUSD ) is moving near the Resistance zone($2,896-$2,878) .
According to the theory of Elliott waves , Gold seems to have succeeded in completing microwave 5 .
Also, we can see the Regular Divergence(RD-) between Consecutive Peaks .
I expect Gold to go down at least pivot points after breaking the Uptrend line , and in the next stage , the Support zone($2,845-$2,830) can be the next target .
Note: If Gold can go over the Resistance zone($2,896-$2,878), we can expect more pumps.
Gold Analyze ( XAUUSD ), 15-minute time frame.
Be sure to follow the updated ideas.
Do not forget to put a Stop loss for your positions (For every position you want to open).
Please follow your strategy; this is just my idea, and I will gladly see your ideas in this post.
Please do not forget the ✅' like '✅ button 🙏😊 & Share it with your friends; thanks, and Trade safe.

XAUUSD Analysis todayHello traders, this is a complete multiple timeframe analysis of this pair. We see could find significant trading opportunities as per analysis upon price action confirmation we may take this trade. Smash the like button if you find value in this analysis and drop a comment if you have any questions or let me know which pair to cover in my next analysis.

XAUUSD Resistance rejection expected.Gold (XAUUSD) is rising after an exact rebound on its 4H MA200 (orange trend-line). Every time the 17-month Channel Up posted a similar 4H MA200 rebound, Gold got rejected on the upper Resistance and re-tested one more time the 4H MA200.
A trading plan involving a buy targeting 2960 (Resistance) and then reversing to a sell targeting 2880 (4H MA200) is technically viable based on those occurrences.
-------------------------------------------------------------------------------
** Please LIKE 👍, FOLLOW ✅, SHARE 🙌 and COMMENT ✍ if you enjoy this idea! Also share your ideas and charts in the comments section below! This is best way to keep it relevant, support us, keep the content here free and allow the idea to reach as many people as possible. **
-------------------------------------------------------------------------------
Disclosure: I am part of Trade Nation's Influencer program and receive a monthly fee for using their TradingView charts in my analysis.
💸💸💸💸💸💸
👇 👇 👇 👇 👇 👇

GOLD (XAUUSD): Support & Resistance Analysis
Here is my latest structure analysis and important
supports and resistances on Gold.
Resistance 1: 2916 - 2932 area
Resistance 2: 2952 - 2956 area
Resistance 3: 2998 - 3002 area
Support 1: 2832 - 2853 area
Support 2: 2772 - 2786 area
Support 3: 2714 - 2740 area
It looks like we are going to see a test of the current all-time high soon.
Remember that its breakout will push the prices much higher.
❤️Please, support my work with like, thank you!❤️
I am part of Trade Nation's Influencer program and receive a monthly fee for using their TradingView charts in my analysis.

XAU/USD : 1000 Pips Down from ATH, What's Next? (READ CAPTION)By analyzing the gold chart on the one-hour timeframe, we can see that the price, based on the previous analysis, managed to rise by nearly 200 pips but then started to decline from the $2894 zone. Today, we witnessed a price correction down to $2859.
This week, gold has experienced a 3.5% correction from its all-time high, with a decline of over 1000 pips. Currently, gold is trading around $2860.
The attractive SELL zones are $2894, $2900, and $2906.
The attractive BUY zones are $2820, $2833, and $2845.
Please support me with your likes and comments to motivate me to share more analysis with you and share your opinion about the possible trend of this chart with me !
Best Regards , Arman Shaban

Gold trading zones: 04-Mar-2025Gold trading possible entry zones: Explore today's zones and refine your strategy.

XAUUSD Analysis TodayHello traders, this is a complete multiple timeframe analysis of this pair. We see could find significant trading opportunities as per analysis upon price action confirmation we may take this trade. Smash the like button if you find value in this analysis and drop a comment if you have any questions or let me know which pair to cover in my next analysis.

XAUUSD Analysis todayHello traders, this is a complete multiple timeframe analysis of this pair. We see could find significant trading opportunities as per analysis upon price action confirmation we may take this trade. Smash the like button if you find value in this analysis and drop a comment if you have any questions or let me know which pair to cover in my next analysis.

GOLD (XAUUSD): Bullish After the Market Opening
Friday's turmoil in the White House pumped Gold prices
during the New York session.
Analyzing the intraday price action, I see 2 confirmed bullish signals:
the price broke both the resistance line of a falling channel
and a neckline of a cup & handle pattern on an hourly.
Odds are high, that the price will grow more and reach at least 2864 level
after the opening.
❤️Please, support my work with like, thank you!❤️

GOLD TRADING POINT UPDATE > READ THE CHAPTIAN Buddy'S dear friend 👋
SMC Trading Signals Update 🗾🗺️ Gold Traders SMC-Trading Point update you on New technical analysis setup. Gold Traders Gold Ready for Down 👇 ⬇️ List day take a breakout up trand line. 4H Time Frame. Today 💪 test supply rejected point below 👇 trend 📉 FVG) level. 2892 close below 👇 2864 - 28833
Key Resistance level 2920
Key Support level 2892 - 2864 - 2833
Mr SMC Trading point
Pales support boost 🚀 analysis follow)

GOLD, Will the correction continue or not ??Hello Traders, Hope you are doing great.
As you can see below this post, We expected a correction in GOLD yesterday because it was forming a Rising Wedge Reversal pattern. The price corrected about 500 pips and then it began to retrace to 61.8 Fibo level. But what happens now? will the correction continue or not ?
The answer of this question is a Hesitant Yes, it will probably continue its downward correction, but PCE data that comes Friday can change everything, so Don't forget to use proper risk management. and Remember that these kind of corrections are temporary and gold price will probably see higher price this year
and finally tell me What are your thoughts about GOLD ? UP or DOWN ? comment your opinion below this post.

XAUUSD Analysis todayHello traders, this is a complete multiple timeframe analysis of this pair. We see could find significant trading opportunities as per analysis upon price action confirmation we may take this trade. Smash the like button if you find value in this analysis and drop a comment if you have any questions or let me know which pair to cover in my next analysis.

GOLD, Is a correction on the way ???Hello Traders, Hope you are doing great.
GOLD is forming a Rising Wedge Reversal pattern these days and it seems that Bulls aren't able to raise the price at least for now. So I expect a downward correction in upcoming days.
Remember that this kind of corrections are temporary and gold price will probably see higher price this year; so Don't forget to use proper risk management .
and finally tell me What are your thoughts about GOLD ? UP or DOWN ? comment your opinion below this post.
