XAUUSD Quick possible 50 pip bounceXAUUSD 1h has managed to bounce from the support level and has grabbed 2 step liquidity and prepared for a possible move back to the upside. As daily doji formation, new daily candle open with a bullish bias and may bounce back above the daily high signaling potential daily trend continuation.
Goldsignals

XAU/USD : Time for BUY? Let's see! (READ THE CAPTION)By analyzing the 1-hour gold chart, we can see that, as expected, gold broke above the $2,902.5 resistance yesterday and continued its bullish movement, successfully hitting the next targets at $2,914 and $2,919!
I hope you made the most of this analysis! 🚀
The next potential move depends on whether gold stabilizes above $2,914. If it does, we could see further growth toward $2,922 and $2,928 as the next upside targets.
Please support me with your likes and comments to motivate me to share more analysis with you and share your opinion about the possible trend of this chart with me !
Best Regards , Arman Shaban

GOLD at a Turning Point: Potential Breakdown Ahead?OANDA:XAUUSD is currently testing the lower boundary of its ascending channel. A decisive break below this trendline could signal a shift in market sentiment, potentially weakening bullish momentum and increasing the likelihood of bearish pressure.
If price breaks below the current support and then retests the zone as resistance, sellers may take control and drive the price lower. A confirmed rejection at this level could lead to a bearish continuation toward the 2,829 support level, which represents a logical target within the current market structure.
Traders should monitor for bearish confirmation signals, such as bearish engulfing candles or strong rejection wicks, to validate potential short positions.

XAUUSD Top-down analysis Hello traders, this is a complete multiple timeframe analysis of this pair. We see could find significant trading opportunities as per analysis upon price action confirmation we may take this trade. Smash the like button if you find value in this analysis and drop a comment if you have any questions or let me know which pair to cover in my next analysis.

XAUUSD SELLING SET-UP IS HEREHello Guy's Welcome To Another Day Of TRADING
Resistance: Around 2940 - 2945 (upper black trendline where price struggles to break above).
Support: Around 2900 - 2890 (lower black trendline where price bounces).
Target: 2900 (expected drop if price breaks below support).
If the price stays above support, it may go up again. If it breaks below, it could fall to the target.

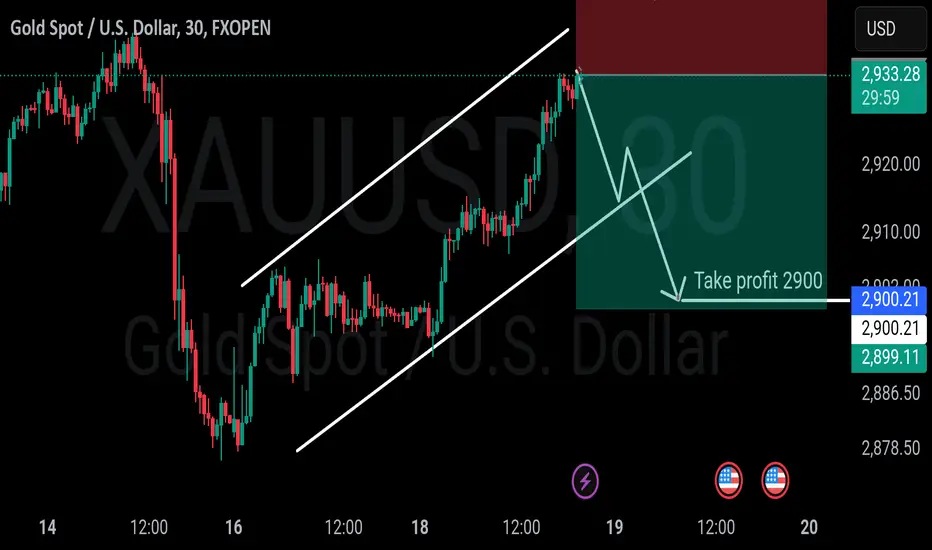
XAU/USD 30-Minutes | Bearish Setup | High-Probability TradeXAU/USD 30-Minutes | Bearish Setup | High-Probability Trade
Gold (XAU/USD) has been trading within an ascending channel on the 30-minute timeframe. However, signs of exhaustion at the upper resistance suggest a potential reversal.
Trade Setup:
Entry Zone: Around 2933
Stop Loss: 2948 (Above resistance for risk management)
Take Profit: 2900 (Targeting key support zone)
Technical Analysis:
The price is struggling near the channel resistance, indicating possible bearish momentum.
A breakdown from the channel could accelerate selling pressure.
Confirmation of lower highs and lower lows may provide additional confluence for downside continuation.
This setup offers a high-risk-reward opportunity for traders looking to capitalize on short-term weakness in gold. Keep an eye on price action near resistance levels for validation before entering the trade.
📉 What’s Your Take? Comment below and let’s discuss! 🚀
Gold in Correction Mode – How Low Can It Go!?As I expected in the previous post , Gold ( OANDA:XAUUSD ) started to decline from the Potential Reversal Zone(PRZ) and with good momentum .
Gold is moving near the Resistance zone($2,916-$2,905) and the 100_SMA(1-hour) . 100_SMA(1-hour) was an important support for Gold so that every time Gold hit this moving average, it started to increase.
Also, Gold's movements seem to be corrective since the market opened .
According to the theory of Elliott waves , it seems that Gold is in Corrective Waves , and according to Gold's falling momentum , it is possible that Gold will have a Zigzag Correction(ABC/5-3-5) in front of it.
In addition, if you look at the Gold chart in the 4-hour or Daily time frame , you will notice that there is a possibility of Adam & Adam Double Top Pattern(AADT) .
I expect Gold to attack at least the Support zone($2,890-$2,879) in the coming hours, and if this zone breaks , we should wait for Gold to drop to at least $2,865 .
Note: If Gold can go above 100_SMA(1-hour) again, or rather, if Gold touches $2,920, we should expect more pumps.
Be sure to follow the updated ideas.
Gold Analyze ( XAUUSD ), 1-hour time frame.
Do not forget to put Stop loss for your positions (For every position you want to open).
Please follow your strategy; this is just my idea, and I will gladly see your ideas in this post.
Please do not forget the ✅' like '✅ button 🙏😊 & Share it with your friends; thanks, and Trade safe.

BTC/USD 1HOUR CHART TECHNICAL ANALYSIS NEXT MOVE POSSIBLE Key Insights:
1. Support Zone (Blue Area - 94,877 to 95,643)
Price recently tested this area and showed signs of rejection, indicating potential bullish momentum.
2. Entry & Target Projection
The chart suggests a buy setup with price expected to rise from the current support.
The first target is around 96,828, followed by a higher resistance level at 97,208.
3. Stop-Loss & Risk Management
Stop-loss is likely placed below 94,877 in case of further downside movement.
The risk-to-reward ratio looks favorable with a clear upward structure.
Conclusion:
If BTC holds above 95,000, buyers may push towards 96,800 - 97,200.
A break below 94,877 could invalidate this setup.
Would you like a signal update message for your channel?

XAUUSD Top-down analysis Hello traders, this is a complete multiple timeframe analysis of this pair. We see could find significant trading opportunities as per analysis upon price action confirmation we may take this trade. Smash the like button if you find value in this analysis and drop a comment if you have any questions or let me know which pair to cover in my next analysis.

Gold trading zones: 18-Feb-2025Hey traders! Check out today's Gold trading zones and let's discuss potential opportunities.

THE KOG REPORT THE KOG REPORT:
In last week’s KOG Report we said we would be looking for price to start with an incline into the lower support regions in order to give us another long opportunity into the target level 2902 initially, which was our Excalibur target. Gold however had another plan and started the move from the open, this allowed us to trade on the red boxes and trade the move upside surpassing the target level into the highs that we witnessed last week.
During the week, we update our traders with the path upside and suggested looking for the short trade from the Red box active level, which worked perfectly giving the move downside that we saw on Friday.
It was a fantastic week in Camelot, not only completing 8 Gold targets on Excalibur, but also all the bias level and red box targets. Not to mention the targets completed on all the other pairs we share and analyse. Well done to the traders who followed!
So, what can we expect in the week ahead?
This week we’re looking for price to potentially give us further opportunities to short, however, we have a key level above of 2910! Support on the intra-day stands at 2870-65, which if targeted early session could give buyers the confidence they need to take that long into the 2890-5 region and above that 2904. There is an extension of the move into the 2910 region, but anywhere between the 2904-10 region are the levels we want to monitor for RIPs, and if they present themselves, the opportunity to take that swing short may be there again.
The key order region (liquidity pool) is sitting below at 2850-55 which is a decent level for price to attempt, but this region needs to be broken to go lower! If broken, we won’t be looking to go long again until we’re closer to lower 2800’s, so please trade with caution this week.
We do have higher targets on Gold, but, there needs to be a correction and if this is it, we’ll make sure to take advantage of it just like we have done for years, up, down, where ever it goes, we’ll trade it with our trusted pal Excalibur, the EA and our Red box indicators.
Not much more to say, low volume news this week, Monday could be a ranging day so expect choppy and whipsawing price action.
KOG’s bias for the week:
Bullish above 2865 with targets above 2885, 2895, 2902 and above that 2910
Bearish on break of 2865 with targets below 2855, 2850, 2843, 2835 and below that 2828
RED BOXES:
Break above 2885 for 2888, 2902, 2910 and 2913 in extension of the move
Break below 2875 for 2870, 2865, 2857, 2855 and 2850 in extension of the move
Please do support us by hitting the like button, leaving a comment, and giving us a follow. We’ve been doing this for a long time now providing traders with in-depth free analysis on Gold, so your likes and comments are very much appreciated.
As always, trade safe.
KOG

XAUUSD Channel Up preparing the new Bullish Leg.Gold (XAUUSD) has been trading within a Channel Up for almost 1 month. Friday's test of the 4H MA50 (blue trend-line) proved once again why this level is the strongest Support within the pattern, as it held and has initiated a relative bounce.
If this continues, it should technically be the new Bullish Leg, similar to the January 27 rebound on the 4H MA50. As you can see, even the 4H RSI sequences among those fractals follow the same pattern.
If (d) is indeed the technical RSI bottom, then we can expect a similar 1.5 Fibonacci extension rally to 2970.
-------------------------------------------------------------------------------
** Please LIKE 👍, FOLLOW ✅, SHARE 🙌 and COMMENT ✍ if you enjoy this idea! Also share your ideas and charts in the comments section below! This is best way to keep it relevant, support us, keep the content here free and allow the idea to reach as many people as possible. **
-------------------------------------------------------------------------------
Disclosure: I am part of Trade Nation's Influencer program and receive a monthly fee for using their TradingView charts in my analysis.
💸💸💸💸💸💸
👇 👇 👇 👇 👇 👇

XAUUSD top-down analysis Hello traders, this is a complete multiple timeframe analysis of this pair. We see could find significant trading opportunities as per analysis upon price action confirmation we may take this trade. Smash the like button if you find value in this analysis and drop a comment if you have any questions or let me know which pair to cover in my next analysis.

XAUUSD Top-down analysis Hello traders, this is a complete multiple timeframe analysis of this pair. We see could find significant trading opportunities as per analysis upon price action confirmation we may take this trade. Smash the like button if you find value in this analysis and drop a comment if you have any questions or let me know which pair to cover in my next analysis.

Gold at PRZ—Will Bears Take Over Soon!?Today, U.S. Retail Sales data will be released:
Core Retail Sales (Forecast: 0.4%) → If lower than expected, it may indicate weaker consumer spending, potentially weakening the USD ( TVC:DXY ).
Retail Sales (Forecast: 0.4%) → A lower-than-expected reading would signal economic weakness and increase expectations for Fed rate cuts.
Given recent economic trends and previous reports like CPI (inflation) and PPI (producer inflation) coming in higher than expected, retail sales data is more likely to be stronger than forecasted or at least in line with expectations.
Potential Market Impact : If the data is stronger than expected : USD strengthens → Gold declines .
There is a slightly higher probability that the data will be stronger than expected (or in line with forecasts). However, if the data disappoints , the market could react sharply .
If the indexes are close to or match the forecasts, there will be less expectation of emotional market movement.
--------------------------------------------------
Gold ( OANDA:XAUUSD ) started to rise, as I expected in the previous post . Currently, Gold is near the Potential Reversal Zone(PRZ) , the upper line of the Ascending Channel , Monthly Resistance(2) , and Yearly Resistance(1) .
According to the theory of Elliott waves , Gold seems to be completing microwave 5 of the main wave 5 . One of the confirmation signs of the end of wave 5 can be the breaking of the lower line of the ascending channel .
Also, we can see the Regular Divergence(RD-) between Consecutive Peaks .
I expect Gold to go down to at least $2,920 first after breaking the lower line of the ascending channel, and if the Support zone($2,915-$2,905) is broken, we should wait for an attack on the 100_SMA(1-hour) and the Support line .
Note: If Gold breaks the Potential Reversal Zone(PRZ) , we can expect more pumps.
Be sure to follow the updated ideas.
Gold Analyze ( XAUUSD ), 15-minute time frame.
Do not forget to put Stop loss for your positions (For every position you want to open).
Please follow your strategy; this is just my idea, and I will gladly see your ideas in this post.
Please do not forget the ✅' like '✅ button 🙏😊 & Share it with your friends; thanks, and Trade safe.

XAUUSD top-down analysis Hello traders, this is a complete multiple timeframe analysis of this pair. We see could find significant trading opportunities as per analysis upon price action confirmation we may take this trade. Smash the like button if you find value in this analysis and drop a comment if you have any questions or let me know which pair to cover in my next analysis.

Gold's Bear Trap—Ready for a Bullish Breakout?Today’s US inflation data came in hotter than expected, reinforcing concerns about persistent price pressures. Core CPI rose 0.4% (vs. 0.3% expected ), while headline CPI jumped 0.5% (vs. 0.3% expected ). Annual inflation also exceeded forecasts at 3.0%. In his speech , Fed Chair Powell signaled no urgency in cutting rates, further strengthening the US dollar ( TVC:DXY ).
According to the published US indexes , Gold ( OANDA:XAUUSD ) suddenly fell but started to rise again from the Support line and created a Bear Trap .
Educational Tip : Basically, after every Bull or Bear Trap , the market moves against the created Trap.
Gold is moving near the Support zone($2,889-$2,878) , 100_SMA(1-hour) and has managed to break the Resistance line , any pullback can be a good opportunity for us to take a Long position . Of course, you can enter the position in another way ( be sure to follow the capital management ).
According to Elliott's wave theory , Gold seems to have completed the Double Three Correction(WXY) . One of the signs of completion can be the breaking of the resistance line .
I expect Gold to attack the Resistance zone($2,915-$2,905) in the coming hours .
Note: If Gold breaks the Support zone($2,889-$2,878), we should expect more fall and break the support line. Especially if Gold goes below $2,863.
Be sure to follow the updated ideas.
Gold Analyze ( XAUUSD ), 15-minute time frame.
Do not forget to put Stop loss for your positions (For every position you want to open).
Please follow your strategy; this is just my idea, and I will gladly see your ideas in this post.
Please do not forget the ✅' like '✅ button 🙏😊 & Share it with your friends; thanks, and Trade safe.

XAUUSD Analysis TodayHello traders, this is a complete multiple timeframe analysis of this pair. We see could find significant trading opportunities as per analysis upon price action confirmation we may take this trade. Smash the like button if you find value in this analysis and drop a comment if you have any questions or let me know which pair to cover in my next analysis.

Gold trading zones: 13-Feb-2025Hey traders! Check out today's Gold trading zones and let's discuss potential opportunities.

GOLD (XAUUSD): One More Bullish Confirmation?!
After the release of the yesterday's US news, Gold went up again
Analyzing a 4H time frame, I see a completed inverted head and shoulders pattern.
Probabilities are high that growth will continue.
Goals: 2931 / 2942
❤️Please, support my work with like, thank you!❤️

Xauusd signal Gold prices bounce off daily lows and shift their focus to the key $2,900 mark per ounce troy despite a firmer US Dollar and the intense move higher in US yields across various maturity periods.
Xauusd signal 2895
TP1 sell 2890
TP2 sell 2870
Support zone sell 2860
Resistance buy 2906
Resistance buy 2925

GBPCHF FOR SCALPERS AND DAY TRADERS **3900 POINTS **Entry price ,stoploss and Target already marked in the chart itself FYI.
Guys pls like, share and follow my ideas .
Thank You All

Gold Price Analysis: Is a Deeper Pullback Coming?Since the beginning of the week, I have been writing that although the overall trend remains bullish, Gold is due for a correction.
Indeed, after a blow-off top to a new all-time high of 2943, the price started to decline and reached the confluence support zone at 2885.
At the time of writing, the price has returned to this support level, and there is a high probability of a break below this level, leading to a continuation of the correction.
In such a scenario, traders could anticipate a test of the 2840 support zone.
My strategy is to look for selling opportunities on rallies above 2900.
Disclosure: I am part of Trade Nation's Influencer program and receive a monthly fee for using their TradingView charts in my analysis.

CHECK XAUUSD ANALYSIS SIGNAL UPDATE > GO AND READ THE CAPTAINBaddy dears friends 👋🏼
XAUUSD trading signals technical analysis satup👇🏼
I think now XAUUSD ready for sell trade XAUUSD sell zone
( TRADE SATUP) 👇🏼
enter point (2890) to (2892) 📊
First tp (2885)📊
2nd target (2880)📊
Last target (2877) 📊
stop loss (2900)❌
Tachincal analysis satup
Fallow risk management
