#AUDCAD: Following a sell off, we might see price filling FVG. AUDCAD plummeted due to the NFP data, causing a record low price. However, it left a significant void area. The price has changed its behaviour, showing an increasing bullish presence. We only have one target where the price is likely to drop again heavily.
Good luck and trade safely. Like and comment for more!
Team Setupsfx_
Harmonic Patterns

25-.4-17 Silver 32.54 USD/Oz - long run!Silver produces a by signal which only happetnd every 20-30 Yeas.
A new Trend ist set. Ignore all the noises from last weeks.
Der quarterly Chart with the MA shows very impressive, when a new trend started.
Duration und gains were also very impressive. See remarks on the Chart.
Only a break below the MA30 will destroy the scenario. But no signs for that.
In my point of view: Buy Silver (physcial or on an ETF), have a good sleep and enjoy your time without any screeens ;-)
Silver will rock it.

USDJPY – Strong Bounce Incoming from Key Support?Price has tapped into a major support zone that’s held strong since early 2024. With confluence from the Fibonacci 0.618–0.65 retracement overhead, we could see a sharp bullish reversal targeting that region.
🟧 Strong support – historically reactive
📈 Potential bullish reversal in play
📊 Fib confluence at 152 – key reaction area
⏳ Watching for confirmation signs before entry
A clean structure here—could turn into a solid mid-term long setup.
Thoughts? Reversal or continuation lower?

A rejection near current resistanceEntry after confirmation of bearish momentum.
Confirm with momentum indicators (e.g., RSI divergence or MACD crossover)
Targeting a move back toward previous structure lows.

Trump Considers Firing Federal Reserve Chairman Jerome PowellTrump's Consideration to Fire Fed Chair Powell Sends Shockwaves Through Financial World 😲
Multiple sources reveal that Trump is exploring the possibility of firing Fed Chair Jerome Powell, sparking wide speculation 🤔. The two have long disagreed on monetary policy. Trump
repeatedly criticized Powell on social media, demanding immediate rate cuts ⬇️, while Powell emphasized the need to assess economic impacts before adjusting rates 📊.
Trump favors former Fed governor Kevin Warsh as a replacement, but Warsh advises against the firing 🚫. Legally, there’s no clear precedent for the president firing a Fed chair mid - term. Powell insists on Fed independence, stating that policy should be data - driven, not politically influenced 💼.
The White House is split on this issue. Treasury Secretary Mnuchin opposes the move, seeing Fed independence as crucial ⭐, while some advisors challenge Powell. This power struggle adds significant uncertainty to US and global financial markets 🌍, with the outcome set to reshape US economic policies ⚖️.
We will keep a close eye on this news.
Traders, if you're fond of this perspective or have your own insights regarding it, feel free to share in the comments. I'm really looking forward to reading your thoughts! 🤗
👇The accuracy rate of our daily signals has remained above 98% within a month! 📈 We sincerely welcome you to join our channel and share in the success with us! 🌟

BTC dominance : Breakout or Fakeout?Join our community and start your crypto journey today for:
In-depth market analysis
Accurate trade setups
Early access to trending altcoins
Life-changing profit potential
Let's analyze BTC dominance :
For four months, BTC dominance (BTC.D) has held a trendline support. After breaking out of an ascending triangle, BTC.D is forming another, with resistance at 62%-62.3%, repeatedly tested. A break above targets 64.50%, a strong resistance. Conversely, a trendline breakdown signals a potential drop to 59% support. Monitor these levels; a decisive break will heavily influence altcoin market dynamics.
Lower Support Levels:
59%-58.7%
Resistance Level:
62%-62.30%
64-50%
If you find this analysis helpful, please hit the like button to support my content! Share your thoughts in the comments, and feel free to request any specific chart analysis you’d like to see.
Happy Trading!!

Resistance in the downward channel of BitcoinIn today’s analysis, we examine Bitcoin’s price action as it continues to respect a descending channel pattern. With current price consolidating at the upper boundary of this channel, traders are now questioning whether BTC will break out or reject and rotate lower.
Key Points Covered in This Article:
- Bitcoin is currently consolidating at resistance of the descending channel
- A break of the recent swing low could lead to a drop to $67,400 support
- Confirmation of bullish breakout requires volume-backed move above channel resistance
Bitcoin is currently pressing into the top boundary of a descending channel, where resistance is holding firm. On the lower time frame, price action has entered a period of consolidation — a key sign of indecision. However, from a structural point of view, resistance remains resistance until broken. A failure to break through the upper boundary could accelerate downside momentum.
Should the current swing low be breached, traders can expect a move toward the lower boundary of this descending channel, situated around $67,400. This level will act as the next significant support, and it may provide a potential entry for reversal plays, depending on how price behaves upon reaching it.
For bullish continuation to occur, Bitcoin must decisively break above the descending channel with strong volume confirmation. Without this signal, any moves to the upside may be short-lived and potentially lead to liquidity grabs before another rotation lower. Traders should stay patient and wait for either a clear breakout or confirmation of further downside before entering positions.

Bitcoin Head and ShoulderAfter breakout trendline, Bitcoin performing HnS pattern
reversal signal after breakout and retest to trendline is valid if we can't back closed daily above 85k

IDFC FIRST LONG ON PULLBACKLOOKS GOOD ENOUGH TO BUY AT 60 TO 65 ZONE
Stoploss Is 49
Target 1 - 85
Target 2 - 100
Target 3 - 123
Long Term Investment
Upside 125 Huge Target

fun charts with TA BTCUSDTdiamond pattern measured move textbook says so (: possible move down to orderblock below


S&P500 Should the FED LEAVE POLITICS aside and finally cut??The S&P500 index (SPX, illustrated by the blue trend-line) has been under heavy selling pressure in the past 3 months, basically the start of the year, but Fed Chair Jerome Powell insisted once again yesterday that the Fed is on a wait-and-see mode, without the urge to cut rates. But can it afford not to do so?
A detailed look into the past 35 years of recorded Yield Curve (US10Y-US02Y) price action, shows that when it flattens and rebounds, the Fed steps in and cuts the interest rates (orange trend-line). It did so last year but paused/ stopped the process in an attempt to get Inflation (black trend-line) under control to the desired 2% target.
As you see on that 1M chart though, this hasn't always been beneficial for stocks as especially for September 2007 and January 2001, it took place parallel to the Housing and Dotcom Crises. This however happened both times when Inflation and Rates were both high.
The Inflation Rate now seems to be at a low level (and dropping) that has been consistent with market bottoms and not tops. As a result, it appears that it is more likely we are in a curve reversal that is consistent with bull trend continuation for the stock market, after short-term corrections, in our opinion either post March 2020 (COVID crash) or pre-2000, which is consistent to previous studies we've made that the current A.I. Bubble market is in similar early mania stages like the Dotcom Bubble in the early-mid 1990s.
So to answer the original question, we believe that the Fed can afford to cut the Interest Rates now and offset some of the medium-term slow in growth that the trade tariffs may inflict and as there are more probabilities it will do more good to the stock market than harm.
Your thoughts?
-------------------------------------------------------------------------------
** Please LIKE 👍, FOLLOW ✅, SHARE 🙌 and COMMENT ✍ if you enjoy this idea! Also share your ideas and charts in the comments section below! This is best way to keep it relevant, support us, keep the content here free and allow the idea to reach as many people as possible. **
-------------------------------------------------------------------------------
💸💸💸💸💸💸
👇 👇 👇 👇 👇 👇

EURJPY
Eurozone: European Central Bank (ECB)
Current Head: Christine Lagarde (President since November 2019)
Recent Policy Stance:
On April 17, 2025, the ECB unanimously decided to cut its three key interest rates by 25 basis points, including the deposit facility rate, signaling a dovish monetary policy stance aimed at supporting growth amid deteriorating economic outlook and rising trade tensions. Inflation in the euro area is declining and expected to settle around the 2% medium-term target, with wage growth moderating and services inflation easing. However, the ECB remains data-dependent and cautious, emphasizing a meeting-by-meeting approach without committing to a fixed rate path. The rate cut reflects concerns about weakening growth and tighter financing conditions due to global uncertainties and trade tensions.
Directional Bias:
The ECB is currently easing monetary policy, indicating a dovish bias to stimulate growth and ensure inflation stabilizes sustainably at target. This suggests a softer euro in the near term, as rate cuts typically reduce currency appeal relative to higher-yielding currencies.
Japan: Bank of Japan (BoJ)
Current Head: Haruhiko Kuroda (Governor since March 2013; note: no recent change indicated in the search results)
Policy Context (inferred from current macroeconomic environment and typical BoJ stance):
The BoJ has historically maintained an ultra-loose monetary policy with negative interest rates and yield curve control to support inflation and economic growth. Given global uncertainties and persistent low inflation in Japan, the BoJ is likely to maintain or cautiously adjust its accommodative stance.
Directional Bias:
The BoJ’s policy remains highly accommodative/dovish, aiming to stimulate inflation and growth. This generally keeps the Japanese yen relatively weaker compared to currencies of countries tightening monetary policy. However, if global risk aversion rises, the yen may strengthen as a safe-haven currency.
Summary Table
Central Bank Head Recent Policy Action Directional Bias Likely Currency Impact
European Central Bank Christine Lagarde 25 bps rate cut (April 2025) Dovish, easing Euro likely to weaken near term
Bank of Japan Haruhiko Kuroda Maintains ultra-loose policy Dovish, accommodative Yen generally weak, but safe-haven demand possible
Conclusion
The ECB under Christine Lagarde is easing policy with rate cuts to address slowing growth and inflation nearing target, signaling a dovish bias that may pressure the euro lower in the short term.
The BoJ under Haruhiko Kuroda continues an accommodative stance to stimulate inflation, keeping the yen subdued except during risk-off episodes when it can strengthen as a safe haven.
Investors should watch incoming data closely as both central banks emphasize data dependency, making their future moves contingent on inflation and growth developments amid global uncertainties.

Sui My idea long to 2.48ish. I believe people will start shorting very prematurely leading to a short squeeze. When people are flipping bias. We will see a correction

RAFAQAT X UMAR CRVAs of April 18, 2025, Curve DAO Token (CRV) is exhibiting a neutral technical stance across multiple timeframes.
en.arincen.com
+9
TradingView
+9
TradingView
+9
Price Overview:
Current Price: Approximately $0.9999 USD, maintaining its peg to the US Dollar.
MarketBeat
+3
CoinMarketCap
+3
Gate.io
+3
24-Hour Trading Volume: Around $9.99 million.
CoinMarketCap
Technical Indicators:
Relative Strength Index (RSI): 51.87, indicating a neutral momentum.
TradingView
+7
Free Crypto Screener
+7
MarketScreener
+7
Stochastic Oscillator: 5.95, suggesting a potential buying opportunity.
TradingView
MACD: 0.0007840, showing a neutral trend.
SoSoValue
+5
Free Crypto Screener
+5
TradingView
+5
Williams %R: -94.16, indicating the asset is in the oversold territory.
Free Crypto Screener
Moving Averages:
SMA20: 0.9992, aligning closely with the current price.
Free Crypto Screener
SMA50: 0.9969, slightly below the current price, suggesting short-term support.
SMA100: 0.9924, indicating a stable medium-term trend.
en.arincen.com
SMA200: 0.9854, reflecting long-term stability.
Free Crypto Screener
Market Sentiment:
The technical indicators present a mixed outlook, with some suggesting potential buying opportunities while others remain neutral. Given CRV's nature as a stablecoin, significant price fluctuations are uncommon, and its value remains closely tied to the US Dollar.
CoinMarketCap
Conclusion:
CRV is currently maintaining its stability, with technical indicators reflecting a balanced market sentiment. Investors should monitor for any changes in market conditions or technical signals that could indicate a shift in trend.

ETH LONG ETHEREUM is breaking the 6h trend line as we speak... next step 1600
ETH HAS A MAJOR UPDATE at 7 may PECTRA is coming fees will be lower than Solana

INTEL CORPORATIONIntel’s stock has been falling sharply due to a combination of poor financial performance, strategic challenges, and market pressures, which have shaken investor confidence significantly.
Key Reasons for Intel’s Stock Decline
Weaker-than-Expected Earnings and Profitability Issues
Intel reported disappointing earnings in 2024, with sales declining 2% year-over-year to $53.1 billion and gross margins under pressure. The company’s foundry business, a critical growth area, saw sales fall from $18.9 billion in 2023 to $17.5 billion in 2024. Analysts expect continued margin headwinds and limited revenue growth opportunities in the near term, which weighs heavily on the stock.
Cost-Cutting and Dividend Suspension
To address financial challenges, Intel announced a $10 billion cost-reduction plan, including cutting 15,000 jobs and suspending dividend payments starting Q4 2024. While necessary to preserve liquidity and fund restructuring, these moves have alarmed investors, signaling deeper operational issues and reducing shareholder returns.
Leadership Changes and Strategic Uncertainty
CEO Pat Gelsinger was replaced by Lip-Bu Tan in March 2025 amid ongoing struggles. The new leadership faces the difficult task of turning around the foundry business and improving Intel’s competitiveness in AI chips and manufacturing. However, uncertainty about the effectiveness of these efforts has dampened investor enthusiasm.
Lagging Behind Competitors in AI and Manufacturing
Intel has been slow to capitalize on the AI boom compared to rivals like Nvidia, which has surged ahead with AI-focused chips. Additionally, Intel’s manufacturing technology lags behind Taiwan Semiconductor Manufacturing Company (TSMC), limiting its ability to produce cutting-edge chips cost-effectively. This has led to market share losses, especially in PC CPUs, where AMD is gaining ground.
Geopolitical and Market Risks
Rising US-China tensions and new Chinese tariffs on semiconductor imports pose risks to Intel’s revenue, given its exposure to the Chinese market. Moreover, concerns about the semiconductor supply chain and the viability of Intel’s joint ventures with TSMC add to investor uncertainty.
Valuation and Investor Sentiment
Intel’s price-to-book ratio is near multiyear lows (~0.8), reflecting market skepticism about its asset utilization and future profitability. Its return on equity has declined steadily, contrasting with competitors that have benefited from the AI surge. Despite undervaluation, the stock’s poor recent performance and bleak near-term outlook continue to pressure the price.
Summary
Factor Impact on Intel Stock
Weak earnings and margin pressure Significant negative
Job cuts and dividend suspension Negative, signals financial stress
Leadership change and strategy uncertainty Adds volatility and risk
Falling behind in AI and manufacturing Loss of market share, investor concern
Geopolitical tensions and tariffs Adds downside risk
Low valuation but poor ROE Indicates undervaluation but cautious sentiment
Conclusion
Intel’s stock is falling badly due to disappointing financial results, strategic challenges in manufacturing and AI, cost-cutting measures that unsettle investors, and geopolitical risks. While the company is attempting a turnaround under new leadership, uncertainty about the success of these efforts and continued competitive pressures keep investor confidence low. The stock’s valuation reflects these concerns, and a sustained recovery will depend on Intel’s ability to improve profitability, regain market share, and capitalize on AI and foundry opportunities

BITCOIN's secret catalyst. The Gold-to-Crypto Rotation Is ComingBitcoin (BTCUSD) is attempting to form a new medium-term bottom here, following the Tariffs-led sell-off of the past 2 months. While the crypto market is consolidating and accumulating, the Gold market is smashing every historic All Time High (ATH) after the other.
This is not the first time we see this divergence between Gold and BTC and this is what historically delivers what we call 'Gold-to-Crypto Rotation'. This happens when Gold peaks, making its Bull Cycle Top, initiating a capital transition to BTC, hence starting the final rally of its Bull Cycle.
This has already taken place 3 times in its short history and Gold's sheer ferocity of the 2025 rally, indicates that we may possibly be about to repeat another one.
So what do you think is Gold about to top and offer a mass exodus a capital to Bitcoin, hence kickstarting a massive rally? Feel free to let us know in the comments section below!
-------------------------------------------------------------------------------
** Please LIKE 👍, FOLLOW ✅, SHARE 🙌 and COMMENT ✍ if you enjoy this idea! Also share your ideas and charts in the comments section below! This is best way to keep it relevant, support us, keep the content here free and allow the idea to reach as many people as possible. **
-------------------------------------------------------------------------------
💸💸💸💸💸💸
👇 👇 👇 👇 👇 👇

silver long term - buyElliot wave analysis suggests a correction ending around 28.25 or 26.20.
We need a short-term bullish retracement before continuing the downtrend towards our sell TP at 28.25.
If the price respects this area, a new uptrend is possible.
This is a long-term analysis.

SILVERSilver’s role as both an industrial metal and a monetary asset has driven significant price momentum in 2025, with spot prices rising 14% year-to-date to $34.10/oz. This rally reflects a combination of structural demand growth and shifting macroeconomic conditions. Below is an analysis of silver’s key use cases and future directional bias.
Silver’s Primary Use Cases
Industrial Applications (55–60% of Demand)
Solar Energy: Silver is critical for photovoltaic cells, with each solar panel using ~20 grams. Global solar installations (up 34% in 2024) are driving record demand, projected to consume 85–98% of current reserves by 2050.
Electronics & EVs: Used in semiconductors, 5G infrastructure, and electric vehicles (EVs contain 2× more silver than ICE vehicles).
Medical: Antimicrobial properties make it vital for wound dressings and medical devices.
Investment Demand (25–30% of Demand)
Safe-Haven Asset: Geopolitical tensions and monetary easing have boosted silver’s appeal as a hedge against inflation and currency devaluation.
Monetary Metal: Central banks, including Russia, are adding silver to reserves ($535M planned over 3 years).
Jewelry & Silverware (15–20% of Demand)
Cultural demand in India and China remains steady, though secondary to industrial and investment uses.
Future Directional Bias: Bullish Fundamentals
Key Drivers Supporting Higher Prices
Supply-Demand Deficit: The silver market is in its fifth consecutive annual deficit (1.05B oz supply vs. 1.2B oz demand in 2025), depleting above-ground inventories.
Green Energy Transition: Solar and EV sectors could increase silver demand by 20% annually through 2030.
Gold-Silver Ratio: The ratio of 88:1 (vs. historical ~70:1) suggests silver is undervalued relative to gold, with analysts targeting $40–$52.50 by 2026.
Monetary Policy: Expected Fed rate cuts in 2025 may weaken the USD, boosting silver’s appeal as a non-yielding asset.
Economic Slowdown: Reduced industrial activity could temporarily dampen demand.
Substitution Threats: Cheaper alternatives (e.g., aluminum in solar panels) may emerge.
Mining Supply: Stagnant production (3% growth in 2025) risks exacerbating deficits.
Conclusion
Silver’s dual role in green technology and monetary systems positions it for sustained bullish momentum. With industrial demand hitting record highs, supply struggling to keep pace, and investment inflows accelerating, prices are likely to test $35–$40 by late 2025. Traders should monitor Fed policy, solar/EV adoption rates, and inventory levels for confirmation of this trajectory.

[XRP] 2025.04.18***Follow SEOVEREIGN to receive real-time alerts.
**Boosts help SEOVEREIGN continue analyzing more assets.
**Our team regularly publishes in-depth reports on the cryptocurrency market.
XRP has been showing a steady upward trend after establishing support near the 2.04 level.
The current chart structure is interpreted as part of a B-wave correction phase, which may serve as a foundation for a potential medium-term bullish reversal.
A detailed wave count has been marked in the idea for further reference.
Projected target levels are as follows:
First target: 2.1665
Second target: 2.2478
Third target: 2.2751
In the short term, a double bottom formation has been identified, and a sustained rebound is likely to unfold from this support structure.
This setup provides a strong basis for defining key levels within the medium-term bullish scenario, and offers valuable signals for anticipating the next wave progression.

ETH - Log long Chart!Hello TradingView Family / Fellow Traders. This is Richard, also known as theSignalyst.
Let’s keep it simple! ⚡
📈 ETH is approaching a major structure and potential rejection zone marked in blue.
As long as this key support holds, the long-term bullish bias remains intact.
It’s only a matter of time before the bulls step in — confirmation will come from lower timeframes. 👀
📚 Always follow your trading plan regarding entry, risk management, and trade management.
Good luck!
All Strategies Are Good; If Managed Properly!
~Rich

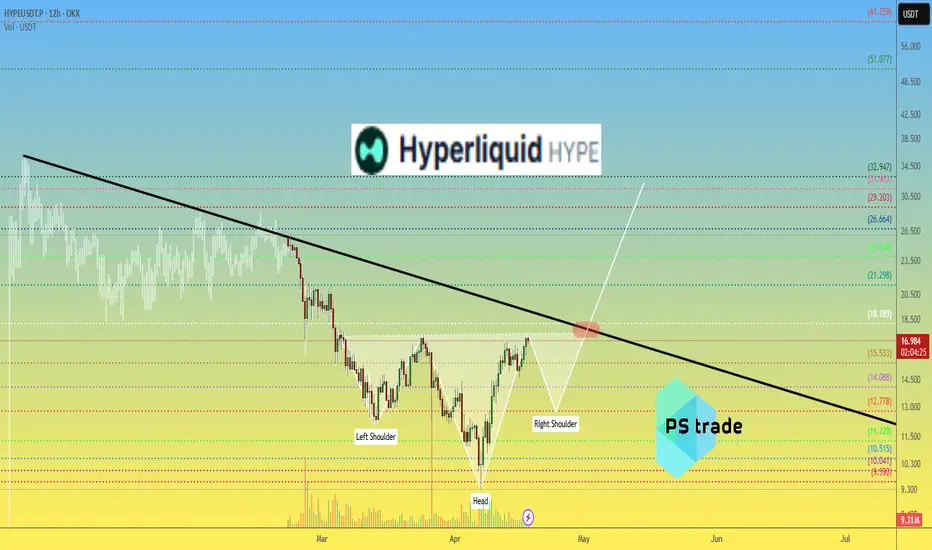
Hyperliquid HYPE price analysisLooking at the OKX:HYPEUSDT.P chart, we can assume that the cryptocurrency market is likely to start #Hype's in May.
🔼 The capitalization of the #Hyperliquid project is already quite large in the current realities - $5.6 billion, so the forecast for x2 growth is quite optimistic-realistic.
And so, all the key levels are on the chart!)
🥚 Have a nice Easter holiday
_____________________
Did you like our analysis? Leave a comment, like, and follow to get more
Total Market Cap Weekly Structure to FollowLittle idea of mine on how the structure of TMC may form based on previous moves.
