silver long term - buyElliot wave analysis suggests a correction ending around 28.25 or 26.20.
We need a short-term bullish retracement before continuing the downtrend towards our sell TP at 28.25.
If the price respects this area, a new uptrend is possible.
This is a long-term analysis.
Harmonic Patterns

SILVERSilver’s role as both an industrial metal and a monetary asset has driven significant price momentum in 2025, with spot prices rising 14% year-to-date to $34.10/oz. This rally reflects a combination of structural demand growth and shifting macroeconomic conditions. Below is an analysis of silver’s key use cases and future directional bias.
Silver’s Primary Use Cases
Industrial Applications (55–60% of Demand)
Solar Energy: Silver is critical for photovoltaic cells, with each solar panel using ~20 grams. Global solar installations (up 34% in 2024) are driving record demand, projected to consume 85–98% of current reserves by 2050.
Electronics & EVs: Used in semiconductors, 5G infrastructure, and electric vehicles (EVs contain 2× more silver than ICE vehicles).
Medical: Antimicrobial properties make it vital for wound dressings and medical devices.
Investment Demand (25–30% of Demand)
Safe-Haven Asset: Geopolitical tensions and monetary easing have boosted silver’s appeal as a hedge against inflation and currency devaluation.
Monetary Metal: Central banks, including Russia, are adding silver to reserves ($535M planned over 3 years).
Jewelry & Silverware (15–20% of Demand)
Cultural demand in India and China remains steady, though secondary to industrial and investment uses.
Future Directional Bias: Bullish Fundamentals
Key Drivers Supporting Higher Prices
Supply-Demand Deficit: The silver market is in its fifth consecutive annual deficit (1.05B oz supply vs. 1.2B oz demand in 2025), depleting above-ground inventories.
Green Energy Transition: Solar and EV sectors could increase silver demand by 20% annually through 2030.
Gold-Silver Ratio: The ratio of 88:1 (vs. historical ~70:1) suggests silver is undervalued relative to gold, with analysts targeting $40–$52.50 by 2026.
Monetary Policy: Expected Fed rate cuts in 2025 may weaken the USD, boosting silver’s appeal as a non-yielding asset.
Economic Slowdown: Reduced industrial activity could temporarily dampen demand.
Substitution Threats: Cheaper alternatives (e.g., aluminum in solar panels) may emerge.
Mining Supply: Stagnant production (3% growth in 2025) risks exacerbating deficits.
Conclusion
Silver’s dual role in green technology and monetary systems positions it for sustained bullish momentum. With industrial demand hitting record highs, supply struggling to keep pace, and investment inflows accelerating, prices are likely to test $35–$40 by late 2025. Traders should monitor Fed policy, solar/EV adoption rates, and inventory levels for confirmation of this trajectory.

[XRP] 2025.04.18***Follow SEOVEREIGN to receive real-time alerts.
**Boosts help SEOVEREIGN continue analyzing more assets.
**Our team regularly publishes in-depth reports on the cryptocurrency market.
XRP has been showing a steady upward trend after establishing support near the 2.04 level.
The current chart structure is interpreted as part of a B-wave correction phase, which may serve as a foundation for a potential medium-term bullish reversal.
A detailed wave count has been marked in the idea for further reference.
Projected target levels are as follows:
First target: 2.1665
Second target: 2.2478
Third target: 2.2751
In the short term, a double bottom formation has been identified, and a sustained rebound is likely to unfold from this support structure.
This setup provides a strong basis for defining key levels within the medium-term bullish scenario, and offers valuable signals for anticipating the next wave progression.

ETH - Log long Chart!Hello TradingView Family / Fellow Traders. This is Richard, also known as theSignalyst.
Let’s keep it simple! ⚡
📈 ETH is approaching a major structure and potential rejection zone marked in blue.
As long as this key support holds, the long-term bullish bias remains intact.
It’s only a matter of time before the bulls step in — confirmation will come from lower timeframes. 👀
📚 Always follow your trading plan regarding entry, risk management, and trade management.
Good luck!
All Strategies Are Good; If Managed Properly!
~Rich

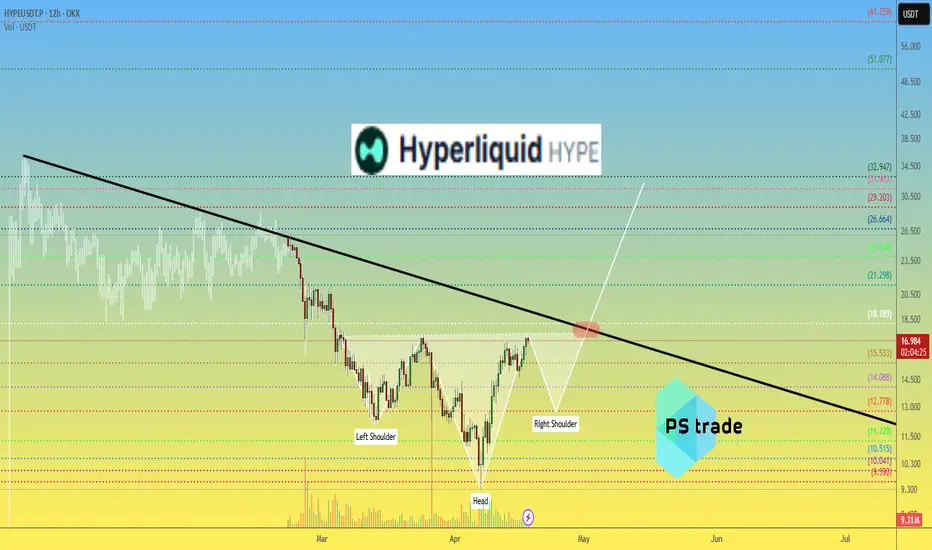
Hyperliquid HYPE price analysisLooking at the OKX:HYPEUSDT.P chart, we can assume that the cryptocurrency market is likely to start #Hype's in May.
🔼 The capitalization of the #Hyperliquid project is already quite large in the current realities - $5.6 billion, so the forecast for x2 growth is quite optimistic-realistic.
And so, all the key levels are on the chart!)
🥚 Have a nice Easter holiday
_____________________
Did you like our analysis? Leave a comment, like, and follow to get more
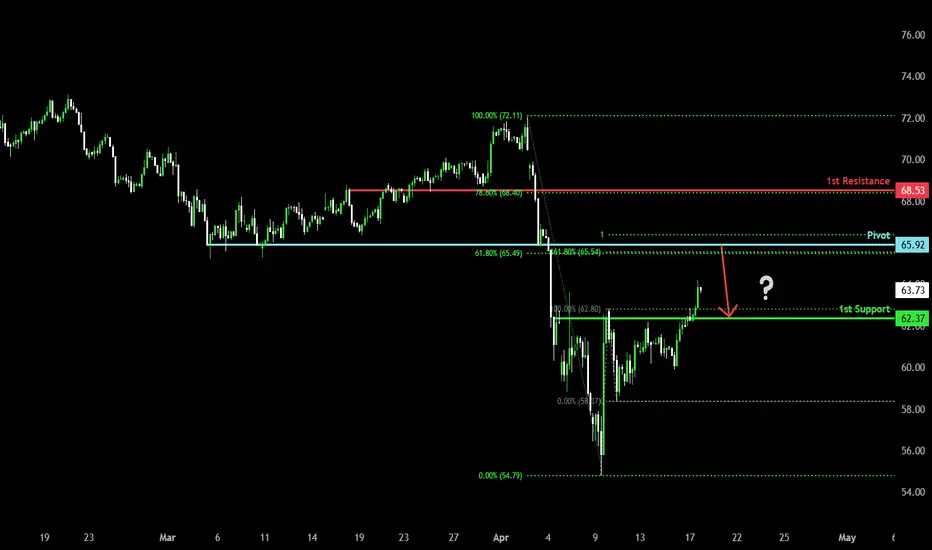
Bearish reversal?WTI Oil (XTI/USD) is rising towards the pivot and could reverse to the 1st support.
Pivot: 65.92
1st Support: 62.37
1st Resistance: 68.53
Risk Warning:
Trading Forex and CFDs carries a high level of risk to your capital and you should only trade with money you can afford to lose. Trading Forex and CFDs may not be suitable for all investors, so please ensure that you fully understand the risks involved and seek independent advice if necessary.
Disclaimer:
The above opinions given constitute general market commentary, and do not constitute the opinion or advice of IC Markets or any form of personal or investment advice.
Any opinions, news, research, analyses, prices, other information, or links to third-party sites contained on this website are provided on an "as-is" basis, are intended only to be informative, is not an advice nor a recommendation, nor research, or a record of our trading prices, or an offer of, or solicitation for a transaction in any financial instrument and thus should not be treated as such. The information provided does not involve any specific investment objectives, financial situation and needs of any specific person who may receive it. Please be aware, that past performance is not a reliable indicator of future performance and/or results. Past Performance or Forward-looking scenarios based upon the reasonable beliefs of the third-party provider are not a guarantee of future performance. Actual results may differ materially from those anticipated in forward-looking or past performance statements. IC Markets makes no representation or warranty and assumes no liability as to the accuracy or completeness of the information provided, nor any loss arising from any investment based on a recommendation, forecast or any information supplied by any third-party.
Total Market Cap Weekly Structure to FollowLittle idea of mine on how the structure of TMC may form based on previous moves.

BTC dominance : Breakout or Fakeout?Join our community and start your crypto journey today for:
In-depth market analysis
Accurate trade setups
Early access to trending altcoins
Life-changing profit potential
Let's analyze BTC dominance :
For four months, BTC dominance (BTC.D) has held a trendline support. After breaking out of an ascending triangle, BTC.D is forming another, with resistance at 62%-62.3%, repeatedly tested. A break above targets 64.50%, a strong resistance. Conversely, a trendline breakdown signals a potential drop to 59% support. Monitor these levels; a decisive break will heavily influence altcoin market dynamics.
Lower Support Levels:
59%-58.7%
Resistance Level:
62%-62.30%
64-50%
If you find this analysis helpful, please hit the like button to support my content! Share your thoughts in the comments, and feel free to request any specific chart analysis you’d like to see.
Happy Trading!!

FILUSDT-Analysis-WeeeklyIn the Weekly timeframe FILUSDT reached a powerful reverse point
** No FUTURES **
Target = 7.5$

EURUSDU 4/18/2025 IdeasUpdated trade from earlier after relooking at analysis. Expecting price to take PDH into HTF SELL POI to continue selling down to POIS. TP is PDL. If price goes down to buy areas, we shift to buys

[BTC] 2025.04.18Greetings. It’s a pleasure to reconnect with you.
Before diving into altcoin analysis, we believe it is essential to first address Bitcoin, as it remains the key driver in determining the overall market direction.
Since the beginning of 2025, Bitcoin has been in a prolonged consolidation phase accompanied by a downward trend. In an effort to identify a potential bottom for this correction, we have closely monitored the market over the past three months.
Initially, our team identified the period around March 10 as a likely inflection point for a bullish reversal and prepared a related analysis idea. However, we refrained from publishing it, as the movements of key altcoins—which typically serve as leading indicators—did not align with our internal criteria.
As anticipated, the market went on to form another low. We now believe that April 7 marked not just a temporary bounce, but a potential structural pivot point in the broader trend.
The rationale behind this assessment is outlined in detail below. We appreciate your time and hope you find the insights valuable.
We believe the logical starting point is to examine the key highs that have formed during this cycle.
Among the two major peaks—referred to here as “Point 1” and “Point 2”—it is critical to determine which marks the termination of the fifth wave. This distinction plays a pivotal role in accurately interpreting the subsequent wave structure.
If Point 1 is the conclusion of the fifth wave, then Point 2 can be naturally understood as the terminal point of a corrective B wave.
Conversely, if Point 2 represents the end of the fifth wave, then the decline that followed is likely the beginning of a corrective A wave.
To validate this, we conducted a detailed analysis based on Fibonacci retracement and extension ratios. The results showed that Point 2 did not align well with any major wave theory frameworks. Its price structure and time proportion appeared incomplete and inconsistent.
In contrast, Point 1 exhibited a high degree of confluence with multiple classical wave theories, including Glenn Neely’s NEoWave principles. Structurally, it demonstrated the typical characteristics of a completed five-wave advance.
Based on this evidence, we conclude that Point 1 is the more valid candidate for the fifth wave termination. Consequently, we believe any analysis of the current market structure should build upon this interpretation.
To further clarify the interpretation of the key peak,
we present two possible scenarios using Fibonacci ratios as the analytical foundation.
These scenarios are illustrated as the red path and the blue path,
each representing a different wave development depending on the subsequent market movement.
However, the key takeaway is that both scenarios converge on a single conclusion:
“Point 1” marks the completion of a full wave cycle,
and can thus be identified as the termination point of the fifth wave.
While the detailed wave progression may evolve depending on how the market unfolds,
recognizing that a major top has already been established is essential for shaping any mid-to-long-term strategy.
This structural understanding serves as a critical anchor in the broader market outlook.
Having previously identified “Point 2” as the likely termination of the B wave,
our current focus shifts to pinpointing the end of the C wave—
in other words, the optimal buying zone within the corrective structure.
Our team initially regarded the period around March 10 as a strong candidate for the conclusion of the C wave.
However, due to insufficient synchronicity across the broader market—
particularly the lack of confirmation from key altcoins—
we concluded that this point did not represent a genuine inflection.
※ Our analysis is based not on individual coins but on a comprehensive structural assessment of the overall market.
As a result, we extended our observation period.
A clear and confident reversal signal was finally detected around April 7.
In hindsight, the March 10 low proved to be a false bottom, marked only by a temporary rebound,
whereas the true structural pivot materialized in early April.
With this in mind, we believe the market is now entering a phase where a full wave reversal is plausible,
and it is time to begin formulating a strategic entry plan in alignment with this outlook.
Now, let us evaluate whether the second low (April 7)
qualifies as the true termination point of the C wave.
From a technical standpoint, the preceding decline exhibits the hallmarks of an Ending Diagonal—
a classic pattern frequently observed at the conclusion of C waves.
This structure serves as a strong technical signal that the wave sequence is entering its final stage,
indicating not just a temporary rebound, but the potential for a structural trend reversal.
Considering both the wave characteristics and the timing context,
we believe there is sufficient evidence to regard the April 7 low not merely as a short-term bottom,
but as the culmination of the C wave—and more importantly, the starting point of a major reversal in the broader trend.
Finally, to further reinforce the technical foundation of our analysis,
we turn to harmonic pattern analysis.
By applying a range of Fibonacci ratios between the start and termination of the B wave,
we have identified a remarkably precise Deep Crab pattern—
one of the most powerful reversal signals among all harmonic structures.
Notably, the current price action has landed directly within the PRZ (Potential Reversal Zone),
strongly suggesting that the timing for a strategic long position is ripe.
In summary, we now have a confluence of three compelling signals:
A clear Ending Diagonal structure at the tail end of the C wave,
A significant inflection point formed around April 7,
And a textbook Deep Crab harmonic pattern confirming the reversal zone.
These three elements align cohesively to provide a well-founded justification for initiating long exposure.
There is no longer a reason for hesitation.
Assuming appropriate risk management is in place,
we believe this is a moment to enter with confidence.
Thank you sincerely for reading this analysis in full.
We will continue to provide high-quality, data-driven market insights,
rooted in both structural depth and technical precision.
If our perspective resonates with your approach to the market,
we warmly invite you to follow our work and stay connected.
Your support and engagement are what fuel our continued efforts.
See you in the next idea.

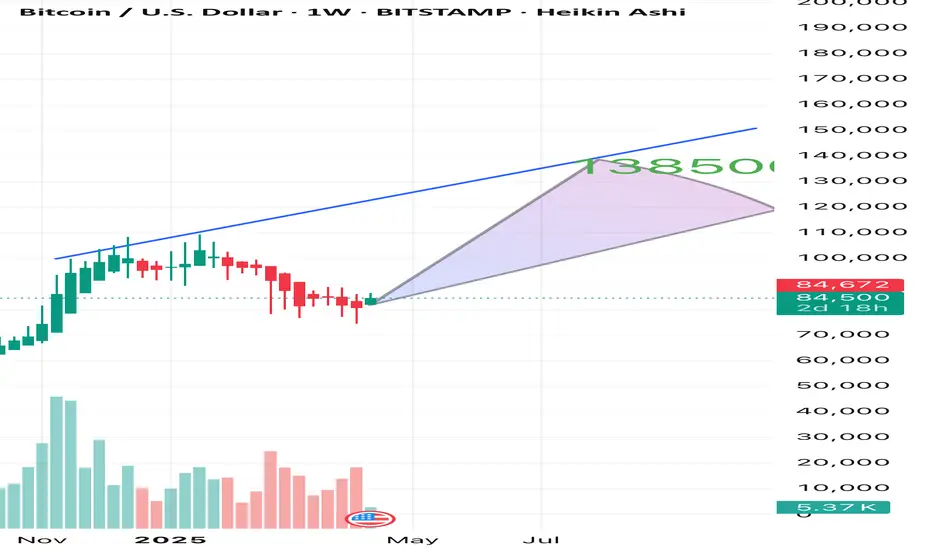
138500 next couple of week Bitcoin bullish now we will pump any time to soon in few months we will around 138500 area of resistance to test so this extra pumped
EURUSD 4/18/2025EU sell to POIS. Target is PDL. Sell loss is at strong high to be safe just incase price wants to take out pdh before continuing down. Sell area is 1hr/15min POI

18.04.25 Morning ForecastPairs on Watch -
FX:NZDUSD
FX:AUDUSD
FX:EURNZD
FX:USDJPY
A short overview of the instruments I am looking at for today, multi-timeframe analysis down to what I will be looking at for an entry. Enjoy!

SeiUsdt LongTradeable idea, this pair broke through the trendline and it considiladated above it, look to open long positions from here.

OPUSDT 3D AnalysisOP ~ 3D Analysis
#OP Buy gradually from here if you still have a Conviction on this coin with a short -term target of at least 15%+ from here.

Could the price bounce from here?GBP/AUD is falling towards the pivot which is an overlap support and could bounce to the 1st resistance which acts as an overlap resistance.
Pivot: 2.0624
1st Support: 2.0413
1st Resistance: 2.1029
Risk Warning:
Trading Forex and CFDs carries a high level of risk to your capital and you should only trade with money you can afford to lose. Trading Forex and CFDs may not be suitable for all investors, so please ensure that you fully understand the risks involved and seek independent advice if necessary.
Disclaimer:
The above opinions given constitute general market commentary, and do not constitute the opinion or advice of IC Markets or any form of personal or investment advice.
Any opinions, news, research, analyses, prices, other information, or links to third-party sites contained on this website are provided on an "as-is" basis, are intended only to be informative, is not an advice nor a recommendation, nor research, or a record of our trading prices, or an offer of, or solicitation for a transaction in any financial instrument and thus should not be treated as such. The information provided does not involve any specific investment objectives, financial situation and needs of any specific person who may receive it. Please be aware, that past performance is not a reliable indicator of future performance and/or results. Past Performance or Forward-looking scenarios based upon the reasonable beliefs of the third-party provider are not a guarantee of future performance. Actual results may differ materially from those anticipated in forward-looking or past performance statements. IC Markets makes no representation or warranty and assumes no liability as to the accuracy or completeness of the information provided, nor any loss arising from any investment based on a recommendation, forecast or any information supplied by any third-party.

Bearish drop?Ethereum (ETH/USD) is reacting off the pivot and could drop to the 1st support.
Pivot: 1,570.37
1st Support: 1,437.45
1st Resistance: 1,685.57
Risk Warning:
Trading Forex and CFDs carries a high level of risk to your capital and you should only trade with money you can afford to lose. Trading Forex and CFDs may not be suitable for all investors, so please ensure that you fully understand the risks involved and seek independent advice if necessary.
Disclaimer:
The above opinions given constitute general market commentary, and do not constitute the opinion or advice of IC Markets or any form of personal or investment advice.
Any opinions, news, research, analyses, prices, other information, or links to third-party sites contained on this website are provided on an "as-is" basis, are intended only to be informative, is not an advice nor a recommendation, nor research, or a record of our trading prices, or an offer of, or solicitation for a transaction in any financial instrument and thus should not be treated as such. The information provided does not involve any specific investment objectives, financial situation and needs of any specific person who may receive it. Please be aware, that past performance is not a reliable indicator of future performance and/or results. Past Performance or Forward-looking scenarios based upon the reasonable beliefs of the third-party provider are not a guarantee of future performance. Actual results may differ materially from those anticipated in forward-looking or past performance statements. IC Markets makes no representation or warranty and assumes no liability as to the accuracy or completeness of the information provided, nor any loss arising from any investment based on a recommendation, forecast or any information supplied by any third-party.

Bearish drop off 50% Fibonacci resistance?USTEC is rising towards the pivot and could reverse to the pullback support.
Pivot: 18,606.32
1st Support: 17,788.70
1st Resistance: 18,942.56
Risk Warning:
Trading Forex and CFDs carries a high level of risk to your capital and you should only trade with money you can afford to lose. Trading Forex and CFDs may not be suitable for all investors, so please ensure that you fully understand the risks involved and seek independent advice if necessary.
Disclaimer:
The above opinions given constitute general market commentary, and do not constitute the opinion or advice of IC Markets or any form of personal or investment advice.
Any opinions, news, research, analyses, prices, other information, or links to third-party sites contained on this website are provided on an "as-is" basis, are intended only to be informative, is not an advice nor a recommendation, nor research, or a record of our trading prices, or an offer of, or solicitation for a transaction in any financial instrument and thus should not be treated as such. The information provided does not involve any specific investment objectives, financial situation and needs of any specific person who may receive it. Please be aware, that past performance is not a reliable indicator of future performance and/or results. Past Performance or Forward-looking scenarios based upon the reasonable beliefs of the third-party provider are not a guarantee of future performance. Actual results may differ materially from those anticipated in forward-looking or past performance statements. IC Markets makes no representation or warranty and assumes no liability as to the accuracy or completeness of the information provided, nor any loss arising from any investment based on a recommendation, forecast or any information supplied by any third-party.

Bullish bounce?DAX40 (DE40) is falling towards the pivot which acts as a pullback support and could bounce to the 1st resistance which has been identified as a pullback resistance.
Pivot: 20,786.83
1st Support: 20,370.22
1st Resistance: 21,784.20
Risk Warning:
Trading Forex and CFDs carries a high level of risk to your capital and you should only trade with money you can afford to lose. Trading Forex and CFDs may not be suitable for all investors, so please ensure that you fully understand the risks involved and seek independent advice if necessary.
Disclaimer:
The above opinions given constitute general market commentary, and do not constitute the opinion or advice of IC Markets or any form of personal or investment advice.
Any opinions, news, research, analyses, prices, other information, or links to third-party sites contained on this website are provided on an "as-is" basis, are intended only to be informative, is not an advice nor a recommendation, nor research, or a record of our trading prices, or an offer of, or solicitation for a transaction in any financial instrument and thus should not be treated as such. The information provided does not involve any specific investment objectives, financial situation and needs of any specific person who may receive it. Please be aware, that past performance is not a reliable indicator of future performance and/or results. Past Performance or Forward-looking scenarios based upon the reasonable beliefs of the third-party provider are not a guarantee of future performance. Actual results may differ materially from those anticipated in forward-looking or past performance statements. IC Markets makes no representation or warranty and assumes no liability as to the accuracy or completeness of the information provided, nor any loss arising from any investment based on a recommendation, forecast or any information supplied by any third-party.

Bearish drop?Dow Jones (US30) is reacting off the pivot nd could drop to the 1st support that lines up with the 61.8% Fibonacci extension.
Pivot: 39,291.00
1st Support: 37,024.36
1st Resistance: 40,624.32
Risk Warning:
Trading Forex and CFDs carries a high level of risk to your capital and you should only trade with money you can afford to lose. Trading Forex and CFDs may not be suitable for all investors, so please ensure that you fully understand the risks involved and seek independent advice if necessary.
Disclaimer:
The above opinions given constitute general market commentary, and do not constitute the opinion or advice of IC Markets or any form of personal or investment advice.
Any opinions, news, research, analyses, prices, other information, or links to third-party sites contained on this website are provided on an "as-is" basis, are intended only to be informative, is not an advice nor a recommendation, nor research, or a record of our trading prices, or an offer of, or solicitation for a transaction in any financial instrument and thus should not be treated as such. The information provided does not involve any specific investment objectives, financial situation and needs of any specific person who may receive it. Please be aware, that past performance is not a reliable indicator of future performance and/or results. Past Performance or Forward-looking scenarios based upon the reasonable beliefs of the third-party provider are not a guarantee of future performance. Actual results may differ materially from those anticipated in forward-looking or past performance statements. IC Markets makes no representation or warranty and assumes no liability as to the accuracy or completeness of the information provided, nor any loss arising from any investment based on a recommendation, forecast or any information supplied by any third-party.

Bullish bounce off overlap support?The Silver (XAG/USD) is falling towards the pivot which is an overlap support and could bounce to the 1st resistance which is also an overlap resistance.
Pivot: 31.90
1st Support: 31.27
1st Resistance: 33.11
Risk Warning:
Trading Forex and CFDs carries a high level of risk to your capital and you should only trade with money you can afford to lose. Trading Forex and CFDs may not be suitable for all investors, so please ensure that you fully understand the risks involved and seek independent advice if necessary.
Disclaimer:
The above opinions given constitute general market commentary, and do not constitute the opinion or advice of IC Markets or any form of personal or investment advice.
Any opinions, news, research, analyses, prices, other information, or links to third-party sites contained on this website are provided on an "as-is" basis, are intended only to be informative, is not an advice nor a recommendation, nor research, or a record of our trading prices, or an offer of, or solicitation for a transaction in any financial instrument and thus should not be treated as such. The information provided does not involve any specific investment objectives, financial situation and needs of any specific person who may receive it. Please be aware, that past performance is not a reliable indicator of future performance and/or results. Past Performance or Forward-looking scenarios based upon the reasonable beliefs of the third-party provider are not a guarantee of future performance. Actual results may differ materially from those anticipated in forward-looking or past performance statements. IC Markets makes no representation or warranty and assumes no liability as to the accuracy or completeness of the information provided, nor any loss arising from any investment based on a recommendation, forecast or any information supplied by any third-party.

Bullish continuation?The Gold (XAU/USD) has bounced off the pivot and could rise to the 1st resistance.
Pivot: 3,300.14
1st Support: 3,245.08
1st Resistance: 3,376.40
Risk Warning:
Trading Forex and CFDs carries a high level of risk to your capital and you should only trade with money you can afford to lose. Trading Forex and CFDs may not be suitable for all investors, so please ensure that you fully understand the risks involved and seek independent advice if necessary.
Disclaimer:
The above opinions given constitute general market commentary, and do not constitute the opinion or advice of IC Markets or any form of personal or investment advice.
Any opinions, news, research, analyses, prices, other information, or links to third-party sites contained on this website are provided on an "as-is" basis, are intended only to be informative, is not an advice nor a recommendation, nor research, or a record of our trading prices, or an offer of, or solicitation for a transaction in any financial instrument and thus should not be treated as such. The information provided does not involve any specific investment objectives, financial situation and needs of any specific person who may receive it. Please be aware, that past performance is not a reliable indicator of future performance and/or results. Past Performance or Forward-looking scenarios based upon the reasonable beliefs of the third-party provider are not a guarantee of future performance. Actual results may differ materially from those anticipated in forward-looking or past performance statements. IC Markets makes no representation or warranty and assumes no liability as to the accuracy or completeness of the information provided, nor any loss arising from any investment based on a recommendation, forecast or any information supplied by any third-party.
