UPDATE ON SYRUP SELL , Anything above $0.46 is a good short (SELUPDATE ON SYRUP SELL
Anything above $0.46 is a good short (SELL)
Adding shorts in parts with low risk
Expecting a downside move soon from these areas $0.46
Area to target for further short entries from $0.48
Target $0.41300 or Down
Not a Financial advice
Harmonic Patterns

RIOT / 2hNASDAQ:RIOT worked 6.5% retracing up today, which may be considered as wave x upward.
There are differing formations that an entire correction may develop.
So, the short-term bearish case remains intact. And a decline of 20% is expected to follow soon.
The first Fib-retracement target >> 7.68
The next target >> 7.30
#CryptoStocks #RIOT #BTCMining #Bitcoin #BTC

EURCHF: The Most Predictable Soap Opera in ForexUnder 0.94 with low volume? You board that bus. Every. Single. Time.
CAPITALCOM:EURCHF
Since 2022, EURCHF has been playing the same tired but reliable rhythm.
Drop below 0.94, keep volume low, and boom, the bounce.
Not once. Not twice.
We've seen it repeat 48 times in 24 months!!!! Check the chart!
Let them discuss inflation, war, central banks, and macro theory all day.
Meanwhile, this pair is just running a predictable underground shuttle:
Tickets are issued quietly, below 0.94.
Entry is boring.
Exit? Clean profit....
Now, let’s talk politics. Because EURCHF is more than a chart
It’s a financial proxy war in slow motion.
On one side! The Eurozone, a union that behaves like a dysfunctional family reunion. Everyone talks. No one agrees.
The ECB? Too slow, too soft, too diplomatic. France wants spending. Germany wants austerity. Italy just wants to be invited.
On the other side: Switzerland.
A country that acts like the rich uncle who never comes to dinner but still gets the final say.
They don’t speak loudly, they just stack gold, flex the franc, and smile silently.
Neutral in politics, but never neutral in profit.
So every time the Euro wobbles, whether war in Ukraine, elections in France, or the ECB mumbling about rate cuts, the Swiss franc tightens its tie and appreciates quietly.
But here’s the punchline:
Eventually, the Euro shrugs it off.
It always does.
Maybe because the EU is too big to fail, or Switzerland can only push so far before exporters start screaming.
So what happens? EURCHF bounces. Every time.
Low volume under 0.94? That’s the market whispering to insiders.
We don’t need to guess.
We don’t need breaking news.
We just follow the same damn wave.
No reason to change strategy.
No reason to listen to noise.
It’s not about being smart, it’s about being consistent.
This isn’t trading. It’s public transportation.
And until that bus breaks down, we ride it.

A crash in the horizonAs I have been suspecting for a long time. Markets are getting closer to a crash. On the weekly the 2 years bond market confirmed the change in the trend to the downside. Once we dip bellow the blue ema we might be entering in a doomed phase. Cheers

Falling towards overlap support?GBP/CHF is falling towards the pivot, which is an overlap support, and could bounce to the 1st resistance, which acts as a pullback resistance.
Pivot: 1.1045
1st Support: 1.0921
1st Resistance: 1.1191
Risk Warning:
Trading Forex and CFDs carries a high level of risk to your capital and you should only trade with money you can afford to lose. Trading Forex and CFDs may not be suitable for all investors, so please ensure that you fully understand the risks involved and seek independent advice if necessary.
Disclaimer:
The above opinions given constitute general market commentary, and do not constitute the opinion or advice of IC Markets or any form of personal or investment advice.
Any opinions, news, research, analyses, prices, other information, or links to third-party sites contained on this website are provided on an "as-is" basis, are intended only to be informative, is not an advice nor a recommendation, nor research, or a record of our trading prices, or an offer of, or solicitation for a transaction in any financial instrument and thus should not be treated as such. The information provided does not involve any specific investment objectives, financial situation and needs of any specific person who may receive it. Please be aware, that past performance is not a reliable indicator of future performance and/or results. Past Performance or Forward-looking scenarios based upon the reasonable beliefs of the third-party provider are not a guarantee of future performance. Actual results may differ materially from those anticipated in forward-looking or past performance statements. IC Markets makes no representation or warranty and assumes no liability as to the accuracy or completeness of the information provided, nor any loss arising from any investment based on a recommendation, forecast or any information supplied by any third-party.

GOLD LONG IDEAGold has been extremely bullish in the last few months on higher time frame.
Monthly : Bullish
Weekly : Bullish
Daily: Bullish
4HR : Bullish
I will be buying this bullish trend retracement on 4HR time frame.
But I want to see a bullish price action before I enter the trade for long.
My overall target is the major high created in April.
My RR is 1:5.

Gold Surges After Trade DealXAUUSD has recently shown a strong upward trend, supported by both a technical breakout structure and positive fundamental developments. After a prolonged rally from the lows of the previous weekend’s close, it has decisively broken through the key resistance zone between $3,365 and $3,370, which has now been clearly removed. With this breakout, the structure confirms the upward momentum and the expectation is to retest this newly formed support zone before continuing the uptrend.
The price is currently around $3,368 and a pullback to the $3,365 to $3,370 zone will offer a high-probability buying opportunity. This aligns with classic price behavior: after a breakout, the market often returns to test the former resistance level, which has now turned into support. If we see it retest, it would confirm the technical setup for a continued move toward the projected target of $3,470.
From a fundamental perspective, the Chinese Ministry of Commerce issued a statement refuting accusations from the US of violating the bilateral trade agreement (published on June 2, 2025), claiming these allegations are "groundless." According to the reached agreement, the US agreed to reduce tariffs on Chinese goods from 145% to 30% within 90 days. In return, China also pledged to lower tariffs on US goods from 125% to 10% over the same period. President Donald Trump stated over the weekend that China had not complied with the agreement and warned of increased tariffs on steel and aluminum this week.
Additionally, the ongoing Russia-Ukraine conflict continues to escalate, increasing pressure on risk assets and supporting gold prices. Tim Waterer, Chief Market Analyst at KCM Trade, commented that with rising trade and geopolitical tensions, it’s no surprise that gold has started the new week with an upward trend.
From a technical standpoint, the overall structure remains bullish. The breakout is clear and supported by volume. Any deeper pullback that breaks below $3,335 would invalidate the short-term bullish trend, as it would signal a failure to hold above the former resistance level and could mean the beginning of a deeper correction toward trendline support.
In conclusion, the current market behavior suggests it is in the process of forming a bullish continuation, supported by the clear breakout above previous resistance, rising geopolitical and trade tensions.
The price is likely to retest the breakout zone, offering a potential long setup forecasting a move higher if momentum remains strong. The technical picture is supported by future growth plans, making it a safe-haven asset to watch closely in the coming weeks to confirm the pullback and continuation.

Solana Bounces From 0.618 Fib — Bullish Structure Eyes Rotation Solana (SOL/USDT) has respected its 0.618 Fibonacci retracement level, which aligns with a high-timeframe higher low in the ongoing bullish market structure. If this level continues to hold, Solana may be preparing for a rotation toward $175—and potentially beyond.
The current support level is not only a Fibonacci retracement zone but also represents a structural higher low in Solana’s trend. As price bounces from this area, the bullish market structure remains intact, characterized by consecutive higher highs and higher lows. This setup suggests that Solana is merely in a corrective phase before a potential continuation.
Key Technical Points
- 0.618 Fibonacci Confluence: Aligned with a key higher low in the structure, this level is providing strong technical support.
- $175 as Immediate Resistance: A breach of this level could open up a continuation move toward $200 and $216.
Bullish Market Structure: Solana continues to print higher highs and higher lows, maintaining the integrity of the uptrend.
If Solana successfully reclaims and breaks above $175, it would confirm a short-term shift in momentum. This move would likely accelerate price toward $200—the next psychological and technical level. If that level is breached as well, the door opens for a rotation toward the $216 high, completing the current projected trend wave.
As long as the 0.618 Fibonacci support holds, Solana remains bullish. A clean move above $175 would confirm the trend continuation, with $200 and $216 as the next logical upside targets. Watch for strong volume on the breakout to validate the move.

ZBCN Technical Analysis – Breakout From AccumulationZBCN has shown impressive strength recently, following a textbook breakout from an extended accumulation phase. This kind of setup is well-known among technical traders: a period of sideways, range-bound price action often leads to an explosive move once resistance is broken — and that’s exactly what ZBCN has delivered.
The breakout has triggered a significant rally, and price action is now trending firmly upwards. From a structural standpoint, this is a clear shift from consolidation to expansion, which typically attracts momentum buyers and short-term traders aiming to ride the wave higher.
Currently, ZBCN is trading with strong bullish momentum, and the technicals suggest there is room for further upside. The immediate bullish target lies at the Fibonacci extension level of 0.011 satoshi, which marks a potential gain of approximately 258% from the earlier consolidation range. This Fibonacci level aligns with the nature of impulsive rallies that often follow accumulation breakouts.
However, one key level to watch remains the 0.032 satoshi zone. This level has not yet been retested following the breakout and stands as a critical structural area. A clean retest of this zone would provide confirmation of the breakout’s strength and likely act as a launchpad for the next leg higher.
In summary, ZBCN is currently exhibiting very bullish price action following its transition out of accumulation. If the rally continues without a retest, traders should look toward Fibonacci extension levels as potential short-term targets. If a pullback occurs, the 0.032 satoshi level is the most important zone to hold in order to maintain the breakout thesis.
As long as current momentum remains intact, the path of least resistance appears to be to the upside.

DOGE/USDT – Key Support Holding for Possible 194% Rally
Dogecoin has recently shown renewed signs of strength after reacting positively to the 200-week moving average. This level acted as a major dynamic support and helped ignite a bullish impulse from oversold conditions. The response from this zone suggests potential accumulation and a shift in short-term sentiment.
The most important level to watch is the $0.16 support. This zone is critical for the bullish thesis to remain intact. If price holds above this level, it increases the probability of a continued rally, especially with recent market structure favoring higher lows.
From a technical perspective, Dogecoin has now broken above a short-term descending trendline. This breakout, coupled with sustained strength above the 200-week MA, may set the stage for a significant move to the upside. The ultimate technical target remains the all-time high zone near $0.48, which represents a potential 194% gain from current levels.

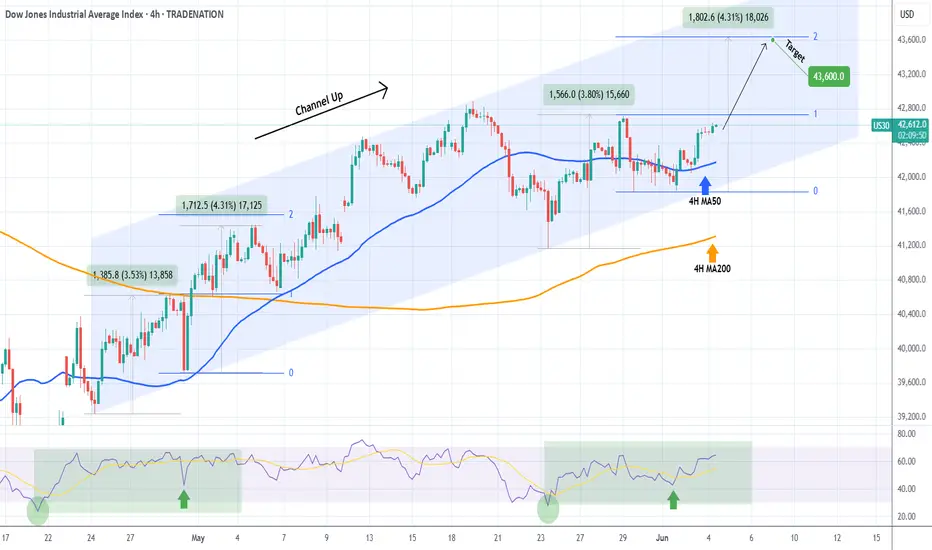
DOW JONES starting the new Bullish Leg.Dow Jones (DJI) is rallying off its 4H MA50 (blue trend-line), shortly after making a new Higher Low on its 6-week Channel Up. Technically that is the start of its new Bullish Leg.
With the 4H RSI being identical to the Bullish Leg at the start of the Channel Up, we expect it to again rise by +4.30% and touch the 2.0 Fibonacci extension. Target 43600.
-------------------------------------------------------------------------------
** Please LIKE 👍, FOLLOW ✅, SHARE 🙌 and COMMENT ✍ if you enjoy this idea! Also share your ideas and charts in the comments section below! This is best way to keep it relevant, support us, keep the content here free and allow the idea to reach as many people as possible. **
-------------------------------------------------------------------------------
Disclosure: I am part of Trade Nation's Influencer program and receive a monthly fee for using their TradingView charts in my analysis.
💸💸💸💸💸💸
👇 👇 👇 👇 👇 👇


SYRUP PERPETUAL TRADE , Sold From $0.41200SYRUP PERPETUAL TRADE
SYRUP SELL SETUP
Currently $0.41200
Sold From $0.41200
(Trading plan If SYRUP go up to $0.44
will add more shorts)
Expecting target $0.39400 OR DOWN
In the event of an early exit,
this analysis will be updated.
Its not a Financial advice

Gold's high-level shock pattern continuesAccording to the current 4-hour K-line chart, the market as a whole maintains a high-level oscillation pattern. There is a short-term pressure of correction after the high. It is recommended to sell short at highs, supplemented by short-term long orders. It is recommended to wait for a clear stabilization signal to implement a high-altitude trading strategy. Pay attention to the resistance of 3380-3400 on the top and the support of 3330-3310 on the bottom. In terms of specific operation suggestions, it is recommended to consider establishing short orders when the price rebounds to the two ranges of 3370-3375 and 3400-3405.
Gold is recommended to short when it rebounds to around 3370-3375, with a stop loss at 3383. In the short term, it is expected to be around 3350-3330, with a target of 3300. If it breaks, short at around 3400-3405, with a loss of 3413 and the target as above.

META Formed 1st 4H Golden Cross since Jan 2023!Meta Platforms (META) just completed yesterday its first 4H Golden in almost 2.5 years (since January 24 2023), flashing the strongest bullish signal it could at the moment!
Practically that Golden Cross was formed directly after the November 2022 bottom of the Inflation Crisis. The 4H RSI patterns between the two time periods are identical, so it is highly likely to see the market repeat that price action.
That suggests that the immediate Target on what seems to be an Inverse Head and Shoulders pattern is the 1.1 Fibonacci extension at $770.00, as META did on February 03 2023.
On the long-term and assuming a favorable macro environment (Trade Deals, Rate Cuts) it could reach the 1.786 Fibonacci extension a little over $1000, before the next major market correction.
-------------------------------------------------------------------------------
** Please LIKE 👍, FOLLOW ✅, SHARE 🙌 and COMMENT ✍ if you enjoy this idea! Also share your ideas and charts in the comments section below! This is best way to keep it relevant, support us, keep the content here free and allow the idea to reach as many people as possible. **
-------------------------------------------------------------------------------
💸💸💸💸💸💸
👇 👇 👇 👇 👇 👇

Will gold continue to rise?From the 4-hour chart, as long as the short-term gold market is above 3330, gold is still in a strong bullish trend. On the contrary, if it falls below the closing line near 3330, it will break the trend line, and the subsequent market will most likely form a weak shock pattern. Therefore, the current operation is actually very simple. As long as the 3330 position is not broken, you can rely on the 3330 area to enter the market and do more. Pay attention to the support near yesterday's low of 3333 below, and pay attention to the resistance near 3375-3380 above.
Gold operation suggestions: It is recommended to go long on gold when it falls back to 3345-3347, stop loss at 3335, and target 3360-3370;

DOGEUSDT 0.2550 TPWe are seeing a price rebound from strong support around the ~0.1900 level, which may signal the end of the correction. A potential double bottom formation is forming, which often indicates a trend reversal to the upside.
Additional arguments:
The WT_LB oscillator shows an oversold zone and initial upward curvature of signal lines – a typical buy signal.
After a strong downtrend, a consolidation phase has occurred, likely acting as an accumulation zone before a potential move upward.
The risk-to-reward ratio (R/R) is very favorable (around 1:5), supporting a long entry at the current market structure.
📌Technical signals and a strong R/R ratio support a bullish scenario, with a target around 0.252 and a stop-loss set near 0.185.

USDJPY MULTI TIME FRAME ANALYSISHello traders , here is the full multi time frame analysis for this pair, let me know in the comment section below if you have any questions , the entry will be taken only if all rules of the strategies will be satisfied. wait for more price action to develop before taking any position. I suggest you keep this pair on your watchlist and see if the rules of your strategy are satisfied.
🧠💡 Share your unique analysis, thoughts, and ideas in the comments section below. I'm excited to hear your perspective on this pair .
💭🔍 Don't hesitate to comment if you have any questions or queries regarding this analysis.

GOLD GOLD ..first layer support will 3322 100pips drop from yesterday low.
another demand floor will be on the ascending trend line 3310-3313.
economic data print
1:15pm
USD
ADP Non-Farm Employment Change forecast 111K
3:00pm
USD
ISM Services PMI
this most important data print will be the ADP non farm employment change
The forecast for the US ADP Non-Farm Employment Change for May 2025 is approximately 111,000
The ADP report measures private sector employment growth and is released about two days before the official government Non-Farm Payrolls (NFP) data.
It serves as an early indicator of labor market trends and consumer spending potential.
April’s ADP employment growth was soft at 62,000, reflecting caution amid trade tensions and economic uncertainty.
The May forecast of 111,000 jobs suggests a moderate rebound in private sector hiring.
Summary:
May 2025 ADP Non-Farm Employment Change Forecast: ~111,000 jobs
April 2025 Actual: 62,000 jobs
Significance: Indicates expected improvement in US private sector job creation ahead of the official NFP report.
why is ADP Non farm employment change important ???
The ADP Non-Farm Employment Change is considered a leading economic indicator because it provides an early and timely estimate of changes in private sector employment in the United States, typically released two days before the official government Non-Farm Payrolls (NFP) report. This early insight helps investors, policymakers, and traders gauge the health and direction of the US labor market before the more comprehensive official data is published.
Reasons why ADP Non-Farm Employment Change is a Leading Indicator:
Early Preview of Labor Market Trends: It offers a preliminary snapshot of private sector job creation based on payroll data from around 400,000 US businesses, covering about 20% of the private workforce. This makes it a timely gauge of employment trends ahead of the official NFP report.
Market Impact and Sentiment: Because it signals the strength or weakness of the job market, the ADP report influences market expectations for economic growth and Federal Reserve monetary policy. Strong ADP job growth tends to boost confidence in the economy and can lead to currency appreciation, especially of the US dollar.
Influence on Monetary Policy: The Federal Reserve closely monitors employment data to guide interest rate decisions. The ADP report’s early indication of employment trends helps anticipate Fed actions, affecting bond yields, currency markets, and broader financial conditions.
Correlation with Official NFP: While not perfectly aligned due to methodological differences, the ADP report often correlates with the official NFP figures, making it a useful forecast tool for traders and analysts.
Summary
The ADP Non-Farm Employment Change is a leading economic indicator because it provides an early, data-driven estimate of private sector employment changes, helping markets anticipate the official NFP report and influencing financial market expectations and policy decisions.
#gold

Bullish continuation?The Gold (XAU/USD) has bounced off the pivot and could potentially rise to the 1st resistance.
Pivot: 3,348.00
1st Support: 3,285.23
1st Resistance: 3,436.17
Risk Warning:
Trading Forex and CFDs carries a high level of risk to your capital and you should only trade with money you can afford to lose. Trading Forex and CFDs may not be suitable for all investors, so please ensure that you fully understand the risks involved and seek independent advice if necessary.
Disclaimer:
The above opinions given constitute general market commentary, and do not constitute the opinion or advice of IC Markets or any form of personal or investment advice.
Any opinions, news, research, analyses, prices, other information, or links to third-party sites contained on this website are provided on an "as-is" basis, are intended only to be informative, is not an advice nor a recommendation, nor research, or a record of our trading prices, or an offer of, or solicitation for a transaction in any financial instrument and thus should not be treated as such. The information provided does not involve any specific investment objectives, financial situation and needs of any specific person who may receive it. Please be aware, that past performance is not a reliable indicator of future performance and/or results. Past Performance or Forward-looking scenarios based upon the reasonable beliefs of the third-party provider are not a guarantee of future performance. Actual results may differ materially from those anticipated in forward-looking or past performance statements. IC Markets makes no representation or warranty and assumes no liability as to the accuracy or completeness of the information provided, nor any loss arising from any investment based on a recommendation, forecast or any information supplied by any third-party.


Gold MarketThe Trump administration's "steel tariffs" caused gold to surge to around 3390. Yesterday's bottom of the correction touched around 3330. The current trend analysis shows that there are bullish protection actions at 3340 points. Today, you can go long based on 3344 as the support point.
The ADP data will be released tonight. The 4-hour US dollar fell and went out of the five-wave decline. The typical five-wave decline may have to rebound. If the US dollar surges, the gold 3340 support level may not be able to protect.
Today's strategy is still mainly long. However, if it fails to break through 3370 and falls below 3340, then you must pay attention to stop loss.
BUY: around 3350
SL: 3340
TP: 3370-3400

USDJPY H4 I Bullish Bounce Off Based on the H4 chart analysis, the price is trading near our buy entry level at 143.99, a pullback support
Our take profit is set at 145.06, a pullback resistance.
The stop loss is placed at 142.49, a swing low support.
High Risk Investment Warning
Trading Forex/CFDs on margin carries a high level of risk and may not be suitable for all investors. Leverage can work against you.
Stratos Markets Limited (tradu.com ):
CFDs are complex instruments and come with a high risk of losing money rapidly due to leverage. 63% of retail investor accounts lose money when trading CFDs with this provider. You should consider whether you understand how CFDs work and whether you can afford to take the high risk of losing your money.
Stratos Europe Ltd (tradu.com ):
CFDs are complex instruments and come with a high risk of losing money rapidly due to leverage. 63% of retail investor accounts lose money when trading CFDs with this provider. You should consider whether you understand how CFDs work and whether you can afford to take the high risk of losing your money.
Stratos Global LLC (tradu.com ):
Losses can exceed deposits.
Please be advised that the information presented on TradingView is provided to Tradu (‘Company’, ‘we’) by a third-party provider (‘TFA Global Pte Ltd’). Please be reminded that you are solely responsible for the trading decisions on your account. There is a very high degree of risk involved in trading. Any information and/or content is intended entirely for research, educational and informational purposes only and does not constitute investment or consultation advice or investment strategy. The information is not tailored to the investment needs of any specific person and therefore does not involve a consideration of any of the investment objectives, financial situation or needs of any viewer that may receive it. Kindly also note that past performance is not a reliable indicator of future results. Actual results may differ materially from those anticipated in forward-looking or past performance statements. We assume no liability as to the accuracy or completeness of any of the information and/or content provided herein and the Company cannot be held responsible for any omission, mistake nor for any loss or damage including without limitation to any loss of profit which may arise from reliance on any information supplied by TFA Global Pte Ltd.
The speaker(s) is neither an employee, agent nor representative of Tradu and is therefore acting independently. The opinions given are their own, constitute general market commentary, and do not constitute the opinion or advice of Tradu or any form of personal or investment advice. Tradu neither endorses nor guarantees offerings of third-party speakers, nor is Tradu responsible for the content, veracity or opinions of third-party speakers, presenters or participants.
