TRB Back Inside Macro Range — Accumulation Likely?TRB has re-entered a long-standing macro range between $9.93 and $44.24, a zone it previously consolidated in for over a year. Current price action and volume behavior suggest we could be in for another extended accumulation phase.
Key Highlights:
Macro Range Reclaimed: Weekly candle closes confirm acceptance back inside range
Low Volume Environment: Subdued volume across the board reduces breakout probability
Historical Precedent: TRB traded sideways here for 371 days before its last breakout
Harmonic Patterns

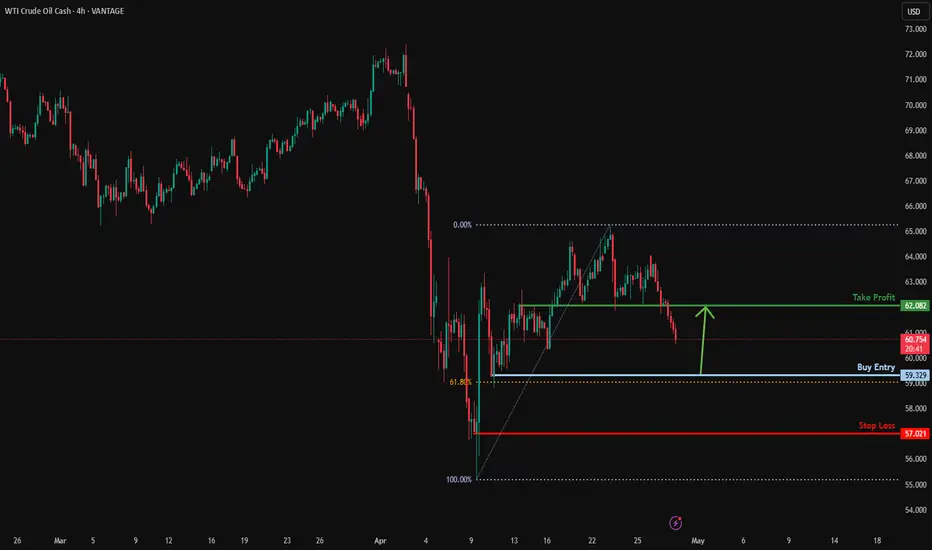
Could the price bounce from here?USO/USD is falling towards the support level which is a pullback support that lines up with the 61.8% Fibonacci retracement and could bounce from this level to our take profit.
Entry: 59.32
Why we like it:
There is a pullback support level that lines up with the 61.8% Fibonacci retracement.
Stop loss: 57.02
Why we like it:
There is a pullback support level.
Take profit: 62.08
Why we like it:
There is an overlap resistance level.
Enjoying your TradingView experience? Review us!
Please be advised that the information presented on TradingView is provided to Vantage (‘Vantage Global Limited’, ‘we’) by a third-party provider (‘Everest Fortune Group’). Please be reminded that you are solely responsible for the trading decisions on your account. There is a very high degree of risk involved in trading. Any information and/or content is intended entirely for research, educational and informational purposes only and does not constitute investment or consultation advice or investment strategy. The information is not tailored to the investment needs of any specific person and therefore does not involve a consideration of any of the investment objectives, financial situation or needs of any viewer that may receive it. Kindly also note that past performance is not a reliable indicator of future results. Actual results may differ materially from those anticipated in forward-looking or past performance statements. We assume no liability as to the accuracy or completeness of any of the information and/or content provided herein and the Company cannot be held responsible for any omission, mistake nor for any loss or damage including without limitation to any loss of profit which may arise from reliance on any information supplied by Everest Fortune Group.
The support and resistance idea behind GBPJPYThe price formed a resistance zone at 189.880-189.427 which was broken and become the new support zone.
The price has continued and broke a new resistance zone 190.960-190.580 and fails to project upwards and starts to fall.
#Their is a possible chance of the price reaching its previous support zone(189.88-189.427)

S&P500 repeating the 2019 recovery-Can hit 7000.The S&P500 index (SPX) is making a remarkable recovery as it completed yet another strong 1W green candle last week following the rebound on its Higher Lows Zone, near the 1W MA200 (orange trend-line).
This is a mirror price action with the last 1W MA200 rebound of the 2016 - 2019 Bullish Megaphone pattern, which not only recovered its previous All Time High (ATH) but also peaked on the 1.618 Fibonacci extension before the eventual 2020 COVID crash.
As a result, we believe that a 7000 Target is a very plausible one on the long-term.
-------------------------------------------------------------------------------
** Please LIKE 👍, FOLLOW ✅, SHARE 🙌 and COMMENT ✍ if you enjoy this idea! Also share your ideas and charts in the comments section below! This is best way to keep it relevant, support us, keep the content here free and allow the idea to reach as many people as possible. **
-------------------------------------------------------------------------------
Disclosure: I am part of Trade Nation's Influencer program and receive a monthly fee for using their TradingView charts in my analysis.
💸💸💸💸💸💸
👇 👇 👇 👇 👇 👇

Potential bearish drop?USD/CHF has reacted off the resistance level which is a pullback resistance that lines up with the 38.2% Fibonacci retracement and could drop from this level to our take profit.
Entry: 0.8253
Why we like it:
There is a pullback resistance level that lines up with the 38,2% Fibonacci retracement.
Stop loss: 0.8321
Why we like it:
There is a pullback resistance level.
Take profit: 0.8135
Why we like it:
There is a pullback support level that aligns with the 100% Fibonacci projection.
Enjoying your TradingView experience? Review us!
Please be advised that the information presented on TradingView is provided to Vantage (‘Vantage Global Limited’, ‘we’) by a third-party provider (‘Everest Fortune Group’). Please be reminded that you are solely responsible for the trading decisions on your account. There is a very high degree of risk involved in trading. Any information and/or content is intended entirely for research, educational and informational purposes only and does not constitute investment or consultation advice or investment strategy. The information is not tailored to the investment needs of any specific person and therefore does not involve a consideration of any of the investment objectives, financial situation or needs of any viewer that may receive it. Kindly also note that past performance is not a reliable indicator of future results. Actual results may differ materially from those anticipated in forward-looking or past performance statements. We assume no liability as to the accuracy or completeness of any of the information and/or content provided herein and the Company cannot be held responsible for any omission, mistake nor for any loss or damage including without limitation to any loss of profit which may arise from reliance on any information supplied by Everest Fortune Group.

Bearish drop?EUR/USD is reacting off the resistance level which is a pullback resistance that lines up with the 50% Fibonacci retracement and could drop from this level to our take profit.
Entry: 1.1427
Why we like it:
There is a pullback resistance level that lines up with the 50% Fibonacci retracement.
Stop loss: 1.1560
Why we like it:
There is a pullback resistance level.
Take profit: 1.1278
Why we like it:
There is a pullback support level.
Enjoying your TradingView experience? Review us!
Please be advised that the information presented on TradingView is provided to Vantage (‘Vantage Global Limited’, ‘we’) by a third-party provider (‘Everest Fortune Group’). Please be reminded that you are solely responsible for the trading decisions on your account. There is a very high degree of risk involved in trading. Any information and/or content is intended entirely for research, educational and informational purposes only and does not constitute investment or consultation advice or investment strategy. The information is not tailored to the investment needs of any specific person and therefore does not involve a consideration of any of the investment objectives, financial situation or needs of any viewer that may receive it. Kindly also note that past performance is not a reliable indicator of future results. Actual results may differ materially from those anticipated in forward-looking or past performance statements. We assume no liability as to the accuracy or completeness of any of the information and/or content provided herein and the Company cannot be held responsible for any omission, mistake nor for any loss or damage including without limitation to any loss of profit which may arise from reliance on any information supplied by Everest Fortune Group.

Gold still has a chance to reboundCurrently, gold's bulls and bears are still oscillating within a large range. The key pressure above and the upper edge of the range are maintained near 3365-70, while the lower edge of the large range and the support are maintained near 3260. It is very likely that there will be multiple shocks and choices within this range again.
Gold retreats to around 3302-00 during the day, go long, target around 3330-50, stop loss 3295.

WTI OIL Bearish Cross confirming more selling ahead.WTI Oil (USOIL) has been trading within a Channel Down pattern since the December 06 2024 Low. The last Bearish Leg started on a 1D MA200 (orange trend-line) rejection and was confirmed with a 1D MACD Bearish Cross 3 days after.
At the moment we have had a 1D MA50 (blue trend-line) rejection and today we will complete a new 1D MACD Bearish Cross. As a result, we almost have a new sell confirmation. Once completed, sell and target $53.50 (-19% from the point of the rejection).
-------------------------------------------------------------------------------
** Please LIKE 👍, FOLLOW ✅, SHARE 🙌 and COMMENT ✍ if you enjoy this idea! Also share your ideas and charts in the comments section below! This is best way to keep it relevant, support us, keep the content here free and allow the idea to reach as many people as possible. **
-------------------------------------------------------------------------------
Disclosure: I am part of Trade Nation's Influencer program and receive a monthly fee for using their TradingView charts in my analysis.
💸💸💸💸💸💸
👇 👇 👇 👇 👇 👇


GBP/USD Opening Trends and Trading Strategies Next WeekTrend Analysis
Examining the 4 - hour chart of GBP/USD, the pair is distinctly navigating an upward trend. A series of successive higher highs and higher lows have been established, serving as a robust testament to the dominant strength of the bulls 🐂. This upward momentum indicates that the bulls are firmly in the driver's seat, consistently pushing the price higher and maintaining control over the market sentiment.
Key Levels
Support Area
The 1.3200 - 1.3240 range emerges as a crucial support zone on the chart. Historical price action reveals multiple instances where the price has found strong support in this area, bouncing back with resilience each time it approached. This repeated pattern underscores the presence of substantial buying pressure, as market participants actively step in to defend this price level. Should the price retrace towards this support zone again, it could potentially present a lucrative opportunity for traders to initiate long positions 💰.
Target Area
The 1.3420 mark has been identified as a significant target level. In the event that the price successfully breaks free from its current consolidation phase and continues its upward trajectory, there is a strong expectation that it will advance towards this target price. This level represents a potential milestone for the bullish rally, and reaching it would further validate the strength of the upward trend 🎯.
Trading Strategy
Long - position Strategy
For traders looking to capitalize on the bullish trend, a well - timed entry point could present itself when the price retraces to the 1.3200 - 1.3240 support area. Once there, the appearance of a bullish candlestick pattern, such as a hammer or an engulfing pattern, can serve as a signal to consider entering a long position. To manage risk effectively, it is advisable to set the stop - loss just below the support area, protecting against any unexpected downward movements. With the 1.3420 target area in sight, traders can aim for a profitable trade as the price moves in the anticipated upward direction 📈.
⚡⚡⚡ GBPUSD ⚡⚡⚡
🚀 Buy@1.32000 - 1.32400
🚀 TP 1.33500 - 1.34000
Accurate signals are updated every day 📈 If you encounter any problems during trading, these signals can serve as your reliable guide 🧭 Feel free to refer to them! I sincerely hope they'll be of great help to you 🌟

Spotify stock falls more than 11% after earnings releaseSpotify's stock has shown significant price weakness and is now trading below $600 per share, shortly after a large bearish gap formed following the release of its quarterly results. The company reported earnings per share of €1.07, below expectations of €2.13 per share. Additionally, Spotify projected operating profit for Q2 at €539 million, under the market estimate of €557 million. The earnings miss and weak forward guidance have led to persistent bearish pressure, triggering strong selling momentum in the short term.
Uptrend Weakens:
Spotify has been in a consistent uptrend since around November 2022. However, in recent months, buying pressure has failed to push the price to new highs, with the stock now trading in a lateral range that signals a period of price consolidation. If the uptrend continues to stall, this neutral phase may extend in the short term.
ADX:
The ADX line has started to show early signs of neutrality, hovering around the 20 level. This indicates reduced volatility over the past 14 trading sessions. If ADX remains in this range, it suggests that price neutrality could persist.
RSI:
A similar condition is seen in the RSI, which has reached the neutral 50 zone—where bullish and bearish momentum are in balance. This reinforces the neutral sentiment and may support continued sideways movement in upcoming sessions.
Key Levels:
$640: The most recent high. A breakout above this level could signal a continuation of the long-term uptrend.
$540: Current support level, aligned with the 100-period simple moving average. Stability here may support ongoing consolidation.
$480: Major support at recent lows. A bearish move back to this level could trigger a fresh selling trend in the short term.
Written by Julian Pineda, CFA – Market Analyst

Bitcoin $45k in 45 Days. Believe it or Watch It!Sometime people don't believe predictions because they need proof. Watch and learn people. Don't get caught holding the bag. Just ride the waves. No ema no alerts just market structure. I trade for fun and accuracy. This is a discipline sport so please watch and act accordingly. But this will play out exactly as expected. Go USA! #blackrock

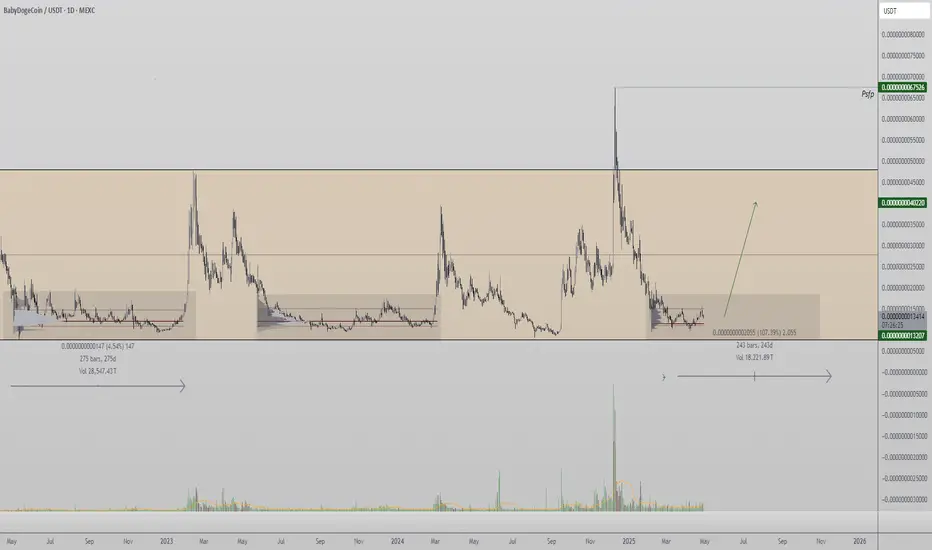
BabyDoge to Pump from range lows? high time-frame trading rangeBaby Doge is once again trading at a historically significant range low—a level that has previously acted as a base for strong bullish expansions. The current setup mirrors past consolidations that lasted over 270 days, each leading to a rapid move toward the range high.
The confluence of extended consolidation time, strong support holding, and low-volume accumulation suggests another potential build-up phase. This gives credence to a bullish bias if the range low continues to hold firm in the coming weeks.
However, the flip side remains clear: a clean breakdown of this level will invalidate the structure and likely trigger a deeper retrace. Given Baby Doge’s status as a high-risk, low-cap coin, position management and risk-to-reward remain key.
In summary, Baby Doge is sitting at a pivotal zone. If accumulation sustains here, history may repeat with another breakout rally toward the highs.

Golden layout strategy!Gold daily level includes a positive hammer line with a long lower shadow. Gold fluctuates and hovers. There have been four oscillating daily lines, all running below the 3370 line. The probability of continued fluctuation is high. Based on the above analysis, it can be concluded that gold bottomed out and rebounded, and bulls took the initiative. In terms of operation, consider retreating and arranging long orders first, and high shorts as a supplement. Pay attention to the resistance of 3370-3400 US dollars on the top, and the support of 3310-3260 US dollars on the bottom.

Gold shocks pull long and short without continuation!From the daily line, the K-line closed with a hammer-shaped small positive line with a long lower shadow, showing a trend of falling back from a high position, which intensified the change of the top K-line pattern. At present, the gold price is suppressed by the double top of 3370 above and supported by the multiple bottoms of 3260 below. The market outlook mainly focuses on the shock adjustment of this range. The middle track of the Bollinger band at the hourly level is near 3322, which can be used as a watershed of strength and weakness. After the gold price falls below the middle track of the Bollinger band, it is likely to go to the lower track of the Bollinger band, and it is more likely to test the shock bottom position of 3260. In terms of the short-term operation of gold, it is recommended to mainly short on rebounds and supplemented by long on pullbacks. The short-term focus on the upper side is 3329-3335 resistance, and the short-term focus on the lower side is 3265-3260 support.


CETUS Setup – Bullish Bias, Risk 3%This trade setup has many reasons to take it, but I’ll explain the main ones only.
1. Bullish Harmonic Bat Pattern – Special chart pattern is being made, and I will place a limit order to enter at the last point (D leg).
2. Falling Wedge Pattern – Lower line of this pattern is also at the same place where I want to enter, so it gives extra confirmation.
3. Trend is Bullish – Market is already going up, and we are trading with trend. You must have heard, “Trend is your friend.”


BITCOIN BUY !!!Hello friends✌
As you can see in the picture, we have specified a purchase range for you to buy in stages, of course with capital and risk management.
🙏If you like it, support it with a ✔like✔ and ✔comment✔.
*Trade safely with us*

GOLD BUY NOW TO 3,352Gold just took out the buyside liquidity price is expected to make a new highs 3,352 is my target this is called a falling wedge breakouts
JOIN AND ENJOY......

GBP/USD M15 – Breakout AlertGBP/USD M15 – Breakout Alert
The GBP/USD pair on the 15-minute timeframe is showing a potential buying opportunity following the breakout of a consolidation pattern. This breakout indicates a possible shift in momentum to the upside, increasing the likelihood of continued bullish movement in the near term.
Trade Idea – Long Setup:
Entry: Consider entering around the trendline zone of the breakout pattern (approx. 1.32200–1.32300).
Target 1: 1.33214
Target 2: 1.33600
Stop Loss: Below recent structure low or Ichimoku cloud support.
This setup is backed by momentum indicators and breakout structure. Keep an eye on volume and price action near the entry zone for confirmation.
If you find this analysis helpful, please hit the like button and drop a comment to support!
Your engagement motivates me to keep sharing more setups and insights.
Best regards,
JAMES_GOLD_MASTER_MQL5

