DOGECOIN -Rejection From Key Supply Zone |Bears Gaining Control?Dogecoin is facing heavy resistance near the $0.1835 supply zone, where multiple rejections suggest buyer exhaustion. This level is also aligned with the LuxAlgo Supply and Demand Visible Range, adding more confluence to the bearish bias.
Key Observations:
Strong rejection from $0.1835 - $0.1800 supply zone.
Bearish momentum building below resistance.
Price forming a potential double top structure with lower highs.
Targets if Breakdown Confirms:
$0.1606 – Mid-range support and recent consolidation level.
$0.1399 – Major demand zone and high-volume area.
Breakdown below $0.1606 could trigger a sharper selloff into the orange demand zone.
Watch for:
Breakdown candle below $0.175 + retest = entry signal.
Bearish continuation pattern confirmation.
News catalysts (highlighted on chart for May 5–9) could add volatility.
Trade Idea:
Short bias below $0.175 with targets at $0.160 and $0.140.
Invalidation: Clean break above $0.1835 with strong bullish candle.
What’s your bias on DOGE? Drop a comment below – Long or Short?
---
#Dogecoin #DOGEUSD #CryptoTrading #SupplyAndDemand #LuxAlgo #Altcoins #BearishRejection #PriceAction #TradingView
Harmonic Patterns

pi coinAfter a strong rise in price and volume Pi coin is now showing stability at its golden pocket. considering weekends having slow volumes and range bund price action, Pi coin is also expected to maintain the price range of 0.58-0.59. however aligning with pricing of btc and near weekly close it price expected to pump till .7 or above. its ADX is trending at 4hrs and daily, its stoch rsi is about is bottoming. rsi showing multiple divergences at 4h and LtF. it is forming butterfly pattern with expected "C" at 0.5603, but as it is showing strength at golden pocket so it is expected to go above from here that is 0.5833. that is why I suggest 3 entries for average pricing and avoid missing any opportunity.
Thus take entry with confluences like
1.BTC bottoming at 4h
2. weekly close
3. rsi golden cross
4. C leg of harmonic butterfly
5. bottoming of stoch rsi
Here is the setup
entry 1. 0.5833 10% of ur investment
entry 2. 0.5606 30%
entry 3. 0.5496
SL 0.54
Tp1. 0.576
Tp2. 0.614
Tp3. 0.6685
Tp4. 0.702

SOLANA 4H - Rejection From Supply Zone | Bearish Move Loading? Solana is showing signs of weakness after repeated rejections from the $150.60 Supply Zone, a key area highlighted by the LuxAlgo Supply and Demand Visible Range. Price has failed to break above this resistance multiple times, forming a strong distribution pattern.
Bearish Signals:
Rejection from supply zone around $150 - $151.
Strong resistance confirmed by visible volume profile.
Current price action is compressing under resistance, signaling potential bearish breakout.
Red arrows point to key bearish targets at:
$126.68 – previous structure support.
$104.37 – high-volume node and demand zone.
If price breaks below the short-term range (around $145), expect acceleration towards these downside targets.
Watch for:
Break and retest of $145 level for confirmation.
Increased volume on breakdown = stronger momentum.
Macro support area between $100 – $105 could offer a bullish bounce later.
Bias: Bearish short-term | Neutral to Bullish long-term (above $100 support zone)
What's Your Plan?
Short traders: look for break & retest setups with tight SLs.
Long-term holders: dollar-cost average near demand zone if tested.

ETH/USD Rejected at $1,871 – Is $1,413 the Next Target?Ethereum just got rejected from a major supply zone near $1,871, and we’re now seeing early signs of bearish pressure setting in. Price has failed multiple times to break and hold above this key resistance.
Key Levels & Analysis:
Supply Zone: $1,850 – $1,875 (strong historical resistance with visible range volume)
Immediate Support: $1,655 – could act as a short-term bounce zone
Major Demand Zone: $1,413 – price has reacted strongly here before, making it a crucial level to watch
Current Bias:
Bearish below $1,850. ETH has printed a possible double top, with sellers defending the zone aggressively.
Trade Idea:
Consider short setups if price retests and fails to break above $1,850 again. Look for a move toward $1,655 first, then potentially to $1,413 if volume supports the drop.
Upcoming Catalysts:
Watch out for upcoming U.S. economic data releases (highlighted below the chart), which could cause volatility.
Question for Traders:
Do you think ETH will bounce at $1,655 or break straight down into the $1,400s?
---
Hashtags:
#Ethereum #ETHUSD #Crypto #SupplyAndDemand #LuxAlgo #TradingStrategy #TechnicalAnalysis #CryptoTraders #FrankFx #ETH4HChart

BTC/USD Rejects Key Supply Zone – Is a Drop to $88K Next?Bitcoin just rejected a major supply zone around $97,300, showing signs of strong bearish momentum. This 4H chart highlights a clear rejection from the visible range high-volume node, with BTC currently trading at $96,191 and dropping.
Key Observations:
Supply Zone (Resistance): Around $97,300 – price has failed to break above this level multiple times.
Demand Zone (Support): Sitting near $88,129, this is the next major liquidity area to watch.
Bearish Signal: Consecutive red candles forming below the supply zone with lower highs, hinting at selling pressure taking control.
Targets:
First short-term target: $92,000
Final demand zone target: $88,129
Bias:
Bearish until BTC breaks and holds above $97.3K with volume.
Trade Idea:
Look for a potential short entry on a bearish retest of the rejected zone. Risk management is key – wait for confirmation.
What I'm Watching:
Will buyers step in at GETTEX:92K ? Or is BTC heading straight for the FWB:88K demand zone?
---
Hashtags for Visibility:
#Bitcoin #BTCUSD #CryptoTrading #SupplyAndDemand #TradingStrategy #LuxAlgo #FrankFx #PriceAction #TechnicalAnalysis #4hChart


AUDJPYAUDJPY
- Rising Wedge as an corrective pattern in Short Time Frame
- Break of Structure
- Order Block
- Completed " 1234 " Impulsive Waves
- Fibonacci Level - 61.80%

LISTAUSDT UPDATELISTAUSDT Technical Setup
Pattern: Falling Wedge Breakout
Current Price: $0.1893
Target Price: $0.30
Target % Gain: 60.04%
Technical Analysis: LISTA has broken out of a falling wedge pattern on the 12H chart with increasing momentum. Price is holding above the breakout trendline, suggesting bullish continuation. A confirmed breakout with volume could push price to the projected target.
Time Frame: 12H
Risk Management Tip: Always use proper risk management.

IOTAUSDT UPDATE
IOTA Technical Setup
Pattern: Falling Wedge Breakout
Current Price: $0.2097
Target Price: $0.38
Target % Gain: 90.97%
Technical Analysis: IOTA has broken out of a falling wedge on the 1D chart, confirming bullish momentum with a strong price surge and volume spike. A retest of the breakout zone appears to be holding well.
Time Frame: 1D
Risk Management Tip: Always use proper risk management.

Bitcoin to 61k ?Follow up on my weekly idea.
There is potential sell on the 4 hour chart
Bitcoin is just below a weekly resistance and at the 4 hour resistance
Stop loss: 98500
Take profit: Around 61 k

Analysis and Implications of AMD Fluctuations & Crab PatternIn the previous idea, we moved along with the buyers and progressed up to a price of $227.
Then, with the crab pattern, the decline in Micro stock began, and this drop is expected to continue down to $52. Afterward, we will once again align with the buyers through the crab pattern.

BITCOINSeveral factors could cap Bitcoin’s (BTC) upside this month (May 2025) despite its strong momentum near $97,000:
Volume Decline and Depleting Buying Momentum
Recent trading volume has been declining, suggesting weakening buying pressure. Without strong volume to confirm a breakout, rallies may stall or reverse, attracting bearish activity and limiting upward moves.
Profit-Taking After Sharp Rally
After surging roughly 24% from April lows , some investors may lock in profits, creating short-term selling pressure that caps gains.
Macroeconomic and Geopolitical Risks
Mixed economic data and ongoing macro jitters-such as trade tensions and tariff uncertainties-could trigger risk-off sentiment, reducing appetite for risk assets like Bitcoin and strengthening the US dollar, which often moves inversely to BTC.
ETF Inflows and Market Sentiment Volatility
While institutional inflows via Bitcoin ETFs have been strong, sudden shifts in sentiment or regulatory concerns around crypto products could cause volatility and limit sustained rallies.
Technical Indicators
Although technicals remain broadly bullish, Bitcoin must decisively break and hold above $96,230 with volume confirmation to sustain an upswing. Failure to do so could result in consolidation or pullbacks to support zones near $90,237 or lower

NZDJPY BULLISH OR BEARISH DETAILED ANALYSIS ??NZDJPY has successfully completed a bullish breakout from the descending channel structure that has been forming since mid-2024. The price action respected the trend boundaries flawlessly, and the breakout above the upper trendline confirms a reversal from the previous downtrend. Now trading around 86.200, this pair is showing strong momentum, supported by both technical breakout validation and fresh bullish sentiment in the market.
The pair is now targeting a measured move towards 93.000 in the coming weeks. The breakout is supported by increasing risk appetite across markets, as investors shift from safe-haven currencies like the Japanese Yen toward riskier assets such as the New Zealand Dollar. The sharp rejection from the lower trendline and the steady climb through April and early May marks the beginning of a potential bullish cycle. Traders should watch for retests and bullish continuation patterns to ride this wave.
Fundamentally, the New Zealand economy is seeing upward momentum with recent improvements in dairy exports and a surprise drop in unemployment to 3.8%, beating expectations. On the other hand, Japan’s stagnant inflation data and dovish Bank of Japan stance have weakened the Yen further. The widening interest rate differential between the Reserve Bank of New Zealand and the Bank of Japan continues to favor the Kiwi. This macro backdrop aligns with the technical breakout, offering additional conviction to bullish traders.
With technicals and fundamentals now in alignment, NZDJPY offers a high-probability long setup. Breakout traders and trend followers should consider riding this move toward the 93.000 target, with trailing stops to lock in profits as momentum continues. Keep an eye on global risk sentiment, commodity prices, and upcoming economic data from New Zealand for confirmation along the way.

Harmonic Shark Pattern and Palantir's Stock CorrectionBased on harmonic analysis, specifically the Shark pattern, the price of Palantir (PLTR) stock may face a potential decline from the $129 mark.
This projection hinges on the identification of a completed Shark pattern, indicating a possible reversal zone.
Within this framework, the Fibonacci ratios of 0.88 and 1.138 are critical levels to observe.
The 0.88 retracement level suggests a potential area for a first retest and possible bounce, while the 1.138 level represents the pattern's leading edge, indicating a possible reversal point after a more significant extension.

BTC Elliott wave analysis 5/3/2025For me , I think the Wave B of the Big 4 is already finished as you can see the clear divergence in 4 hours timeflame and the small wave count is also confirm that the end of wave be should be finish and Wave C is ready to coming down. Since the wave B retraced in the range of 0.618 - 0.8 (weak B) we expect the target for the end of wave C is around 1.272 - 1.382 of wave A (B-Failure flat) or around 68000- 65000.Surpisingly , the price target that we get is the same level as the huge suppot zone in 2024 making the 68000- 65000 target price more likely to be the end of C wave. But we should also think of the alternate scenario that the Big wave 4 is already end in WXYXZ (in the wave A) and the upcoming wave 5 (wave B)is already coming up and hit the resistance and waiting to go higher.

GOLD D1 Chart Update For Shorter Term TradingRead all levels mentioned in chart carefully as we have 2 directions
Right now GOLD standing at turning point
GOLD remains in BUY trend as long as stays above 2900-3000 Zone

USD/JPYThe pattern has **four points**: A, B, C, and D, forming two legs: **AB and CD**, which are equal in length and time.
There are two types:
* **Bullish AB=CD**: Signals a potential reversal to the upside.
* **Bearish AB=CD**: Signals a potential reversal to the downside.
Fibonacci Guidelines:
* The length of AB should be approximately equal to CD.
* The time it takes for price to move from A to B should be similar to C to D.
* The retracement BC is often:
* 61.8% or 78.6% of AB
* The projection CD is:
* 127.2% or 161.8% of BC

Dogeusdt is in Reversal Pattern Dogeusdt is showing reversal pattern on daily chart the RSI is showing bullish divergence and when the price will break the .206 level it will be a positive sign for bullish sentiment and it will go to test the daily trend line and after closing positive above the trend line it will likely to go in bullish trend again

SXPUSDT 1D AnalysisSXP ~ 1D Analysis
#SXP Buy after successfully penetrating this resistant line with a short -term target of at least 10%+ from here.

COMPUSDT 1D AnalysisCOMP ~ 1D Analysis
#COMP Buy gradually from here if you still have a Conviction on this coin with a short -term target of at least 10%+ from here.

Applying technical analysis in multiple time frames: $GPRA
Monthly
• Trend and momentum using Joe Rabil Method:
- Step 1 and Step 2 are formed – Mapping (Step 3)
- Watch if MACD can stay above 0 line
Weekly
• Trend and momentum using Joe Rabil Method:
- Step 1, Step 2 and Step 3 are formed (presumptive uptrend); unfortunately, price cannot close above Step 3!!
- 18MA is already cupping around – early sign of change in trend
• Harmonic Pattern: Mapping (Bearish Gartley)
• Elliot Wave: Mapping 12-(345) OR AB-(C)
Daily
• Trend and momentum using Joe Rabil Method:
- Step 1, Step 2 and Step 3 are formed (presumptive uptrend)
- 18MA has crossed 40MA and both are rising + MACD is up – trend confirmation
- Watch if both MA can rise in the same direction with good separation
10M
• To be watched: price action, MA and if MACD can make 0-line reversal if it is down to 0 line.

HIGHUSDT Analysis D1HIGHUSDT Already Broken Descending Broadening and started Recovery in D1 Chart
Continuity of momentum can see 80-120% Bullish Rally in Short-term .

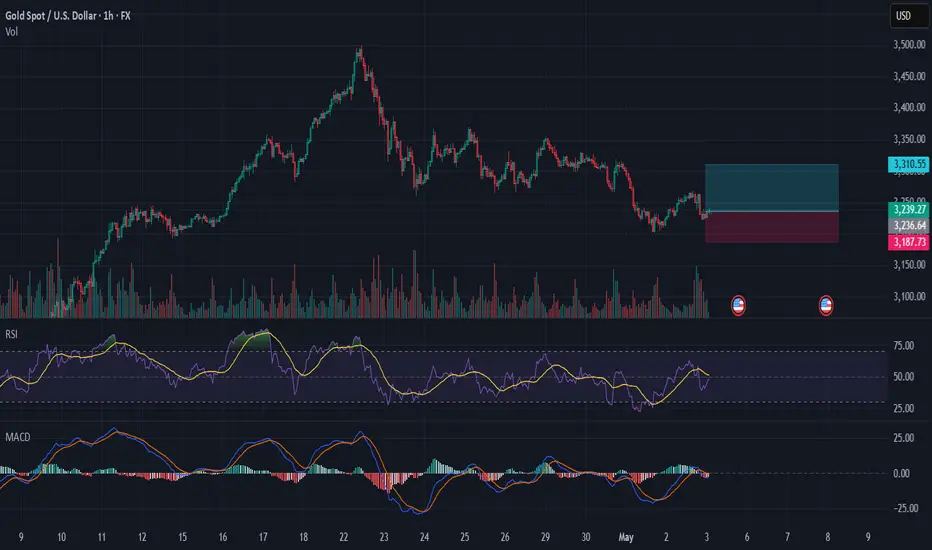
Gold (XAU/USD) Long Setup: Capitalizing on Key Support LevelsThis setup is based on a combination of technical indicators and key support levels, which suggest a potential bullish movement in the near future.
Chart Analysis:
Price Action: The price of gold has been consolidating around the $3,230 level, forming a potential support zone. This consolidation phase often precedes a breakout, and we are looking for a bullish breakout from this range.
Volume: The volume indicator shows a decrease in selling pressure, which is a positive sign. Increased volume on upward price movements would confirm the bullish sentiment.
RSI (Relative Strength Index): The RSI is currently hovering around the 50 level, indicating a neutral momentum. However, a break above 50 would signal bullish momentum, and we are looking for a move towards the overbought zone (above 70).
MACD (Moving Average Convergence Divergence): The MACD line is approaching a bullish crossover with the signal line, which is a strong indication of a potential upward trend. The histogram is also showing positive divergence, adding to the bullish case.
Support and Resistance Levels: Key support levels are marked at $3,187.75 and $3,236.44. A break above these levels would confirm the bullish setup. Resistance levels are at $3,310.55 and $3,379.27, which could act as targets for the long position.
Trade Setup:
Entry: Look for a bullish breakout above the $3,236.44 support level.
Stop Loss: Place a stop loss below the recent low at $3,187.75.
Target: Aim for the resistance levels at $3,310.55 and $3,379.27.
I invite all traders to share their thoughts and insights on this setup. Your feedback and additional analysis can help refine this strategy and improve our collective understanding of the market. Let's discuss the potential outcomes and any additional indicators or patterns that could support or contradict this setup.
Don't forget to follow me for more detailed analyses and trade setups. Together, we can navigate the markets and capitalize on profitable opportunities.
Happy Trading! 🚀💸