$BTC - Deviation or Continuation?Bitcoin retraces to the previous value area.
On the daily chart, price deviated above our VWAP and is now retesting its upper band.
Currently, price is retesting the previous range high. If this level holds, a complacency bounce is likely.
Immediate resistance to break is around 70.7k ( pdPOC) . A rejection at this level could drive price down to 68k (pwVAH) and potentially further to 66.4k (pwVAL) , sweeping through imbalances (single print/poor low) .
I-BTC

Potential bullish bounce?Bitcoin (BTC/USD) is falling towards the pivot which has been identified as a pullback support and could bounce to the 1st resistance that is slightly below the 50% Fibonacci retracement.
Pivot: 69,503.31
1st Support: 68,287.05
1st Resistance: 71,376.35
Risk Warning:
Trading Forex and CFDs carries a high level of risk to your capital and you should only trade with money you can afford to lose. Trading Forex and CFDs may not be suitable for all investors, so please ensure that you fully understand the risks involved and seek independent advice if necessary.
Disclaimer:
The above opinions given constitute general market commentary, and do not constitute the opinion or advice of IC Markets or any form of personal or investment advice.
Any opinions, news, research, analyses, prices, other information, or links to third-party sites contained on this website are provided on an "as-is" basis, are intended only to be informative, is not an advice nor a recommendation, nor research, or a record of our trading prices, or an offer of, or solicitation for a transaction in any financial instrument and thus should not be treated as such. The information provided does not involve any specific investment objectives, financial situation and needs of any specific person who may receive it. Please be aware, that past performance is not a reliable indicator of future performance and/or results. Past Performance or Forward-looking scenarios based upon the reasonable beliefs of the third-party provider are not a guarantee of future performance. Actual results may differ materially from those anticipated in forward-looking or past performance statements. IC Markets makes no representation or warranty and assumes no liability as to the accuracy or completeness of the information provided, nor any loss arising from any investment based on a recommendation, forecast or any information supplied by any third-party.

BITCOIN GROWTH AHEAD|LONG|
✅BITCOIN fell again to retest the support of 69,000$
But it is a strong key level
So I think that there is a high chance
We will see a bullish rebound and a move up
LONG🚀
✅Like and subscribe to never miss a new idea!✅

The point of interest is whether it can create a pull back
(Title) The point of interest is whether it can create a pull back pattern
--------------------------------------
Hello, traders.
If you "Follow", you can always get new information quickly.
Please click "Boost" as well.
Have a nice day today.
-------------------------------------
(BTCUSDT 1D chart)
With this decline, the BW (100) line was created at the 72344.74 point.
Therefore, the key is whether it can rise above 72344.74.
-
The price is passing the StErr Line around 71280.01, and the M-Signal indicator on the 1D chart is passing around 68393.48.
Therefore, if it is supported and rises between the M-Signal and StErr Line on the 1D chart, a short-term pullback will form.
If not, and it falls below the M-Signal indicator on the 1D chart, it is highly likely that it will show a short-term downtrend.
For this reason, as I mentioned yesterday, if it is supported between the M-Signal and 70148.34 on the 1D chart, it is time to buy more.
However, in order to buy more like this, a split sale must have been made before.
-
If not, and you need to buy new,
1. When it is supported around 67414.39-68393.48,
2. When it breaks through 72344.74,
there are two methods above.
The prerequisite for buying new is that the StochRSI indicator is below 50 and shows an upward trend.
If not, and the StochRSI indicator is above 50 or showing a downward trend, it is better not to buy.
----------------------------
(1h chart)
The linear regression channel indicator has set the length to 50, so the channel moves over time.
The channel is showing a change from an uptrend to a downtrend.
-
Back to the main story, the point of observation is whether the price can be maintained by rising above the 5EMA of the 1D chart and whether it can rise above the middle line of the channel.
If it fails to rise, volatility is expected to occur while touching the M-Signal indicator of the 1D chart.
Accordingly, as I mentioned on the 1D chart, we can see that the points 68393.48, 70148.34, and 71280.01 are important support and resistance points.
-
If you bought below 68393.48, you can see that the area around 68393.48 is the last selling point.
-
If the StochRSI indicator is above 50, it is better to find a time to sell, and if the StochRSI indicator is below 50, it is better to find a time to buy.
However, this is only when you are trying to make a new trade.
-
I am currently holding a long position.
And, since I thought it would create a pull back pattern and rise, I gave you an example of additional buying in the idea yesterday.
So, I didn't mention SHORT this time.
I think this SHORT position is likely to end sooner than expected.
USDC is volatile, so it can show a gap down at any time.
However, since USDT is continuously showing a gap uptrend, it can be seen that the coin market is likely to continue its upward trend.
And, because BTC dominance is on the rise.
The rise in BTC dominance also means that funds are concentrated on BTC.
Therefore, when BTC dominance is on the rise, it can be seen that it is more advantageous to trade BTC than altcoins.
If USDT dominance falls below 4.97 and is maintained or shows a downward trend, I think the coin market is likely to start an uptrend.
In order for this uptrend to lead to an altcoin uptrend, BTC dominance must fall below 55.01 and be maintained or show a downward trend.
If not, there is a possibility that it will become a strange uptrend where only BTC rises, so be careful when trading altcoins.
-
Have a good time.
Thank you.
--------------------------------------------------
- Big picture
It is expected that a full-scale uptrend will begin after rising above 29K.
The section expected to be touched in the next bull market is 81K-95K.
#BTCUSD 12M
1st: 44234.54
2nd: 61383.23
3rd: 89126.41
101875.70-106275.10 (overshooting)
4th: 134018.28
151166.97-157451.83 (overshooting)
5th: 178910.15
These are points where resistance is likely to occur in the future.
We need to check if these points can be broken upward.
We need to check the movement when this section is touched because I think a new trend can be created in the overshooting section.
#BTCUSD 1M
If the major uptrend continues until 2025, it is expected to start forming a pull back pattern after rising to around 57014.33.
1st: 43833.05
2nd: 32992.55
-----------------

#Bitcoin Short Time 2hThere is a harmonic bullish butterfly formation on CRYPTOCAP:BTC on the 2-hour time frame!

BTC 70k retestnot much to say here, the title is self explanatory
let´s see if we can get a nice reaction from here, or at least consolidate around the 70k area for a while. That would be a good sign for bulls.
is november gonna give us the large breakout candle that we have all been waiting for?

The latest bull attack this monthTo date, the market is clearly working out according to the planned plan. We are still collecting work-outs, but it is worth being on the alert as we approach the end of the month. As the middle of the month progressed, we expected to see a wave of growth to consolidate the monthly bullish candle. As I wrote in the last review, as we approach the end of the month, we should expect a second wave of growth to finally consolidate the month bullish on the tops. Against this background, a new wave of growth began with the flips of monthly candlesticks and altos.
As always, the opening level of the new month will be of great importance. The opening levels of the half-year and quarter still technically support growth, but there is an extremely negative picture with a growing dollar and falling oil, which puts a lot of pressure on the crypt and increases the activity of sellers, which is why we have already seen a stronger correction from the 2750 ether test than expected. The 2500 level was broken again, which indicates a breakdown of the bullish trend and gives a signal for a new attempt to go to 2000 in the future. The next month is the central one in the quarter and the final direction for the end of the year and the five-year plan will be chosen, which can lead to a very strong increase in volatility and new large drawdowns for the altos. Given this picture, after collecting the latest developments this week, it is worth carefully weighing money management and reducing positions in the work before determining the direction of the new month.
Most of the coins that I have taken into work show good dynamics and are in the top of growth, troy has shown itself most well. Most of the goals were taken, so far I'm not considering it anymore. Among the coins without a monitoring tag, only vib remained the most attractive, with a likely increase by a retest of 0.125-150 and above. The weekly candle opened quite negatively on the ast. Unpleasant signals were also left for a new local fracture. Today, it was not possible to gain a foothold above 0.1 and give a local overshoot of the previous momentum. In addition, the ast was delisted with okx, which is an additional negative signal and a reason for a local fracture. In this regard, I reduced my position on the 0.1 test. For now, there is a possibility of a higher breakdown in the coming days when fixing above 0.1, but with a lower probability in my opinion than for vib.
In addition to vib, among the coins of binance, only coins with the monitoring tag remained in the most oversold position. Such assets are often the last to grow and may show good momentum in the coming days. OAX still has the top potential among them, with the nearest targets at a retest of the range 0.20-25 and an exit to the test of 0.35 in an optimistic scenario. Secondly, I am again considering the work of pros, a partnership with which was announced last week by Metalpha. The immediate goal for him, while maintaining the current emission, is a retest of the 0.50-75 range and a test of 1.0 under an optimistic scenario. Also, waves of growth up to 30-50% can still show vite and hard. When choosing the position size, do not forget that coins with the monitoring tag, although they have the greatest growth potential, still retain the probability of delisting.
To save funds in the medium term, gft looks the most interesting so far due to its high liquidity.

BITCOIN TARGETING ALL TIME HIGHS - BTC LONG IDEAI projected and shared the idea that Bitcoin would reach $70,000 and potentially $73,000 within a few days. It happened in just two days! I hope you took the trade and made some profits, as I did.
Now, I’m preparing to position myself with the expectation that we’ll reach all-time highs within a week or two.
We recently broke a massive bearish trendline that has held since March 2024. Just before that, a daily demand zone formed, which helped break the trendline, making it a key area for me. Additionally, the equilibrium level of the bullish leg aligns perfectly with my point of interest.
I expect the price to retrace to the daily demand zone, hit the discount Fibonacci area, test the trendline, and take off from there toward new all-time highs.
Of course, I’ll be looking for lower time-frame confirmations before initiating a long position.

One more shakeout aheadIf this works, I'll be damned.
Fractal analysis, an update to my previous chart.

BITCOIN Closed 2 straight green 1M candles after 7 months!Bitcoin (BTCUSD) is closing today the monthly (1M) candle and unless it drops by 7000 in a few hours, it will close the month of October in green. That will be the 2nd straight green 1M candle since March!
This 7 month consolidation period is no stranger to BTC as such patterns, where there are no straight green 1M candles, are standard Accumulation Phases that we see during Bull Cycles. So far on the current one we've had three (including March 2024) and once the market closed 2 straight green 1M candles, it rallied.
The 2019 - 2021 Bull Cycle had three such straight green candle occasions and a very clear Accumulation Phase, while the 2015 - 2018 Cycle had numerous. One thing is clear based on this multi-year chart. When the market closes two straight green 1M candles, it is always a good signal to buy.
But what do you think? Do you find this indicator reliable? Are you buying based on this? Feel free to let us know in the comments section below!
-------------------------------------------------------------------------------
** Please LIKE 👍, FOLLOW ✅, SHARE 🙌 and COMMENT ✍ if you enjoy this idea! Also share your ideas and charts in the comments section below! This is best way to keep it relevant, support us, keep the content here free and allow the idea to reach as many people as possible. **
-------------------------------------------------------------------------------
💸💸💸💸💸💸
👇 👇 👇 👇 👇 👇

Btc otw for new highBitcoin Hits My Buy Zone
BTC has reached my buy zone, located between the 0.382 and 1.618 Fibonacci levels from wave A. My targeted buy range was $70,800 - $70,150. Now, I expect it to gradually start moving upward. I have three targets for this move:
TP 1: $74,100
TP 2: $74,500
TP 3: $75,000
Disclaimer:
⚠️ This is not financial advice! All information provided is for educational purposes only. Always conduct your own research before making any investment decisions. Trading carries a high risk and may result in the loss of capital.

Bitcoin parabolic curve#Bitcoin is Advancing Strongly on its Cyclical Parabolic Curve!
CRYPTOCAP:BTC parabolic! curve run will turn into god candles!

Bitcoin Analysis==>>New All-Time High(ATH) is Loading!!!For a better view of Bitcoin ( BINANCE:BTCUSDT ), I suggest you read yesterday's post first.👇
As I expected, Bitcoin corrected to the Support zone($72,000-$70,820) and is currently moving in a descending channel(small) .
According to Elliott wave theory , Bitcoin has completed wave 4 and we should wait for wave 5 .
I expect Bitcoin will touch New All-Time High(ATH) soon. (After breaking the upper line of the ascending channel).
⚠️Note: If Bitcoin falls below the Support zone($72,000-$70,820), it may fall further.⚠️
Bitcoin Analyze (BTCUSDT), 15-minute time frame⏰.
🔔Be sure to follow the updated ideas.🔔
Do not forget to put Stop loss for your positions (For every position you want to open).
Please follow your strategy and updates; this is just my Idea, and I will gladly see your ideas in this post.
Please do not forget the ✅' like '✅ button 🙏😊 & Share it with your friends; thanks, and Trade safe.

Bitcoin : Flag Trading Pattern Trading Setup:
A Trading Signal is seen in the BTCUSDT Bitcoin (1h) ( Futures )
Traders can open their Buy Trades NOW
⬆️Buy now or Buy on 70600.0
⭕️SL @ 69100.0
🔵TP1 @ 75900.0
🔵TP2 @ 78270.0 Flag Target
🔵TP3 @ 81000.0
What are these signals based on?
Classical Technical Analysis
Price Action Candlesticks Fibonacci
RSI, Moving Average , Ichimoku , Bollinger Bands
Risk Warning
Trading Forex, CFDs, Crypto, Futures, and Stocks involve a risk of loss. Please consider carefully if such trading is appropriate for you. Past performance is not indicative of future results.
If you liked our ideas, please support us with your likes 👍 and comments .

BTC - Bearish Pressure Soon?Hello TradingView Family / Fellow Traders. This is Richard, also known as theSignalyst.
📈 As per my last analysis, attached on the chart, BTC rejected the red structure and traded higher creating a new short-term structure marked in orange.
However, BTC is currently hovering around the upper bound of the channel and all-time high $74,000.
🏹For the bulls to remain in control long-term , a weekly candle close above $74,000 is needed.
📉In parallel, if the last minor low at $71,000 is broken downward, a bearish correction towards the lower blue trendline would be expected.
📚 Always follow your trading plan regarding entry, risk management, and trade management.
Good luck!
All Strategies Are Good; If Managed Properly!
~Rich

ETHEREUM is 1.1 TRILLION DOLLARS less valuable than BITCOINor -78%
The flippening was a common narrative.
ETH as hard money was also a narrative - in reality only when gas is exorbitant.
ETH as a world computer was the early narrative.
Bitcoin deserves it entry on to the world stage cycle.
ETH can become a 1 Trillion dollar + network.
Sharding and splintering of the network effects of the mainet clearly is not value creating. Splitting of communities and economic energy was the result.
Solana flippening is a good narrative that we are following this cycle.
Coins are the product of these smart contract platforms.
At the moment the best coin factory is SOL.
BTC is scarce. No coins are allowed to be created on it's. The Bitcoin forks had the stink of a founder, a human attached to it's network ... not what capital allocators.
They wanted a autonomous network that runs by itself and ossificatoin of the code. A complicated spaghetti bowl of code that the core dev team refuse to tinker with.
The results is clear at this point in time.

Bitcoin- Consolidation before ATH, but what next?At this moment, a new all-time high for BINANCE:BTCUSD seems likely, especially given the consolidation just below the previous ATH and the technical target from the small symmetrical triangle, which could push BTC above 75k soon.
However, I think the broader push everyone anticipates may not materialize.
Even if BTC briefly surpasses 80k, a 10-15% gain might not mean much in the grand scheme.
The media frenzy and crypto influencers projecting Bitcoin to pass 100k by year-end raise some caution for me.
I anticipate a peak around 80k or so, followed by a pullback into the familiar 50k–70k range, rather than a sustained breakout.
In summary, while I may buy in the short term, I’ll be closely watching for signs of weakness.
If these appear, I’ll switch to a short position, as I believe a false breakout from this flag pattern is a realistic scenario.

Crypto Boom: Can Bitcoin Hit $117,189?This monthly Bitcoin (BTC) chart suggests a potential breakout above the key resistance level of $73,777, signaling a bullish momentum if it closes above this point. A target is set at $117,189, representing a projected 63.75% increase if the trend continues. Overall, a close above $73,777 could help confirm that Bitcoin has entered a strong bullish phase.

78.6K is the next one to upsideMorning folks,
So, our " signal level" of ~68.6-69K has been broken and bullish setup has been set. Those who have used Stop "buy" entry orders should have good results.
Now the trading process is relatively simple. All that you need to do is to control 68.6-69K area. Because you do not want to see bearish reversal swing on BTC and drop back under long-term former resistance area again.
Other words, 68.6-69K is an invalidation point for current bullish action. So, if you intend to buy, you could consider 70.5K and 68.6K levels

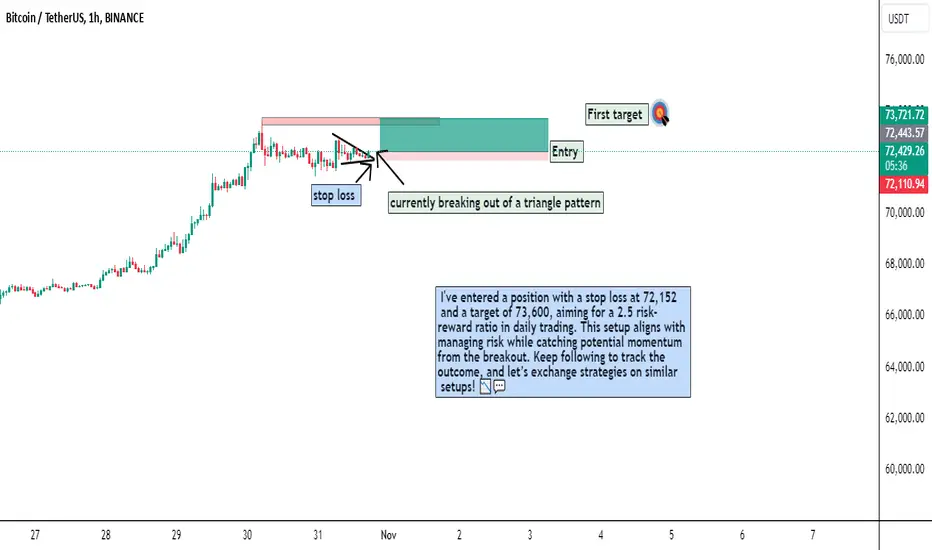
BTC Triangle Breakout StrategySharing my BTC setup on the 1-hour chart—currently breaking out of a triangle pattern. I've entered a position with a stop loss at 72,152 and a target of 73,600, aiming for a 2.5 risk-reward ratio in daily trading. This setup aligns with managing risk while catching potential momentum from the breakout. Keep following to track the outcome, and let’s exchange strategies on similar setups! 📉💬
Bitcoin Monthly RSI Bearish DivergencesThis is the complete history of every Bitcoin Monthly RSI bearish divergence. Incredibly, all that work you've been doing analyzing the Bitcoin chart was inferior to just looking for simple RSI divergences, which have called every cycle top in Bitcoin's entire history. And done so with precision.

Weekly $BTC looking BULLISH, more light to GOLD pre 2024Let's add a bit more to the previous CRYPTOCAP:BTC post we made.
#BTC closes Friday anywhere around here, it's MEGA BULLISH!
Officially breaking the downtrend on weekly
Volume not great but enough to keep moving, 1 more day left!
RSI is looking good. Money Flow also looks good, never dissipated.
Our #Bitcoin November call coming into fruition,
Again, look @ #GOLD calls pre 2024!

BTC H4 Bull Pennant FormingBTC/USD on the H4 chart is currently forming a bull pennant between a descending resistance and a horizontal support. The stochastic RSI is ready to swing back after a little more pullback.
Targets for the trade are the 2.236 and the 2.618 extensions of the previous high swing low. Targets marked with white horizontal lines.
Not financial advice.
Do your own DD.
Thanks for viewing the idea.
