DXY, Huge Drop Incoming, H-S-Formation Completion!Hello,
Welcome to this analysis about the DXY US-Dollar Currency Index and the 4-hour timeframe perspectives. In recent times the Index is forming important developments that should not be underestimated as inflation pressures on fiat and there is an inflation rate never seen since more than 35 years the DXY is setting up for a dump to the downside. Looking at my chart we can watch there how the Index is building this main head-shoulder-formation in the structure, with the left shoulder and the head completed and now in the right shoulder the Index is forming this bear-flag-formation-channel of which the right shoulder consists. In this case now when the Index finally breaks down below the neckline this will show the confirmational completion of this whole formation and the Index will set for further continuations as well as activate the target zone seen in my chart. Once the target zone has been reached it has to be elevated how the Index moves further and if there comes a potential reversal or just a devastating bearish continuation, it will be an important development ahead.
In this manner, thank you for watching the analysis, it will be great when you support it with a like, follow and comment for more upcoming market analysis, all the best!
"There are many roads to prosperity, but one must be taken."
Information provided is only educational and should not be used to take action in the markets.
Index

DXY Bearish Correction Ahead! Sell!
Hello,Traders!
DXY is heading up to retest
A strong supply level at 105.83
And the index is locally overboguht
So after the retest we will be
Expecting the price to make
A local bearish correction
Sell!
Like, comment and subscribe to help us grow!
Check out other forecasts below too!

NG1!: Market of Buyers
Balance of buyers and sellers on the NG1! pair, that is best felt when all the timeframes are analyzed properly is shifting in favor of the buyers, therefore is it only natural that we go long on the pair.
❤️ Please, support our work with like & comment! ❤️

FTSE 100, Consolidating, This Scenario Can Alter The Situation!Hello Traders Investors And Community,
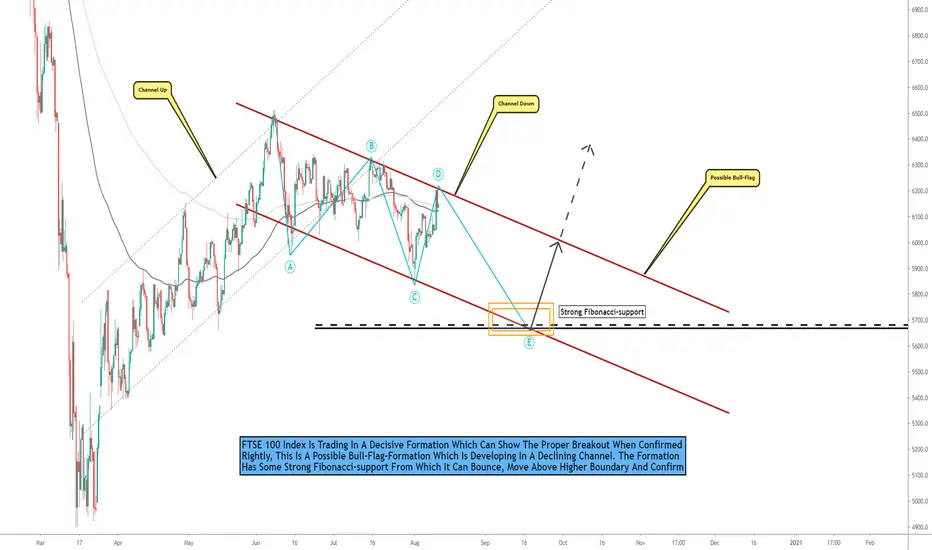
Welcome to this analysis where we are looking at the FTSE 100 Index, what it is currently doing, the overall formation, the possibilities when certain confirmations occur, and how to handle upcoming changes. The FTSE is an index which has developed a longer consolidation period after its recovery approach from the corona breakdowns seen this year, the big question as it is also the same in other major indices is if this recovery can sustain further within a healthy unspeculative market environment or if there is more downside ahead especially when an increase in corona shows bearish downside action similarly to those mechanisms seen this year.
Looking at my chart you can watch there that the index is trading in a longer stretched descending parallel channel which is marked in red where it is consolidating slightly to the downside and already touched the upper and lower boundary several times, such formations tend to break out sooner or later and the longer such formations develop the heavier and more volatile the breakout will be. Technically speaking the consolidation can go on more time when there is no positive news event which is altering the situation immediately to the upside, furthermore, the wave count establishing supports this scenario where the final wave E can form over the next times while the upper boundary confirming bearish again this final wave is not far away and within the high possible range. When this happens and the final wave develops the index has some solid support at the Fibonacci-support seen in my chart which is the 50 % level of the whole wave up, this support is also matching with the lower boundary of the channel where a bounce can be given and expected. When the index bounces in this area it can move on to confirm the bull-flag which will activate targets way above the range but the importance is to show up with the confirmation.
This possible bull-flag breakout can confirm a healthy bullish edge but that does not mean the whole index is completely bullish as there are still strong resistance levels and the index is trading way below its all-time-high-condition, therefore we should not keep the bearish scenario fully by side here, the bull-flag can confirm bullishness on the short and long-term but that does not mean it will definitely go up into the long term as well, in this case the bull-flag can be traded on the long-side but it should be seen crucial when it is approaching resistances in the range above.
In this manner, thank you for watching the analysis, support for more market insight, and all the best!
Information provided is only educational and should not be used to take action in the market.
SPX, Bull-Flag-Formation, Breakout Incoming!Hello,
Welcome to this analysis about SPX, we are looking at the 4-hour timeframe perspectives. The S&P 500 Index in recent times is forming some interesting structures that can convert into a great breakout with increased volatility as I detected. When looking at my chart now we can watch there how the Index marked above the paramount support level of 4375 marked in my chart in blue, also corresponding with this support level are the 25-EMA in red and the 15-EMA in green building a coherent and solid support base together with the horizontal support. Furthermore, the Index above this level here is building a great bull-flag-formation that is already in the last stages of completion as the wave-count within already finalized the waves A and B in the structure and now with the wave C bouncing in the lower boundary and the main support base it is the likely source of the completion of this whole formation. The bull-flag will finally confirm and activate targets once the Index is marked above the upper boundary, such a movement will indicate further continuations to the upside and activation of the target zone within the 4550 level marked in my chart in black. Once this level is reached it has to be elevated if the Index manages to continue further bullishly or firstly reverses to come up with a pullback which is also not unlikely in this case, it will be an interesting and important development ahead.
In this manner, thank you for watching my update-analysis about the S&P 500 Index and the main bull-flag-formation with the upcoming breakout to consider, support the analysis with a like and follow or comment for more market insight!
Information provided is only educational and should not be used to take action in the market.

DXY Index, Bearish Reversal High Likelihood!Hello,
Welcome to this analysis about the US-Dollar Currency Index, we are looking at the 4-hour timeframe perspectives. As I detected recently the index is forming an important formation that has a high possibility to be the origin of a bearish reversal to the downside that should not be underestimated. As when looking at my chart now we can watch there that this is an ascending-wedge-formation which I have marked with the blue boundaries. Within this wedge, the index has its coherent wave-count with the waves A to E already completed and therefore technically the wave-count-basis of the wedge finalized. This is why the likelihood that the wedge confirms bearishly to the downside in the near future is higher, such confirmation will finally happen when the index closes below the lower boundary of the formation which will be the origin for further bearish downside price-action as it is marked in my chart with the final confirmation. Once the whole wedge-formation is completed bearishly the index will appoint the target-zone and when the targets have finally reached the situation needs to be elevated anew if the index manages to hold this zone or continues bearishly further.
In this manner, thank you for watching my analysis about the DXY Index and the highly likely bearish reversal incoming in the near future, great when you support it with a like and follow or comment for more market insight!
Information provided is only educational and should not be used to take action in the market.

DAX Index Is Forming This Decisive Ascending-Wedge-Formation!Hello,
Welcome to this analysis about the DAX Index in which we are looking at the 4-hour timeframe perspectives. In trading, it is always necessary to assess the market by a neutral perspective to come up with the most possible scenarios and move on with the opportunities resulting out of it rather than over-speculating the market into a one-sighted direction in which one does not have an exit plan and gets overwhelmed by circumstances when they show up. In this case, now I discovered a very interesting formation developing in the Dax Index and what are important factors, upcoming determinations, and aftermath-developments we should consider in this structure.
Structural Developments:
As when looking at my chart now we can watch there how the Index has emerged with this major ascending-wedge-formation in the structure marked in my chart with the black boundaries. Within this ascending-wedge the Index has the coherent wave-count with the waves A to E almost all already completed and now the index already showed up with an increased bearish pullback from the 15800 level in which it is testing and penetrating the lower boundary of the formation now again. Furthermore, it is necessary to register that the index moved below the 45-EMA marked in my chart in red which was previously support and is now a strong resistance by which a pullback is highly likely.
Upcoming Determinations:
Taking all these factors into the consideration the index is in a decisive situation now as when bearishness increases further in the near future this will lead to a breakout below the lower boundary and such a breakout, as it is marked in my chart, will complete the ascending-wedge-formation bearishly to the downside and the index will highly possibly move on with further bearishness to the downside. The final wedge-completion will activate the targets within the 14800 level marked in my chart in blue and when these targets are reached the situation needs to be elevated anew, it is also strong support therefore a stabilization in this structure has increased potential.
In this manner, thank you for watching my analysis about the DAX Index and the important decisive ascending-wedge-formation currently forming, great when you support it with a like and follow or comment, all the best!
"There are many roads to prosperity, but one must be taken."
Information provided is only educational and should not be used to take action in the markets.

Usd still bullish,but could see some headwindsUsd broke up higher into the green zone as shown on chart. Could face some strong R here. Just watch and act accordingly.
Cheers!
**Find out more from my Tradingview Stream this week**
***************************************************************************************
Hello there!
If you like my analysis and it helped you ,do give me a thumbs ups on tradingview! 🙏
And if you would like to show further support for me, you can gift me some coins on tradingview! 😁
Thank you!
Disclaimers:
The analysis shared through this channel are purely for educational and entertainment purposes only. They are by no means professional advice for individual/s to enter trades for investment or trading purposes.
The author/producer of these content shall not and will not be responsible for any form of financial/physical/assets losses incurred from trades executed from the derived conclusion of the individual from these content shared.
Thank you, and please do your due diligence before any putting on any trades!

QQQ: Growth & Bullish Continuation
Remember that we can not, and should not impose our will on the market but rather listen to its whims and make profit by following it. And thus shall be done today on the QQQ pair which is likely to be pushed up by the bulls so we will buy!
❤️ Please, support our work with like & comment! ❤️


SPY: Bullish Forecast & Outlook
The recent price action on the SPY pair was keeping me on the fence, however, my bias is slowly but surely changing into the bullish one and I think we will see the price go up.
❤️ Please, support our work with like & comment! ❤️

NASDAQ, Penetrates Key Upper-Boundary, Upcoming Perspectives!Hello Traders Investors And Community,
the NASDAQ in recent times as I discovered is showing up with some interesting signs in the structure as there remain important resistances it can also not be kept from the desk that there is a potential to see a determined continuation of the previously established uptrend therefore however the NASDAQ needs to show decisive price-action in which it has the ability to breakout above this main ascending-channel-formation I discovered recently. When this is the case and the NASDAQ manages a sustainable breakout with an increase of spread and volatility this can lead to great upcoming potentials in the structure and activation of further targets, therefore I detected all the important levels and likely destinies we should consider.
As when looking at my chart we can watch there how the NASDAQ developed this massive ascending-channel-formation in which it has two significant zones, the first is the lower accumulation range and the second is the higher distribution range. Furthermore, the NASDAQ has the coherent wave-count within the channel in which it already completed the waves A to C in the structure and is now approaching the distribution range once again which is a very likely origin of wave D to the downside as the distribution will follow-up here. This wave D will then move on to test the lower accumulation range marked in green which is an important zone to hold and back up for the NASDAQ.
Taking all these factors into the consideration it will be highly important on how the NASDAQ continues within this channel-formation, when it moves on with the wave-count as expected and completes it to finally show up with further bullish demand-increase this can lead to a dedicated upside-breakout sooner or later in which NASDAQ will provide the right setup for a wave-E-extension to the upside with increased spread and volatility as it is seen in my chart. For now it will be important on how the NASDAQ moves on with the developments especially with the incoming distribution when this shows up as expected the further assumptions can be made, it will be an interesting journey to come.
In this manner, thank you for watching my analysis about the NASDAQ and this massive ascending-channel-formation, the coherent wave-count, and what exceptional determinations we should expect in the upcoming times, will be great when you support it with a like and follow or comment, great contentment for everybody supporting, all the best!
Information is only educational and should not be used to take action in the market.

✅NI225 MOVE DOWN AHEAD|SHORT🔥
✅NI225 grew again to retest the resistance of 33.765
But it is a strong key level
So I think that there is a high chance
We will see a bearish pullback and a move down
SHORT🔥
✅Like and subscribe to never miss a new idea!✅

DOW JONES, Clean Breakout Of The Descending-Triangle!________________________________________________________________________________________________
Hi Traders, this is a signal I give to you for free today. The DOW INDEX has formed a clear triangle breakout
with volatility and completed above the 400-EMA where entry with pull back is possible.
________________________________________________________________________________________________
ENTRY: 27800-27300
MINIMUM TARGET: 28500
STOP LOSS: 26300
MINIMUM RISK REWARD: 1
REASON: Descending-Triangle Breakout
________________________________________________________________________________________________
In this manner, thank you for watching and support for more market insight.
Information provided is only educational and should not be used to take action in the markets.
________________________________________________________________________________________________

SPX500, Testing Next Levels, Why Not To Underestimate It! Hello Traders Investors And Community,
Welcome to this analysis where we are looking at the SPX 4-hour timeframe perspective, the recent events, the current formational structure and what we can expect the next times, since the index provided like other major indices previously heavy bearish volatility we should not keep this by side and look what the market is doing now, it will be a precarious and crucial situation as the crisis is still not confirmedly over and the index is now trading below the pre-corona highs established this means the market has to stabilize any way and move together with real economy to get a healthy market environment at the end of the day, the established bearishness should not be underestimated in any case as could possibly also be fundamentally backed therefore I detected the important levels and possible outcomes we should consider on the technical side here.
Looking at my chart you can watch there the SPX now trading below several major resistance levels which previously held as a support are now broken to the downside, this is firstly the 90-EMA marked in black, secondly the horizontal resistance in grey and the middle line of the current channel the index is trading in, this means the index has a serious resistance cluster here which has potential to be the origin of further declines when it is not taken out substantially. When the index does not manages to move above this cluster and close above it near the next times the next leg to the downside follows likely as it is marked in my chart, considering this the index has next support at the rising trendline of its previously established channel and below this at the 600-EMA in green where it can stabilize, however, these levels are critical when they do not hold substantially and the index falls below the red level marked in my chart at 2980 this will invalidate the major bullish count firstly and will result in protracted bearishness to the downside as more highs are firstly invalidated, therefore the index needs to stabilize before considering any new highs to be measured.
In this manner, thank you for watching, support for more market insight, good day to you, and all the best!
Science is organized knowledge. Wisdom is organized life.
Information provided is only educational and should not be used to take action in the markets.

Patterns In The US Dollar Index!Hello Traders Investors And Community, welcome to this analysis where we are looking at the US Dollar Currency Index 12-hour timeframe perspective, the patterns formed in its established downtrend, the current pattern forming which can alter the dynamic, what the index needs to show to alter the dynamic and how possible outcomes can look like. The index is still trading in a well-established downtrend forming one bearish formation after another, in such downtrends is a big question sophisticated traders should ask us when these downtrends ending because they can't go on forever as the relative strength dynamic getting in the oversolid region and the price normally reverses sooner or later such a possible reversal I detected also in the index now where I found the importances we should take into consideration for further possible outcomes and how they can show up like.
Looking at my chart you can watch there that the index is building a possible bullish reversal formation since a long time now which can possibility to reverse the dynamic and turn the established downtrend into bullish , in this case there are some importances which need to be fulfilled in order to show up with the complete confirmation, once it is the breakout of the upper boundary of the possible ascending channel to the upside which does not necessarily mean the index will completely continue bullish to the upside as there is still the primary resistance-line lying marked in blue within my chart, where the index has to show if it can move above the resistance or bounce back again, when the index shows up with this there is the secondary resistance-line which also needs to be taken out, when this happens the structure can be confirmed into the bullish range above the last resistance line.
Sometimes such formations can also invalidate to the downside, in this case, we are speaking of a fake descending-channel-formation, this will happen when the lower boundary is completely broken to the downside with a volatile bearish move, therefore it is from high importance to wait on the proper confirmation of the triangle before moving in the direction. When the index does not show up with the proper confirmations a higher possibility is given for continuation to the downside confirming into lower levels in the range, we will see how this will play out and how the index will develop next times, especially when considering new volatile movements entering the market regarding corona increase again which already provided high volatility this year this can lead to some volatility where the index goes into the opposite direction like other antyciclical assets like stocks.
In this manner, thank you for watching, support for more market insight, all the best!
Information provided is only educational and should not be used to take action in the markets.

D-JONES, Gap Will Fill Soon, Possible Reversal Ahead!Hello Traders Investors And Community, welcome to this analysis where we are looking at the DOW JONES 4-hour timeframe perspectives, the upcoming decisive events in the structure, what we can expect after these events occurring and how possible outcomes can show up in the schedule. The DOW like other major indices recovered somewhat from the corona-breakdowns and lows seen this year where the SPX already made a new all-time-high the DOW is below it and although the indices recovered we should not ignore the fact that the rallies aren't necessarily fundamentally backed as many retailers rushed into the market smart-money staying outside and waiting on the sidelines, not to mention the divergence between real economy and stocks it is important that smart-money enters also where the question pops up if the breakdowns are already over or there is more to come, these facts also coming up in the technical picture of the DOW which is sending some interesting signals at the moment I detected how they possibly can play out over the next times.
Looking at my chart you can watch there that the index is just about to fill its gap which it still has lain there at around the 29.000 level, this gap-fill will highly possible play out the next times and this is also confirming on the smaller timeframes as the index is forming a triangle formation, this highly possible gap-fill can be traded in the long-side with overall targets at the 29.000 level from where the next moves are significantly important. Normally what happens often after such gap-fills reaching the gap and filling it is that supply entered the market as orders get filled and traders take profit, this is what also can show up here making the gap-fill-range around 29.000 a possible short-entry-zone as it is marked in my chart, what is supporting this preliminary pull-back is the fact that the index also ending with a wave-count in this level. This pull-back-scenario will be confirmed when the rising grey trendline is broken with a decisive volatile move to the downside the targets at the blue range can be expected where a support-cluster is lying in which the price can stabilize and back-up.
In this manner, thank you for watching, support for more market insight, all the best!
Information provided is only educational and should not be used to take action in the markets.

Nas100 Bullish Possible break of Daily Zone
*Here we have a possible break of the daily zone.
*We are waiting for a pullback that comes from the key price level @ 15500.
*Stop loss is tight under Mondays low expecting this to be the low of the week
*If trade is missed, look for entries on the 1hr and 15m timeframes

✅VIX RISKY LONG🚀
✅VIX is going down to retest a horizontal support of 12.8$
Which makes me locally bullish biased
And I think that we will see a rebound
And a move up from the level
Towards the target above at 13.5$
LONG🚀
✅Like and subscribe to never miss a new idea!✅

BABA, Breakout Of Triangle, Next Steps Ahead!Hello Traders Investors And Community,
Welcome to this analysis where we are looking at BABA 4-hour timeframe perspective which is has shown some interesting confirmational and volatile signs recently, therefore, we are looking at recent events, the current price-structure, what we can expect next times, how possible entries can look like and how to handle upcoming situations properly.
Looking at my chart you can watch there that the stock just formed this massive and decisive ascending-triangle-formation which upper boundary and lower boundary are marked in blue, as this triangle has confirmed now properly with a volatile bullish move to the upside this gave a good and healthy edge for further upside ahead. Currently, the stock is approaching some resistance in the level where a pull-back to the upper boundary of the formation is possible as it is seen in my chart, furthermore, the stock has some solid support in this range which is given by the 50-EMA marked in red and below still the 100-EMA in black, these factors making it highly possible support to be confirmed when touched in this area, it is also a good point to open long in this range as it is marked in my chart, with the breakout the stock activated the minimum target which you can watch marked at the 299-300 level, when the stock approaches this it has to be elevated how it will continue further in the range, overall there is definitely some more upside possible.
Although it is possible to increase further in growth above the minimum target it has to be elevated how the stock approaches this range and if there are urgent bearish signs in this range, how they look like or the stock just manages to move above this level and go further.
In this manner, thank you for watching, support for more market insight, all the best!
"Trading effectively is about assessing possibilities, not certainties."
Information provided is only educational and should not be used to take action in the markets.

SPX, Formed New All-Time-High, These Scenarios To Consider Now! Hi my friends,
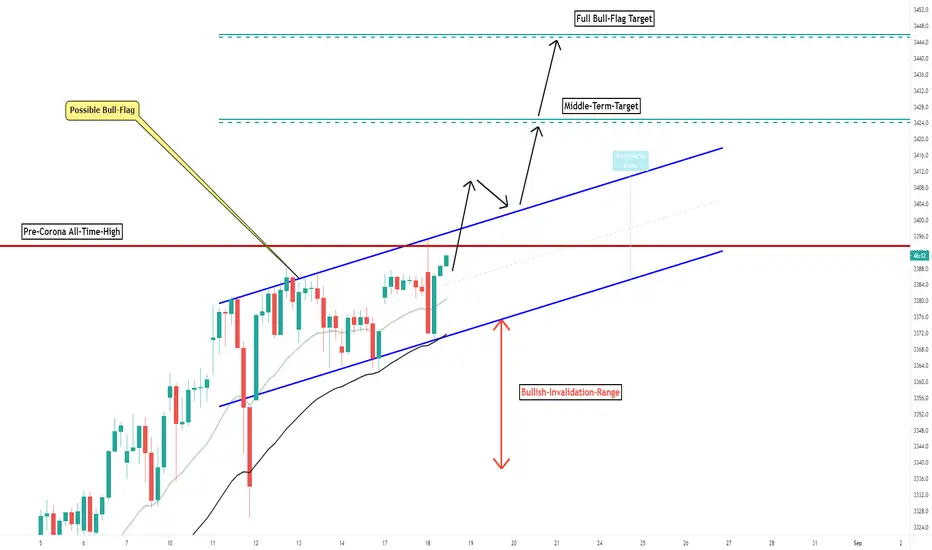
Welcome to this 1-hour timeframe perspective SPX update, the index recently confirmed a new all-time-high which exceeded the pre-corona all-time-high, now the index is in a decisive situation as the price just pulled backward right after the breakout which can indicate a bull-trap, a close above the level would have been a stronger move now the index has to show certain price-action to make it a sustainable breakout or decline will set in.
You can see in my chart the possible bull-flag the index is forming here marked in blue with the new all-time-high marked just touching the upper boundary of this bull-flag-formation, what is important now to confirm this bull-flag rightly is to move above the established high and close above the upper boundary of the possible bull-flag otherwise when this does not happen and the index fails here this can just be a bull-trap which reverses course to the downside, this will show up when the index moves below the lower boundary and below the 40-EMA marked in black but as the index still holding above these supports the bullish breakout scenario is more likely. This ongoing mechanism can be traded either aggressively with an entry in the bull-flag or conservative when entry after confirmation, although the aggressive entry, is possible the conservative will be much better as the price confirms the formation and activates the targets.
Next times will show if this new established high will sustain and follow up with new highs or this was just a huge bull-trap invalidating to the downside, what is important to keep in mind that there are still big divergences between real economy and stocks while the real economy is damaged stocks making gains this can lead to a speculative environment, therefore we need to elevate further and if SPX manages to move above the range and form new highs how it establishes there as fundamental factors not necessarily supporting a rally.
In this manner, thank you for watching, support for more market insight, all the best!
Information provided is only educational and should not be used to take action in the market.
CISCO, Possible Inverted H&S, These Level To Consider Now!Hello Traders Investors And Community, welcome to this analysis where we are looking at the stock value CSCO (CISCO) 4-hour weekly timeframe perspective, the recent events, the current meaningful formation building, what to expect the next times, which level are important to hold and how to handle upcoming situations out of a trading perspective. CSCO was since the corona crisis technically one of the weaker stocks trading below the 55-EMA measure and way below its established all-time-high, now this does not mean it is bearish forever and continue as I detected some signals which can indicate a follow-up of this stock to the main market, but the importance in the CISCO environment here is that it needs to confirm certain levels before such a follow-up can be considered at all but when these conditions fulfill the stock has some potential in the current structure building up.
In my chart, you can watch that the stock just forming somewhat of a correction currently where it is correcting the uptrend established since the corona bottoms seen this year, the incoming volatility is higher but it can slow down when nearing to the support in the structure which the stock has at the 300-EMA marked in black where also important Fibonacci-supports lie. Therefore it is important that the stock bounces here and it is a needed condition in order to complete the big possible head and shoulder formation seen in my chart marked in blue, which will confirm when the stock stabilizes at the EMA and bounces from there, this move is highly important because when this does not happen and the stock falls below it this invalidates the whole head and shoulder formation within the invalidation range marked with the arrows in red where the stock will increase bearishness in this area.
When the stock manages to hold the EMA support and bounce from there a move towards the blue neckline can be expected, when this happens it is important to move above it the best with a volatile upside move closing above the neckline which will confirm the inverse head and shoulder formation which will provide the proper entry setup for entering a position here as this is seen in my chart, in this case, the stock can bounce from the 55-EMA in green which will be a good point for opening a position, although the aggressive immediate entry approach is also possible here the conservative will be better to wait on the confirmation and then enter. When this scenario is playing out properly there can be decent upside targets expected which can even exceed the established all-time-highs therefore a smart consideration to open positions before the masses enter, remember to wait on confirmation which is the best process here.
In this manner, thank you for watching the analysis, support for more market insight, a good weekend and all the best!
"Trading effectively is about accessing possibilities, not certainties."
Information provided is only educational and should not be used to take action in the market.

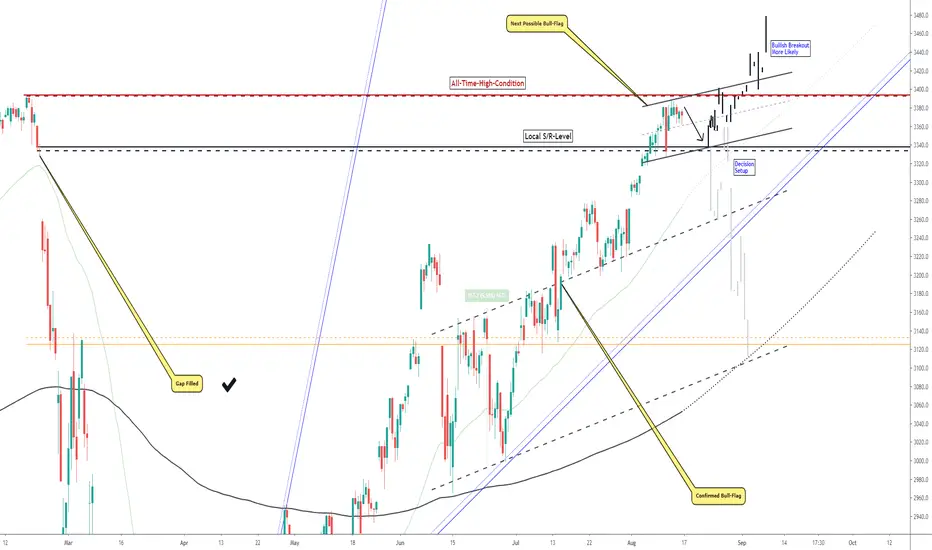
SPX500, Trading Between The Lines, Breakout Or Pull-Back?!Hello, Traders Investors And Community, welcome to this analysis where we are looking at the SPX500 4-hour timeframe perspective, the recent events, the current formational structure, the upcoming price-actions, and how to handle the situation. As the stock market has recovered from the heavy corona-breakdowns seen this year many people looking at the major S&P 500 index and think what it will do next, the big question is now if the index can succeed in making a new high despite the still damaged real economy or if the bearishness sets in again supported by a second corona increase and the following measures taking place. In order to look at this problem in the right manner, we should keep in mind that the real economy and stock-market still showing big divergences to one another, while the real economy is still damaged and in a set-back due to coronas breakdowns the stock-market making gains mainly of the retailers rushing into the market while smart-money staying outside which can lead to a speculative market environment which need to be fixed in order to provide healthy growth in both factors.
The indecision and divergence can also be seen not only in fundamental aspects but also technical as you can watch examining my chart the index has formed a bigger bull-flag already which confirmed to the upside, filled the gap and noted above this level where it is now somewhat consolidating and forming another second possible bull-flag, which is smaller but it can show a more decisive breakout as the bull-flag is forming right slightly below the all-time-high-condition you can watch marked in red. This fact can either mean that the bull-flag will follow up with a strong upside breakout providing new all-time-highs or with a break below and a possible double top which can move the price way lower in the structure. As the index still has some solid support levels in the range forming with the S/R-level marked in black and the 55-EMA we can come to the conclusion that a bullish upside breakout is more likely and possible as the downside one because the index firstly has to take out the remaining supports where it will have a hard time to do so, in this case, the upside breakout after consolidation can be more expected.
When the index shows up with the more likely upside breakout this does not mean the index is completely bullish as this can still be a bull-trap and furthermore the index is trading in a weak uptrend with slowing down momentum which needs to increase when the breakout to the upside should be sustainable and last away, much more important than this is the fact that the real economy needs to grow together with the stock-market to make it a solid breakout and continuation potential with upcoming prosperity as it was seen in the past, we just have to imagine that the market needs to grow also without money printing into the market from central banks and on which point the price would be without these substitutions. Such mechanisms just ensure that a bigger crash postpones sooner or later as the situation gets intolerable we should see the current rally and possible breakout with continuation in a critical light to not get overwhelmed by circumstances if the environment reverses to the other side as this was factly true with many happening this year.
In this manner, thank you for watching the analysis, support for more market insight, a good weekend and all the best!
"There are many roads to prosperity, but one must be taken."
Information provided is only educational and should not be used to take action in the market.
GOLD: Bulls Will Push Higher
Looking at the chart of GOLD right now we are seeing some interesting price action on the lower timeframes. Thus a local move up seems to be quite likely.
❤️ Please, support our work with like & comment! ❤️
