Occidental Petroleum - Warren Buffett's Strong EndorsementWhy Buying Occidental Petroleum (OXY) is a Good Investment
Warren Buffett's Strong Endorsement
Berkshire Hathaway, led by Warren Buffett, has been consistently increasing its stake in OXY, holding over 25% of the company. Buffett's long-term approach and confidence in OXY suggest strong fundamentals and future growth potential.
Solid Financial Performance
OXY has a P/E ratio of 20.95 and a profit margin of 19%, showing strong profitability in the energy sector. Its ROE of 15% indicates effective management of shareholder equity.
Strong Free Cash Flow (FCF)
The company generates around $1 billion in free cash flow, which enables it to reduce debt, buy back shares, and pay dividends—key factors Buffett looks for in an investment.
Favorable Industry Trends
With growing global energy demand and OXY's focus on low-cost production, the company is well-positioned to benefit from higher oil prices and long-term energy market stability.
Debt Reduction & Financial Strength
OXY has significantly reduced its debt-to-equity ratio (0.85), strengthening its balance sheet after the Anadarko acquisition. Buffett prefers companies that prioritize financial discipline.
Carbon Capture & Future Growth Potential
OXY is a leader in carbon capture technology, positioning itself for long-term sustainability as the world moves toward cleaner energy solutions. This gives it a competitive edge in the evolving energy market.
Buffett's Potential Full Acquisition
With Berkshire Hathaway increasing its stake and securing regulatory approval to buy up to 50% of OXY, there is speculation that Buffett may eventually acquire the entire company. This could drive further price appreciation for OXY shares.
Conclusion
Buffett's heavy investment in OXY, combined with strong financials, solid cash flow, and promising energy market trends, makes the company an attractive value play for long-term investors.
Longsetup

Price target XAU ! ATH 3045
⭐️GOLDEN INFORMATION:
Gold prices (XAU/USD) continue their upward trajectory for the second consecutive day, marking gains in five of the last six sessions and surging to a new all-time high near the $3,010 mark during Tuesday’s Asian session. Mounting uncertainty surrounding President Donald Trump’s trade tariffs, coupled with growing concerns of a US recession, has strengthened safe-haven demand for the precious metal. Additionally, escalating geopolitical tensions in the Middle East provide further support to bullion. Market expectations of additional Federal Reserve (Fed) rate cuts, reinforced by lackluster consumer spending data released on Monday, further bolster the appeal of the non-yielding yellow metal.
⭐️Personal comments NOVA:
move in the uptrend line, tariff
⭐️SET UP GOLD PRICE:
🔥SELL GOLD zone: $3021 - $3023 SL $3026 scalping
TP1: $3017
TP2: $3010
TP3: $3003
🔥SELL GOLD zone: $3044 - $3046 SL $3051
TP1: $3035
TP2: $3020
TP3: $3000
🔥BUY GOLD zone: $3003 - $3001 SL $2996
TP1: $3009
TP2: $3015
TP3: $3023
⭐️Technical analysis:
Based on technical indicators EMA 34, EMA89 and support resistance areas to set up a reasonable BUY order.
⭐️NOTE:
Note: Nova wishes traders to manage their capital well
- take the number of lots that match your capital
- Takeprofit equal to 4-6% of capital account
- Stoplose equal to 2-3% of capital account

Good Trade SetupIt has taken a Support from
a Very Strong Level around 90 - 94.
Immediate Resistance is around 110 - 113
Day / Swing Traders may enjoy 5 - 7 rupees profit.
Good Support level is around 102.50 - 104.50
The Stock has the potential to reach upto 120 - 130
& if this level is Crossed with Good Volumes,
Next Target can be around 150+
96 is an Important level that should not break now.


MDT ANALYSIS📊 #MDT Analysis
✅There is a formation of Descending Channel Pattern in daily chart. Currently #MDT is in bearish way.
After a breakout of the pattern and major resistance level we would see a bullish momentum otherwise the price will drop more 🧐
👀Current Price: $0.02980
⚡️What to do ?
👀Keep an eye on #MDT price action and volume. We can trade according to the chart and make some profits⚡️⚡️
#MDT #Cryptocurrency #Breakout #TechnicalAnalysis #DYOR

ES futures update 17/03/'25Last week, I mapped out some trading zones that are still valid and unchanged.
The 4H supply zone has broken out, so I will be looking for a long position after a retest of this broken supply zone, which should now act as support.
My last trade was a short from this zone, resulting in a small profit since market closing prevented reaching the full take-profit target.
Let's see if the bullish momentum can hold during the retest entry.
As always, follow for more market updates.

HBAR LONGwe can see range on daily chart. We are now on the lower band where we can look for long setups. Little specaultive trade can be seen on chart.
What give the confidence in this trade?
if you look OBV is incresing specialy from prevous low the OBV value is much higher!
Tha means we have strong buying presure.
Have a nice day and Be safe ;)

PayPal - Multiple Signals Pointing to a Potential Bottom!I’ve just entered a position in PayPal, and the reason is that several overlapping factors are lining up in a way that suggests a potential bottom may be in.
First, it looks very likely that Wave (2) is complete. The stock tapped the 61.8% Fibonacci retracement level with precision and has held that level over the past few days – all while the RSI has been climbing, which is a strong bullish divergence signal in my book.
Second, PayPal just touched last year’s VWAP level perfectly, which I view as another strong technical indicator for a potential reversal.
How far this move could go is still unclear, but the open gap above is definitely something I’m watching closely. For that to be in play, $71 needs to be reclaimed. And from here on, $66 should not be touched again.
That’s my plan – and that’s how I’m trading it. Let’s see if the market plays along.

atom buy midterm"🌟 Welcome to Golden Candle! 🌟
We're a team of 📈 passionate traders 📉 who love sharing our 🔍 technical analysis insights 🔎 with the TradingView community. 🌎
Our goal is to provide 💡 valuable perspectives 💡 on market trends and patterns, but 🚫 please note that our analyses are not intended as buy or sell recommendations. 🚫
Instead, they reflect our own 💭 personal attitudes and thoughts. 💭
Follow along and 📚 learn 📚 from our analyses! 📊💡"

#1000XUSDT is setting up for a breakout📉 Long BYBIT:1000XUSDT.P from $0,05470
🛡 Stop loss $0,05297
1h Timeframe
⚡ Plan:
➡️ POC is 0,04229
➡️ Waiting for consolidation near resistance and increased buying activity before the breakout.
➡️ Expecting an impulsive upward move as buy orders accumulate.
🎯 TP Targets:
💎 TP 1: $0,05640
💎 TP 2: $0,05775
🚀 BYBIT:1000XUSDT.P is setting up for a breakout—preparing for an upward move!

trendline H1, gold price follows the main trend of increasing⭐️Smart investment, Strong finance
⭐️GOLDEN INFORMATION:
Gold (XAU/USD) consolidates near its record high from the Asian session on Friday, trading within a narrow range. Investor concerns over President Donald Trump's aggressive trade policies and their potential global economic impact sustain demand for the safe-haven metal. Additionally, growing expectations of further monetary easing by the Federal Reserve (Fed) provide additional support to the non-yielding bullion.
⭐️Personal comments NOVA:
Sideway and accumulation continue the uptrend back to the $3000 price zone
⭐️SET UP GOLD PRICE:
🔥SELL GOLD zone: $3021 - $3023 SL $3028
TP1: $3010
TP2: $3000
TP3: $2990
🔥BUY GOLD zone: $2940 - $2942 SL $2935
TP1: $2950
TP2: $2960
TP3: $2970
⭐️Technical analysis:
Based on technical indicators EMA 34, EMA89 and support resistance areas to set up a reasonable BUY order.
⭐️NOTE:
Note: Nova wishes traders to manage their capital well
- take the number of lots that match your capital
- Takeprofit equal to 4-6% of capital account
- Stoplose equal to 2-3% of capital account


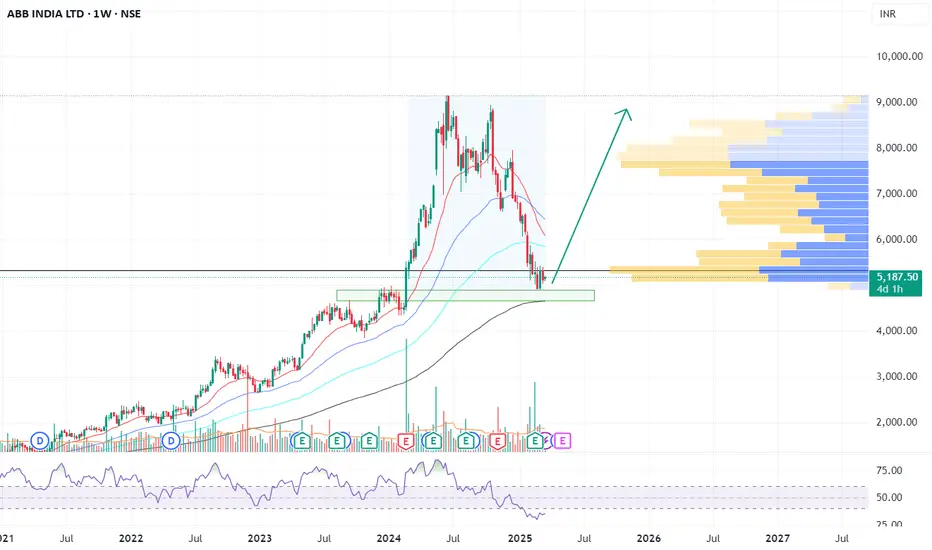
ABB India Ltd. (NSE: ABB) - Technical Analysis & Market OutlookABB India Ltd. (NSE: ABB) - Technical Analysis & Market Outlook
Overview:
ABB India Ltd. has demonstrated significant price action over the past few years, with a strong uptrend followed by a corrective phase. The current price action suggests a potential reversal from key support levels, presenting an opportunity for long-term investors and swing traders.
Key Observations:
Support Zone: The stock is currently testing a major support level around ₹5000 - ₹5200 , which aligns with a previous accumulation zone and historical resistance-turned-support.
200-Week Moving Average: Price action is hovering near the 200-week moving average, which has historically acted as a strong dynamic support.
RSI & Momentum: The Relative Strength Index (RSI) has moved into oversold territory and is now showing early signs of a potential reversal.
Volume Profile Analysis: The highest volume concentration is observed around the ₹6000-₹7000 range, indicating a major supply zone where price may retest if a reversal occurs.
Price Structure: The formation suggests a higher low structure , which is a positive sign for bullish continuation.
Potential Trade Setup:
Entry : Around the current levels of ₹5100-₹5200 with confirmation of bullish momentum.
Stop-Loss : Below ₹4800, as a break of this level may invalidate the bullish thesis.
Target 1 : ₹7000 (previous consolidation zone & high-volume area)
Target 2 : ₹9000 (previous swing high & psychological resistance)
Conclusion:
ABB India Ltd. is currently at a critical juncture, with strong confluence of technical factors supporting a potential upside move. Traders should monitor price action closely for confirmation before entering. If the support holds, the stock has a high probability of reversing towards higher levels.
Disclaimer: This analysis is for educational purposes only and should not be considered as financial advice. Conduct your own research before making any trading decisions.
GOOGL ON SUPPORT: 23% BOUNCE IMMINENTNASDAQ:GOOGL GOOGL has consolidated significantly over the last few weeks and, like the NASDAQ, has also taken a beating. Due to the now attractive valuation, the continued stable growth and earnings growth, GOOGL is still a good investment.
Technically, we have reached a trend line and a weaker horizontal support with a further support area at around USD 150. We are already seeing the first RSI divergence. The Bollinger Bands (not shown in the chart, otherwise it would be confusing) are also far overstretched and make a bounce likely. There is also an open gap at $192 - $203.
I would open about 50% of the actual trading position now and the rest when the price falls into the green box, which I still consider to be a possible consolidation area. If the price turns immediately, we are still in with half.
Target Zones:
$192.00
$205.00
Support Zones:
$165.00
$150.00

BNB/USDT: BREAKOUT SETUP!!🚀 Hey Traders! Ready to Ride the BNB Breakout? 👋
If you’re hyped for this setup, smash that 👍 and hit Follow for elite trade ideas that actually deliver! 💹🔥
🔥 BNB Breakout Alert – Big Move Incoming! 🔥
BNB is looking strong and bullish, breaking out from a bull flag formation on the 4H timeframe. If it holds above the flag, we could see a massive 40% surge! 📈
💰 Trade Setup:
📍 Entry Range: $588 - $600
🎯 Targets: $628 / $688 / $746 / $794 / $844
🛑 Stop-Loss: $566
⚡ Leverage: Low (Max 5x)
🔎 Strategy: Enter with low leverage now, add more on dips, and ride the momentum to higher levels!
💬 What’s Your Take?
Are you bullish on BNB’s breakout potential? Share your analysis, predictions, or strategies in the comments! Let’s secure those gains and ride this wave together! 💰🚀🔥

Bitcoin’s Battlefield: Support, Resistance and Trade SetupsBitcoin’s price has been showing signs of a sustained downtrend after forming a double top pattern. The recent action, combined with low volume and failure to breach key resistance zones, points to a likely retest of lower levels. Over the weekend, the price couldn’t break past the 85K resistance, and the low trading volume around this level suggests that buyer interest is waning.
6H TF Chart:
Big Picture vs. Short-Term Action
On a higher timeframe (6H), my indicator neatly outlines the bear market of 2022 and the bull market that started in early 2023—when the “cloud” turned green, signaling a shift in momentum. The cloud's lower boundary is currently at $73,364, which is key. Imo, holding above 70K is critical for keeping that bullish vibe alive.
1H TF Chart:
Switching over to the 1H chart, the picture shows a bearish structure. The upper resistance around 95K (which aligns with the yearly open near $93,455.85) is proving a solid resistance. The anchored VWAP from the all-time high also sits right at this level, adding more weight to the resistance. Bulls need to clear this yearly open to signal a true recovery.
Key Levels & Confluence Zones
1.) Upper Resistance – 93K to 95K:
The 95K zone aligns closely with the yearly open ($93,455.85) and the anchored VWAP from the all-time high, both acting as resistance.
Daily moving averages (62 EMA at ~$91,316 and 62 SMA at ~$94,900) provide further confluence.
Additional resistance between 85K-86K.
2.) Critical Support – 73K to 70K Zone:
The lower edge of the cloud on the 6H timeframe sits around 73K.
The 0.382 Fibonacci retracement (from the low at $15,473.78 to the all-time high at $109,354) is at $73,492, while the 0.618 retracement (from $49,217 to the all-time high) is around $72,205.
Moving Averages on Weekly Chart: The weekly 62 EMA ($72,919) and 62 SMA ($71,590) align well with this support region.
Additional Support: A bullish monthly order block at $71,320 adds another layer of confluence.
Psychological Importance: A hold above 70K is critical to maintaining bullish momentum.
3.) Monthly Open – $83,385.74:
This level serves as a pivot: price is currently hovering below it. A reclaim by bulls would be a positive sign for higher price action, while a rejection reinforces the bearish setup.
Trade Setups
Long Trade Setup:
Entry: Consider laddering in between 75K and 70K as the price retests support.
Take Profit: Aim for the monthly open (~84K) initially, and if support holds and flips, a move toward 90K could be considered.
Stop Loss: Set below 70K to protect against a further downturn.
Short Trade Setup:
Entry: A short setup can start at the monthly open, using a laddering approach between 84K and about 86.9K.
Take Profit: Target the previous low or 74K.
Stop Loss: Place just above 87K to keep risk in check.
Thank you for taking the time to read through this technical analysis. I hope it provides valuable insights for your trading decisions. Happy trading!

$TRUMP ─ @realDonaldTrump Long Trade SETUP$TRUMP ─ @realDonaldTrump Long Trade SETUP 👀
Looking for another long trade entry.
⚠️If the Twin OB fails, then a new low is on the table.
ENTRY = TwinOB + FibFan + nPOC + Fib Golden Pocket + WO + DO
SL = below VAL + TwinOB
------------
------------
As always, my play is:
✅ 50% out at TP1
✅ Move SL to entry
✅ Pre-set the rest of the position across remaining TPs
It's important to take profits along the way and not turn a winning trade into a losing trade.

XRP: The Calm Before the ExplosionXRP has been in strong 100-day accumulation, with a few deviations along the way. Many altcoins have formed reversal patterns, and XRP is setting up for a sharp move upwards. Expecting a breakout from this consolidation phase, potentially propelling XRP to #2 in market cap. The stage is set for a major run!
Entry: NOW
TP: 4

BNB: 380 Days of Accumulation – Big Move Ahead?For over a year, BNB has been in a steady accumulation phase, holding strong while most alts dropped 80-90%. Its resilience in bear markets signals strength and stability, making it a solid contender for the next bull run. A breakout from this range could bring significant upside.
Entry: NOW
TP: 2000


EPIC/USDT Futures: Descending Triangle Breakout or Breakdown?Crypto Futures Technical Analysis (EPIC/USDT - 15m Chart)
1. Trend Direction:
The price is forming a descending triangle, indicated by the downward-sloping yellow trendline.
The trend is bearish, with lower highs being formed, suggesting strong selling pressure.
2. Key Support & Resistance Levels:
Support: Around $1.652 - $1.683 (highlighted in purple), where price recently bounced.
Resistance: At $1.819 - $1.85, near the descending trendline.
3. Potential Breakout or Reversal Points:
If the price breaks below the $1.652 support level with strong volume, a further drop is likely.**
If the price bounces and breaks above $1.819, it could confirm a bullish breakout.
4. Entry & Exit Points:
Long Entry: If price bounces off $1.652 - $1.683 with bullish confirmation.
Take Profit (TP): Near $1.819 - $1.85.
Stop Loss (SL): Below $1.652 (around $1.630).
Short Entry: If price fails to break $1.819 and rejects the descending trendline.
TP: Near $1.652 or lower.
SL: Above $1.85.
5. Risk-Reward Assessment:
The chart shows a risk-reward ratio greater than 1:2, making the long trade attractive if price holds support.
Watch volume spikes for confirmation—high volume on a breakout confirms strength.
Final Thoughts:
Bullish scenario: A break and close above $1.819 could trigger an uptrend.
Bearish scenario: A breakdown below $1.652 could push the price lower.
Monitor for candlestick confirmation (e.g., bullish engulfing, doji, or hammer at support).
Would you like a more detailed breakdown or strategy suggestions? 🚀

SOL Trading Plan: Stacking Entries Like a ProSolana (SOL) has been in a slow uptrend over the past five days, after hitting the low at $112. The current price action looks like an ABC corrective pattern, which could mean we’re setting up for lower prices.
To get the best trade execution, we'll use a laddered entry approach, meaning we’ll scale into positions gradually instead of going all in at once. This helps us get a better average entry price while managing risk effectively. By placing orders at key levels, we increase our chances of catching the right move without overcommitting too early.
Resistance Zone ($136 - $143.80)
A major resistance zone has formed between $136 - $143.80, where price is likely to struggle. This area contains multiple technical confluences that suggest a potential reversal or strong reaction:
$136 – 0.618 Fibonacci Retracement
$140.09 – 1:1 Trend-Based Fibonacci Extension
$141.40 – Anchored VWAP from the $179.85 swing high
$143.80 – Point of Control (POC) from the 19-day Fixed Range Volume Profile
This makes $136 - $143.80 a prime area to consider short positions, especially if price starts showing weakness.
Support Zone ($102.1 - $98.50)
On the downside, a major demand zone is forming between $102.1 - $98.50, where buyers are likely to step in aggressively. This zone has multiple technical confluences, making it a high-probability long entry area:
$102.1 – 2024 Yearly Open & Monthly Support
$100 – Bullish Monthly Order Block & Anchored VWAP Support
$98.50 – Final key demand zone
This zone presents a solid long opportunity, allowing for gradual scaling into positions as price moves deeper into support.
Short Trade Setup – Laddered Entry Approach
Instead of entering all at once, we’ll ladder into the short position gradually, starting small and increasing size as price moves deeper into resistance.
Short Entry Levels & Position Sizing
Trade Details
Average Entry Price: $140.12
Take Profit Target: slightly above $102.10 (Monthly Level)
Stop Loss: slightly above $146.70 (Above POC)
Risk-Reward Ratio (R:R): ~6:1
Long Trade Setup – Laddered Entry Approach
For the long setup, we start with small entries at higher prices and increase size as price moves deeper into support, ensuring a better average entry in a key demand zone.
Long Entry Levels & Position Sizing
Trade Details
Average Entry Price: $102.72
Take Profit Target: slightly below $120.00
Stop Loss: slightly below $95.00
Risk-Reward Ratio (R:R): ~2.45:1
Market Outlook
Short Bias: Until price reclaims $143.80, this remains a strong resistance zone for potential short trades.
Short Setup: Laddering into resistance ensures better risk management and higher average entry efficiency.
Long Setup: Starting small at $112 and increasing position size down to $98.50 ensures strong positioning in a high-confluence demand zone.
By scaling into trades rather than committing at a single price, we increase flexibility, improve trade execution, and adapt better to price movements. 🚀
Weekly Timeframe - 200 EMA Support
$100 coincides with the 200 EMA on the weekly timeframe, adding confluence to this area as strong support.
If Solana decisively breaks above $144, it would invalidate the short thesis and suggest a potential move higher toward $150. Conversely, a strong rejection from the resistance zone would likely accelerate the move toward $112 to test demand at swing low.

#WUSDT is setting up for a breakout📉 Long BYBIT:WUSDT.P from $0,08897
🛡 Stop loss $0,1985
1h Timeframe
⚡ Plan:
➡️ Waiting for consolidation near resistance and increased buying activity before the breakout.
➡️ Expecting an impulsive upward move as buy orders accumulate.
🎯 TP Targets:
💎 TP 1: $0,09275
💎 TP 2: $0,09465
💎 TP 3: $0,09566
🚀 BYBIT:WUSDT.P is setting up for a breakout—preparing for an upward move!

#AI16ZUSDT is setting up for a breakout📉 Long BYBIT:AI16ZUSDT.P from $0,2037
🛡 Stop loss $0,1985
1h Timeframe
⚡ Plan:
➡️ Waiting for consolidation near resistance and increased buying activity before the breakout.
➡️ Expecting an impulsive upward move as buy orders accumulate.
🎯 TP Targets:
💎 TP 1: $0,2072
💎 TP 2: $0,2100
💎 TP 3: $0,2125
🚀 BYBIT:AI16ZUSDT.P is setting up for a breakout — preparing for an upward move!
