LTCUSD 12-H (UPTREND channel)LTCUSD
Upward Scenario
Entry: above 62
TP1: 83 TP2: 94 TP3: 110
SL.: 40
==============
Downward Scenario
Entry: under 55
TP1: 43 TP2: 32 TP3: 21
SL.: 65
Risk 2.5%
LTC-USD

💡Don't miss the great buy opportunity in LTCUSDTrading suggestion:
". There is a possibility of temporary retracement to the suggested support line (108.8).
. if so, traders can set orders based on Price Action and expect to reach short-term targets."
Technical analysis:
. LTCUSD is in a range bound, and the beginning of an uptrend is expected.
. The price is below the 21-Day WEMA, which acts as a dynamic resistance.
. The RSI is at 60.
Take Profits:
TP1= @ 117.5
TP2= @ 121.9
TP3= @ 127.1
TP4= @ 134.1
TP5= @ 142.9
SL= Break below S2
❤️ If you find this helpful and want more FREE forecasts in TradingView
. . . . . Please show your support back,
. . . . . . . . Hit the 👍 LIKE button,
. . . . . . . . . . Drop some feedback below in the comment!
❤️ Your support is very much 🙏 appreciated!❤️
💎 Want us to help you become a better Forex / Crypto trader?
Now, It's your turn!
Be sure to leave a comment; let us know how you see this opportunity and forecast.
Trade well, ❤️
ForecastCity English Support Team ❤️

💡Don't miss the great buy opportunity in LTCUSDTrading suggestion:
". There is a possibility of temporary retracement to the suggested support line (108.8).
. if so, traders can set orders based on Price Action and expect to reach short-term targets."
Technical analysis:
. LTCUSD is in a range bound, and the beginning of an uptrend is expected.
. The price is below the 21-Day WEMA, which acts as a dynamic resistance.
. The RSI is at 60.
Take Profits:
TP1= @ 117.5
TP2= @ 121.9
TP3= @ 127.1
TP4= @ 134.1
TP5= @ 142.9
SL= Break below S2
❤️ If you find this helpful and want more FREE forecasts in TradingView
. . . . . Please show your support back,
. . . . . . . . Hit the 👍 LIKE button,
. . . . . . . . . . Drop some feedback below in the comment!
❤️ Your support is very much 🙏 appreciated! ❤️
💎 Want us to help you become a better Forex / Crypto trader ?
Now, It's your turn !
Be sure to leave a comment; let us know how you see this opportunity and forecast.
Trade well, ❤️
ForecastCity English Support Team ❤️

LTC possible 60% gain incomingCheck the Chart
Top trend isn't valid, but i'm watching it.
just a thought.
Not financial advice
For my reference and record as a hobbyist trader.
Im a Newb.

LTCUSD H4 Bullish Pressure | 13th April 2022On the H4, we see the price is on bullish pressure. Price can potentially rise from pivot level of 102.31 in line with 78.6% Fibonacci retracement and 61.8% Fibonacci projection towards the 1st resistance level of 114.65 in line with 38.2% Fibonacci retracement , with a graphical pullback resistance. Our bullish bias is supported by the stochastic indicator where price is trading at support level .
Any opinions, news, research, analyses, prices, other information, or links to third-party sites contained on this website are provided on an "as-is" basis, as general market commentary, and do not constitute investment advice. The market commentary has not been prepared in accordance with legal requirements designed to promote the independence of investment research, and it is therefore not subject to any prohibition on dealing ahead of dissemination. Although this commentary is not produced by an independent source, FXCM takes all sufficient steps to eliminate or prevent any conflicts of interest arising out of the production and dissemination of this communication. The employees of FXCM commit to acting in the clients' best interests and represent their views without misleading, deceiving, or otherwise impairing the clients' ability to make informed investment decisions. For more information about the FXCM's internal organizational and administrative arrangements for the prevention of conflicts, please refer to the Firms' Managing Conflicts Policy. Please ensure that you read and understand our Full Disclaimer and Liability provision concerning the foregoing Information, which can be accessed on the website.

LTCUSD H4 Bullish Pressure | 13th April 2022On the H4, we see the price is on bullish pressure. Price can potentially rise from pivot level of 102.31 in line with 78.6% Fibonacci retracement and 61.8% Fibonacci projection towards the 1st resistance level of 114.65 in line with 38.2% Fibonacci retracement, with a graphical pullback resistance. Our bullish bias is supported by the stochastic indicator where price is trading at support level.
Any opinions, news, research, analyses, prices, other information, or links to third-party sites contained on this website are provided on an "as-is" basis, as general market commentary, and do not constitute investment advice. The market commentary has not been prepared in accordance with legal requirements designed to promote the independence of investment research, and it is therefore not subject to any prohibition on dealing ahead of dissemination. Although this commentary is not produced by an independent source, FXCM takes all sufficient steps to eliminate or prevent any conflicts of interest arising out of the production and dissemination of this communication. The employees of FXCM commit to acting in the clients' best interests and represent their views without misleading, deceiving, or otherwise impairing the clients' ability to make informed investment decisions. For more information about the FXCM's internal organizational and administrative arrangements for the prevention of conflicts, please refer to the Firms' Managing Conflicts Policy. Please ensure that you read and understand our Full Disclaimer and Liability provision concerning the foregoing Information, which can be accessed on the website.

LTCUSD 1D (downtrend)LTCUSD now after closing daily candle under 114 i expect now will try to get the downtrend zone, but if break 114.5 and can stable above it will reach 124.
------------
LTCUSD
downward
entry: under 114.30
TP: 106.5 & 101.5 & 94
SL.: 117.6
Risk 2%

LTC - Correction CompletedThis may be a loose ABC correction. However, it appears to be completed and a new up-trend is in.
Rsi and Stoch Rsi suggest and minor pullback before more continuation up.
Im looking for LTC to pullback to around 119, before advancing to 143, the next overhead resistance.
Not financial Advice.
This is for my reference and record as a hobbyist trader.

LTCUSD potential for bounce! 24th feb 2022Prices are consolidating in a parallel channel . We see the potential for a bounce from our buy entry at 94.7 in line with 78.6% Fibonacci extension towards our Take Profit at 104.48in line with 61.8% FIbonacci extension and 23.6% Fibonacci retracement .. RSI are at levels where bounces occurred previously.
Any opinions, news, research, analyses, prices, other information, or links to third-party sites contained on this website are provided on an "as-is" basis, as general market commentary, and do not constitute investment advice. The market commentary has not been prepared in accordance with legal requirements designed to promote the independence of investment research, and it is therefore not subject to any prohibition on dealing ahead of dissemination. Although this commentary is not produced by an independent source, FXCM takes all sufficient steps to eliminate or prevent any conflicts of interest arising out of the production and dissemination of this communication. The employees of FXCM commit to acting in the clients' best interests and represent their views without misleading, deceiving, or otherwise impairing the clients' ability to make informed investment decisions. For more information about the FXCM's internal organizational and administrative arrangements for the prevention of conflicts, please refer to the Firms' Managing Conflicts Policy. Please ensure that you read and understand our Full Disclaimer and Liability provision concerning the foregoing Information, which can be accessed on the website.

LTCUSD potential for bounce! 24th feb 2022Prices are consolidating in a parallel channel . We see the potential for a bounce from our buy entry at 94.7 in line with 78.6% Fibonacci extension towards our Take Profit at 104.48in line with 61.8% FIbonacci extension and 23.6% Fibonacci retracement.. RSI are at levels where bounces occurred previously.
Any opinions, news, research, analyses, prices, other information, or links to third-party sites contained on this website are provided on an "as-is" basis, as general market commentary, and do not constitute investment advice. The market commentary has not been prepared in accordance with legal requirements designed to promote the independence of investment research, and it is therefore not subject to any prohibition on dealing ahead of dissemination. Although this commentary is not produced by an independent source, FXCM takes all sufficient steps to eliminate or prevent any conflicts of interest arising out of the production and dissemination of this communication. The employees of FXCM commit to acting in the clients' best interests and represent their views without misleading, deceiving, or otherwise impairing the clients' ability to make informed investment decisions. For more information about the FXCM's internal organizational and administrative arrangements for the prevention of conflicts, please refer to the Firms' Managing Conflicts Policy. Please ensure that you read and understand our Full Disclaimer and Liability provision concerning the foregoing Information, which can be accessed on the website.

LTC USD Triangle FormationLTC looking to make a move toward the upper bound of this triangle forming. Target is somewhere around 230. Not sure on the timeframe, but likely over the next 4 or so weekly candles.
I am a hobbyist trader. This is not advice in any way.

LTCUSD (Litecoin) Cryptocurrency | Symmetrical TrianglesSee trend line formed at EMA 20 Close Price 156.67. Intersection of levels are good confluence factors.
Watch for bullish price action where levels intersect. See chart below where Trend Line, EMA 10, and EMA 20 intersects. A bullish engulfing candle formed.
Target Price is 162.18.


💡Don't miss the great buy opportunity in LTCUSDTrading suggestion:
". There is a possibility of temporary retracement to the suggested support line (185.9).
. if so, traders can set orders based on Price Action and expect to reach short-term targets."
Technical analysis:
. LTCUSD is in a range bound, and the beginning of an uptrend is expected.
. The price is above the 21-Day WEMA, which acts as a dynamic support.
. The RSI is at 60.
Take Profits:
TP1= @ 195.5
TP2= @ 207.5
TP3= @ 219.7
TP4= @ 232.1
TP5= @ 248.1
SL= Break below S2
❤️ If you find this helpful and want more FREE forecasts in TradingView
. . . . . Please show your support back,
. . . . . . . . Hit the 👍 LIKE button,
. . . . . . . . . . Drop some feedback below in the comment!
❤️ Your support is very much 🙏 appreciated!❤️
💎 Want us to help you become a better Forex / Crypto trader?
Now, It's your turn!
Be sure to leave a comment; let us know how you see this opportunity and forecast.
Trade well, ❤️
ForecastCity English Support Team ❤️

💡Don't miss the great buy opportunity in LTCUSD Trading suggestion:
". There is a possibility of temporary retracement to the suggested support line (185.9).
. if so, traders can set orders based on Price Action and expect to reach short-term targets."
Technical analysis:
. LTCUSD is in a range bound, and the beginning of an uptrend is expected.
. The price is above the 21-Day WEMA, which acts as a dynamic support.
. The RSI is at 60.
Take Profits:
TP1= @ 195.5
TP2= @ 207.5
TP3= @ 219.7
TP4= @ 232.1
TP5= @ 248.1
SL= Break below S2
❤️ If you find this helpful and want more FREE forecasts in TradingView
. . . . . Please show your support back,
. . . . . . . . Hit the 👍 LIKE button,
. . . . . . . . . . Drop some feedback below in the comment!
❤️ Your support is very much 🙏 appreciated! ❤️
💎 Want us to help you become a better Forex / Crypto trader ?
Now, It's your turn !
Be sure to leave a comment; let us know how you see this opportunity and forecast.
Trade well, ❤️
ForecastCity English Support Team ❤️

LTC Long IdeaLooking for a bounce off the .5 fib or the .618 level, which is roughly around the next local support. I will be looking to catch in on the way back up to our resistance area. Should be a pretty easy 30% gain.

Potential LTC Swing Trade OpportunityThe price action has had two rejections at the 165 support area. We are in a third descending channel, headed for this strong support. If it holds and rejects, I will be buying on the way up, with a sell target between 185-190.
But really, this is crypto, so who knows. Waiting on daddy BTC to call the shot.
Trade safely.
This is not financial advice. This is for my reference and record as a hobby trader.

LTC could jump in price soonLTC approaching channel support, possible opportunity for long position.

LTC Breakout of Descending ChannelThis is just a chart idea I made before the fan broke out. I decided to publish after the breakout came. Lite coin had a bearish and bullish case, which is shown with red and green arrows. The Bullish case has played out. Short term target is in the low 170s. This will be my first potential short area depending on the price action.
This is not financial advice. This is for my record and reference as a hobby trader.


LTC/USD 1DLitecoin daily chart we have possible symmetrical triangle. Sym. triangles can be trusted with 5 or less contact points, so we have 3 at the bottom and 2 at resistance. A breakout through resistance confirms sym. triangle and open objective to $240 or daily pivot. PS. First confirmation of breakout can also be the break of descending dashed line. Breakdown of support invalidates this idea.

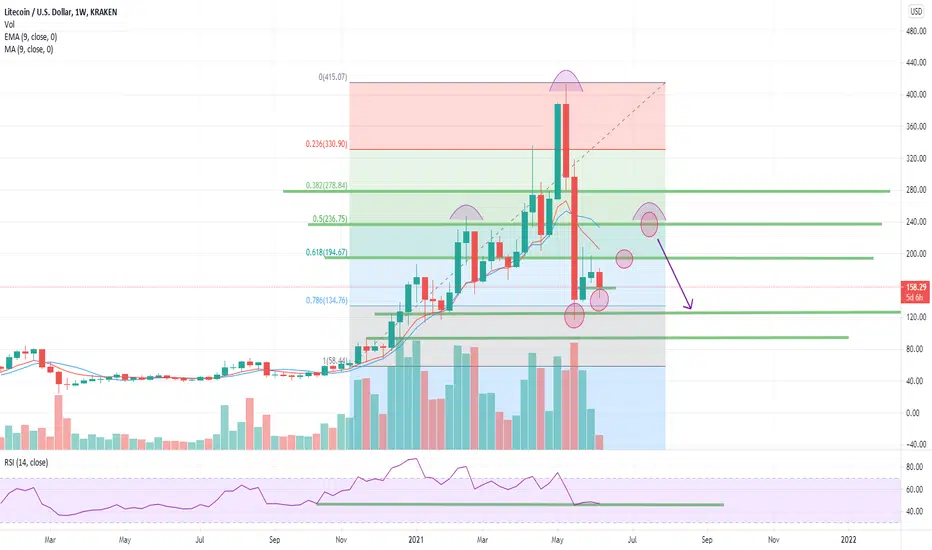
LTC Weekly Chart IdeaWe continued to the downside, contrary to what I was expecting. So now we are looking at the weekly chart.
This is just another iteration of my previous ideas. This time, you can see the levels of resistance and support align with the fib levels. This retracement has gone deep into the gains of the last impulse. The Chart shows a potential for continued higher lows. The rsi is at 47 at time of post. If the shoulder is completed, I see a potential short opportunity coming.
This is not financial advice. This is for my reference and record as a hobby trader.
Related ideas linked.