LTC-USD

ltc ideasharing this cause its interesting that the rsi and price action is holding at the neckline of this larger shape in play.

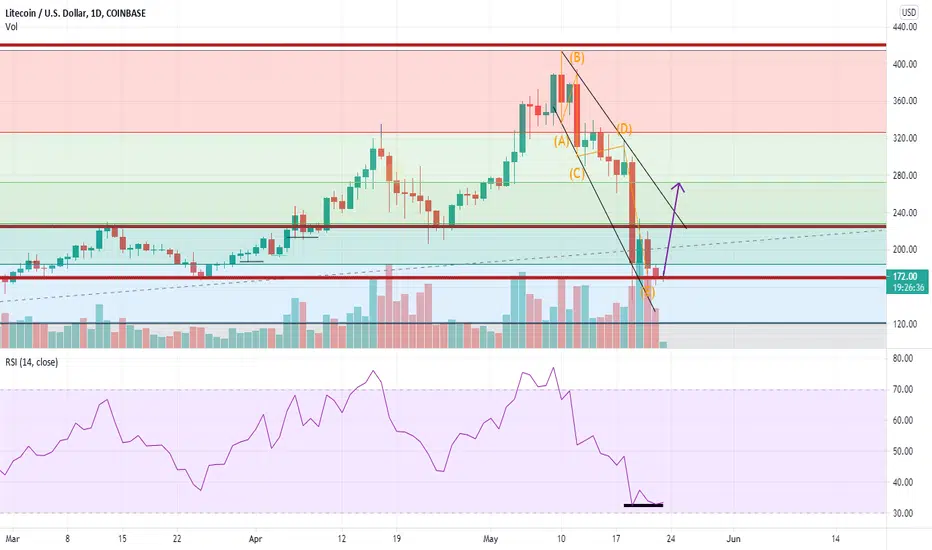
Elliot triangle Correction Idea LTC-USDHere is my first example of this concept put to practice. The final leg of these 5 points coincides with a large area of support. I hate to say bottom is in, but I am optimistic. The rsi is well neutral in all timeframes. Is the correction done, or will there be more blood? only time will tell!
This is not financial advice. This is for my reference and record as a hobby trader. This is for entertainment purposes only.
Dont be shy to comment!
LTC/USD Swing BullishThe Analysis has been done over daily and hourly Chart. Market is respecting Zone-1. Relatively sellers volume and rsi decreasing. Lets watch market towards resistance.
All the best!!

LTCUSD 4H (upward, new target 400$)Litcoin will go up because make it a zone to support for up zone.
above 327$ will get 377$ then 400$
------------
my last idea about LTCUSD:

LTCUSDT - MORE BLOOD 🩸Price is moving within the descending correction leading up to the area of interest we marked out last week! Keep a close eye on this one!

LTCUSD 4H (new target 355$ and 400$)litecoin will get a new price in a few moment because broke 355$ will make a strong stress to buy , so nearly we will see the litecoin usd is 400$ and more than price/
-----------------------
my last idea about LTCUSD :


LTCUSD 4H ( first target 306$ Second 328$ Third 355$ )litecoin will go to the moon
first target 306$ Second 328$ Third 355$

LTC correction fibs and levels to watchIn this chart, im going with the 30 minute time frame to show the breakdown of the market.
The price action went bearish after the 330 peak.
The price started breaking down slowly at first, until a swift fall through the .236 fib.
The price ended up bottoming out right around the .618 fib, just shy of 239 at a key area of support.
Key levels in this breakdown:
271
251
232
This was the buy settup I was waiting for.
New Long Position opened with ATH on the horizon.
LTC is trading strong against BTC in the LTCBTC Pairing.
Man what a night!
This is not advice, this is for my record and reference as a hobby trader.
I have very little experience and knowledge. Know this.
Dont be shy to critique.


LTCUSD 4H (making Upward) target: 278 stabilized above 229.10 will be upward,
targets 246.5 then 278 then 355
———
Direction of Litecoin is upward ,because it is maked a strong upward direction with strong stress to up..


LTC USD (LITECOIN - US DOLLAR)Hi there.
Price is forming a continuation pattern to the upside.
Wait for the price to complete the pattern and watch strong price action for buy.

LTC USD diamond pattern in the make?Possible diamond pattern in the make. Let's see hw this plays out...


LTCTF: 6 Hr
LTC needs to hold above the shown zone. If it can hold i think we will move in the mid $200s. LTC is highly correlated to bTC and honestly has been very weak considering BTC's recent moves. Keep that in mind, if BTC drops hard LTC will drop with it and probably deeper.
See my previous LTC idea here:

LTCUSD - FORECAST 4HR - LITECOINLitecoin looking decent for a short. If green line(148) fails as support, look for a tag of the orange line (129.6). Yellow line (93) is final target. Stop loss is above the white line (166). Red line has a good chance to fail as support, seeing as we've tested it twice now. Hope this sheds some light on your own trades.
This is not investment advice, I am not an investment advisor. Do not blindly follow mine or anyone else's trades.
Be safe out there.

LTC Rising Channel Stopped at Major Supply ZoneThe rejection from the major supply zone just occurred, sending us back to the local support we are sitting on at the publishing of this idea.
This supply zone will likely take multiple attempts to break this area and enter discovery between the two purple lines overhead.
Looking for LTC to trade in this channel to the upside, before retesting this supplied zone.
This will be a large area for people taking profit, so patience is key.
RSI remains neutral on the 4 hour trending upward.
I will be watching the 4 hour chart very cloesly in the next 24 hours.
This is clearly not advice, this is for my record and reference as a hobby trader.
I am a novice with a very limited knowledge. Please be aware of this.
Please dont be shy to critique.
LTC marches on!

LTC Right Triangle Formation on 4 Hour Practice ChartThis has happened before in this run, with very similar structure. That Idea is linked below.
LTC forming a right triangle after a correction off a major impulse.
I think this triangle is ocurring in a reversal setting and will be squeezed down until a breakout to test the next resistance.
RSI is low in the Channel marked and is nuetral.
Higher lows forming in the price action (arrows)
Support found at 207 area currently.
This is clearly not advice. This is for my reference and enjoyment as a hobby trader.
Dont be shy to critique.

LTC/USD: Next Move & TargetsHello every one,
This is my prediction & analyse...
If you agree my idea leave a big like.
Peace ^_^

LTC-USD Trend Analysis Practice ChartLTC is nuetral across most timeframes on the rsi.
LTC appears to be taking a ride on a steep trend line upward.
LTC breaking local resistances and in price discovery.
BTC continues bullish mementum.
I see us tested our recent high around 184ish possible on the daily candle.
This is clearly not trading advice, this is for my reference and enjoyment as a hobby trader.
Dont be shy to critique.
Messy chart...
