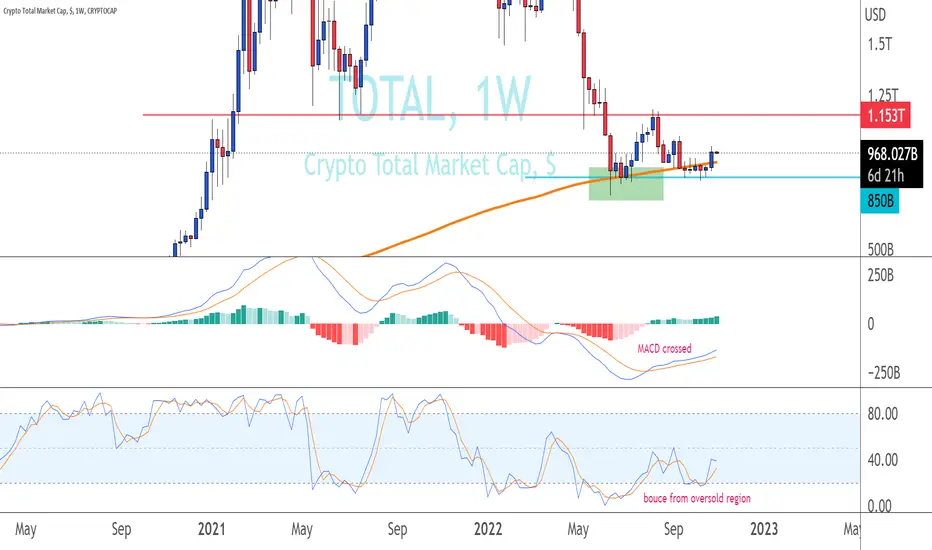
Crypto Total Market Cap - WeeklyCRYPTO total market cap (weekly). $850B seems supported well + above 200 weeks MA + MACD crossed + Stoc bounce from oversold region. seeing potentially bounce up to $1.15T. will see more bulls if able to go ablve $1.15T
Marketcap
Total Crypto Market Cap Bullish? Total Crypto Market Cap is in the process of following BTC at the moment getting ready breakout of a falling wedge and a falling channel. I believe this is additional proof that the bull market is in the process of taking of again. Lets see what happens............................

LITECOIN to Take $19 Billion From The TOTAL2 Altcoin MarketcapWe have a Bullish 3 Line Strike as well as a Tweezer Top Visible on the Monthly Timeframe which would Currently put LTC on a path to take atleast a 3.7% Market Cap Dominance over the Total2 Crypto Market Cap which at TOTAL2's current USD value would put LTC at a Market Cap of atleast $19 Billion which is a little over 11 times more than it's current Market Cap; Assuming that the Circulating Supply of LTC remains near where it is, that would imply that the LTC/USD price will go up to around $584.85 per coin of this TOTAL2/LTC chart were to play out.

USDT Dominance 10.02.2022Dominance Tether is stuck between two levels of 7.2%-7.8% and has hit several times from the upper level and several times from the lower level. If it hits any level this time, the probability of breaking that level is very high.
let's see what happen on Monday.
This Analysis will be updated!!

Expect 12-20% lower from here on TOTAL2 before potential supportUpdated my TOTAL2 macro chart - I called the timing/level of the market rally in my first version based on TA.
Reviving this chart because once again, blood is in the water. I'm not predicting it will catch support and rally again at the exact same level;
I'm merely reminding you that this is the next significant level of POTENTIAL support, and there's still a 12-20% drop before we get there.
Careful out there, and keep stops in place. With FOMC in a few days, clearly this will be a volatile week.
Happy Trades,
CD

CRYPTO TOTAL MARKET CAP MAKING MOVES!Good evening all!
The total market cap is currently ranging even though it has had a large bearish candle on the 4 hourly charts. I cannot predict the market however, I can put a few psychological indicators together and estimate the most likely event to follow.
The most recent move can be seen as a breakout of a bearish flag formation. we are still in a range however, this pattern sets a target that will see the price breakout of this consolidation area if the bears are able to stay in power.
Range explained: The support and resistance levels are placed using the fib retracement on the daily chart, these levels happen to be the strongest levels of support/resistance (50% and 68.2%) thus any move below/above would most likely result in a continuation/reversal. My opinion leans towards the bears as the overall market is bearish and my indicators show strength in the bears.
The 972B price had been tested a couple of times and has been solidified as a strong level of support\resistance to break in the future, as it added confluence in the strength of the bears. This Level is to be carefully watched on the way back up.
If the market had to remain healthy after this dramatic decline in a short period, I would like to see a retracement up to the 944-942B price in order to have more confidence in the flag breakout as well as a prosperous decline to the potential target which lies at 867B
. The 944-942B level acts as a strong middle point in the consolidation range and thus will make a great reflection point before the price continues downwards.
Thank you for your much-valued time! Please feel free to give me your opinion and like the article if you found it interesting.
@TradingView

btc angles and time this is angles and the 180 line its important
also the box chaneel *price*
if its break below the price will dump more faster to the target 360
and if the price more speed from the time then this start will deleted
sory my eng is bad

BTC LONG TIME ? macd
and deepCarb
thats risky please with risk M
see the another chart for angles and time analysis

BTC - long termHere we have the only 2 curvy supports that I take into account - We are now sitting on one of them which suggest we could bounce just to show some resistance - therefore it is wise to DCA here for at least a small bounce. The other support is my all-time curvy support - Respected by the 2012 and 2015 bear market and also by the Covid Crash - going lower will change history as we know it - and potentially the future of Crypto as we know it.
Therefore my plan now is to DCA where we are, next crutial level sits at $13k-$14k.
Sadly I have my expectations of hitting it lower, but I must see the fundamentals leading the price that low to be able to judge them - for now we only focus on those 2 areas.
Cheers!

TOTALThere's no reason to keep being bearish if we dont cross this bottom trendline. Target: 1T$ to 1,1T$ - and will see what happens there.

Total Market Cap Hello guys.
Total market cap is moving in a falling wedge and also back at it's strong horizontal support, from where we've previously seen a decent bullish move after retest.
Here a bullish move is expect after a successful breakout with some bullish candle closes above resistance level of falling wedge.
If Total market cap breakdown the horizontal support, then we can expect a move towards the lower marked demand zone. Total market cap is moving in a falling wedge and also back at it's strong horizontal support, from where we've previously seen a decent bullish move after retest.
Here a bullish move is expect after a successful breakout with some bullish candle closes above resistance level of falling wedge.
If Total market cap breakdown the horizontal support, then we can expect a move towards the lower marked demand zone.

🤖 #SENTIMENT- 30.08 🤖TLDR
In essence everything is pointing towards short term bear movement for the next 2-4 days and then potentially bull rally
USDT DOMINANCE
Hitting key resistance, overbought a bearish divergence and descending trendline. Equally a break out here would be huge but it is looking quite bearish which means money flow into BTC and Alts
ALT CAP EXCL. BTC & ETH
Playing out the last of a Head and shoulders pattern with the possible bottom in the next few days then could result in a big rally from there driving Alts up
BTC
Finishing off the last of a descending wedge over the next few days then possibel breakout on the cards
BTC DOMINANCE
We will likely see a bounce at the bottom of this channel now as a result of BTC pumping - this may leave Alts a little stagnant but they will follow.

Total Crypto MarketCapTotal has bounced off of resistance, but the indicators are pretty low. The value has also reached the extreme bottom now and is very likely to bounce up in a try of reaching the 1,4~1,5 T marketcap. We need to monitor DXY, BTC and SPX to see if that is possible.

TOTAL Crypto MarketCapWhat if the market held the lows from 7/26 and our lows right now is a double bottom?
I have a small long on at the lows in SOLUSD at 31.13 stop out moved to 31.22
If these lows do not hold it's going to be likely we can test the low lows and have a big nasty drop.

TOTAL 2 MarketCapThe main comment about crypto's marketcap is already published under the TOTAL analysis, but here we can see that VolumeTrend is reversing up and Momenter has signaled a reversal in Momentum.
Bullish for now.

Crypto TOTAL MarketCapAs you can see - we reached the triangle's target perfectly and bounced off of it. All indicators are either resetted or in middle ground open for rising - We can witness a push to the descending trendline once again.

3/3 times this was a good time to buy crypto. Is now the 4th...?Playing around with statistics and probabilities... Some people seem to believe in RSI and stoch RSI indicators (overbought / oversold markets). Especially when combined with powerful price action such as resistance and support levels. Such confluences seem popular statistical signals to buy or sell the market or at least start a DCA process.
Let's check what it suggests this time - and remember "past performance does not guarantee future results". ;-)
The total crypro market cap seems to have retested a significant level: 2018 Jan all-time market top. That level was broken through only several months later and the price never came back down to retest this level. Until the recent past few weeks. It is said that new All-TIme-Highs need validation via retesting previous All-Time-High levels before heading even higher. Now this has happened and the price has held above this level - so far. We are also below another important historical support (now turned into potential resistance). So the break of the down-trend has not yet been confirmed by price action.
However, statistics-wise this was a good time in the past to invest in crypto and hold it for new ATHs. 3/3 times such a low RSI and Stochastic RSI level confluence has proven a good time to buy crypto (mainly BTC of course, not the exotic meme coins that are nowhere to be seen today). What do I consider low? Both the weekly RSI and weekly Stoch RSI moving below the lower extreme threshold (their respective colored areas) at the same time. On a closer look, the weekly RSI + Stoch RSI confluence also worked when the RSI value was between 27-37 while the Stoch RSI was at extreme low levels.
So I bought some strong crypto now and will see the results in a few months. I never use up all my free capital, neither should you. Alwayss keep some gunpowder dry just in case history invents new statistics. ;-)

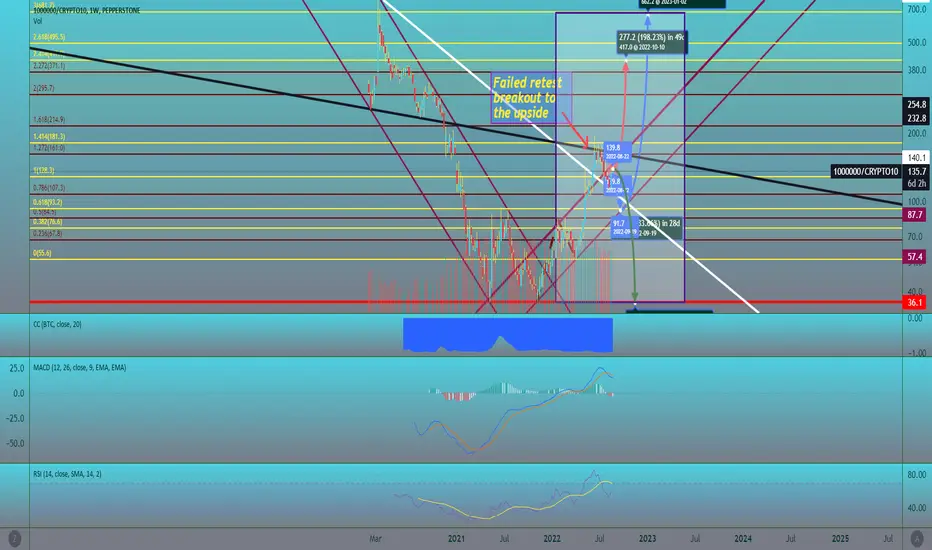
Unique Perspectives on CryptoThis graph represents the inverse chart of the top 10 Cryptocurrencies' market cap. I spotted a few conflicting signals which I described using 3 forecasting lines (Red, Blue, and Green lines). With correct SLs, TPs, and open orders set - great profits can be made.
Furthermore, I will rate the likeliness of each potential outcome
Outcome 1 (red line) (Bullish for this graph/Bearish for BTC)
Reasoning:
-Successful breakout from the closest white line to the current (Aug 22) candlestick. Therefore, the breakout should continue.
-Purely following the trend and candlesticks patterns, a strong move to the upside last week should be followed by a few(range of the red line) bullish candles.
-Last week's bullish close flipped the signal from bearish to bullish in the Trend-Based Fib extension analysis. This is due to last week's candle bullishly absorbing the whole bearish movement from the last 3 weeks, to close above the 1(128.3) fib support.
Although last week's candlestick closed close to the 1(128.3) fib support, the move be seen as a retest(from the fib line).
Likelihood of happening: 5/10
Outcome 2 (blue line) (Bullish for this graph/Bearish for BTC)
Reasoning:
-The closest purple line to the current (Aug 22) candlestick is retested (to the downside) from a failed breakout to the upside.
-After the fall it shall bounce off its next and major diagonal support presented as the lower purple line with the same gradient. It is a strong support line; the high time frame makes it even stronger.
-Afterwhich, the bullish rally should continue, to hit the top Fib lines within the extension.
Likelihood of happening: 6/10
Outcome 3 (green line) (Bearish for this graph/Bullish for BTC)
Reasoning:
-The first anticipated fall follows the same idea as Outcome 2, but follows with stronger bearish action.
-A turning point (to the downside) in the current trend may be spotted by the candlesticks reversing at the black line running through the middle of the chart. It is acting as one of the strongest resistance points on the chart.
Likelihood of happening: 5/10
It is important to know that we are heading into a scary, unique recession. It is critical to account for fundamental factors. Some fundamental analysis can be found on my page.
Plz like and subscribe if you enjoyed my content :)
TSLA versus F - Stock Price and so Market CapThis DAILY chart shows the RATIO between Tesla and Ford stock and so comparisons
between market cap.
A rising ratio indicates that TLSA is gaining market cap compared with F while a decreasing
ratio shows the opposite.
A long-term investor who wants to own either TSLA or F or a blend of the two could use
a chart like this to make trade decisions.
When the ratio is high and approaching the upper BB with high relative strength, such
the hypothetical investor may want to either sell TSLA or buy F.
When the ratio is increasing lower with the value approaching the lower BB and
confirmation with low relative strength he/she might want to buy TSLA or Sell F
or some combination.
This strategy might be back-tested vs an equal proportion of F and TSLA.
without any share swapping.
One caveat moving forward is TSLA has China headwinds, with COVID lockdowns
and the geopolitical uncertainty of the Taiwan situation; F not so much could
easily trump technicals. Additionally, it could help explain why Musk liquidated
$ 6 Billion in shares. NASDAQ:TSLA

Stablecoin DominanceStablecoin Dominance is a measure of crypto market sentiment. It is calculated as the percentage of the total crypto market cap that is comprised of stablecoins. A decreasing value signals a risk-on market while an increasing value is a sign of risk-off conditions. USDT, USDC, BUSD, and DAI are the stablecoins selected for the calculation.

Bitcoin Detailed Top-Down Analysis - Day 39Hello TradingView Family / Fellow Traders. This is Richard, as known as theSignalyst.
39 out of 500 days done.
I truly appreciate your continuous support everyone!
Let me know if you like the series, and if you would like me to change or add anything.
Always follow your trading plan regarding entry, risk management, and trade management.
Good Luck!.
All Strategies Are Good; If Managed Properly!
~Rich

TOTAL CRYPTO MARKET CAP - MEDIUM TERM - 28 JULY 2022CRYPTOCAP:TOTAL in August will enter in strong accumulation phase. Some traders and analyst looking for lower lows over 600-650B total market cap. If this scenario happens BTC will be over 13"000, ETH over $600, but strong price action in this moment is really naive to be ignored. Many institutions are out, many whales are still under the water - some dive even deeper.
In crypto you definitely need a strong conviction and medium term vision. You can check my Related Medium term ideas about ETHBTC and #Bitcoin
If you have any questions related to this trading idea I will be happy to provide you with answers.

👀 That's how I see the market on 26.07👀 That's how I see the market on 26.07
BNB locally fell out of the pattern. We don’t trade TA, because as you can see, before that, he cunningly shaved TA traders in the opposite direction. It's not even surprising anymore 😅
EOS on spot. It fell out of the wedge in a Week, then returned. The potential is huge, see posts above. I buy a little every day ⚡️
BTC also violated TA rules. Previously, it hit the previous support and went down. MM is just collecting liquidity 🤔
Market CAP has previously been directly on support, below is huge liquidity. You should not forget about this, because MM only thinks about it 📮
The global economy is in 💩. From this, the crypto should only grow, but no, something has changed. Nevertheless, buy on spot every day in parts in the coming month - we have a clear understanding of the global.

What is going on? (Macro Scale)We all know that Btc is sucessfully retesting it's downtrend which it has broken through yesterday and this claims that ongoing upward movement will continue..
But what about other data? What does macro scale other than BTC chart telling us?
1.DXY: is on the way back to it's 1w support which is 104.0366 so i expect it will continue to decline at least till that support which is good for crypto market.
2. USDT.D: is on the way back to it's daily support 5.81% which is also good for crypto market till it reaches it's support
3.BTC.D: is on the way back to it's daily support which is 41.42%. If BTC.D is declining when BTC is going up, altcoins will pump up more than BTC.
4. Total Cap: is going up to it's daily resistance 1.16T which is obviously good for crypto market
5. Total 2: is going up to it's daily resistance which is 612.747B which favors the idea that altcoins will pump more than BTC.
6.ETH/BTC: is very near to it's daily resistance which is 0.71526. I think this is the most important thing. I am asking that when the macro economic conditions are all against an increase in crypto market why BTC is increasing? But remember first ETH rose up than BTC and other coins followed this time.. That' s just after the announcement of merge date which is on September. So we can say that ETH is leading the market this time. So if ETH/BTC breaks the resistance of 0.71526 we will see a very good times in short to medium term but if ETH/BTC resistance stops ETH'S leading we will be back to boring sideway movements.
We will see..
