Squidgrow is now heating up for new all time high Soon squidgrow will breakout to all time high be prepared , any good news and we will have a huge breakout
MEME

DOGE - Make Or Break Zone 👀Hello TradingView Family / Fellow Traders. This is Richard, also known as theSignalyst.
After breaking above 0.08 resistance , DOGE traded higher in an aggressive manner to find resistance around 0.1
0.1 is a previous support turned resistance and a strong round number.
🏹 For the bulls to take over from a long-term perspective, we need a daily close above 0.107
In this case, a movement till the next resistance 0.13 would be expected.
Meanwhile, the 0.1 - 0.107 zone is still acting as a resistance and the bears can still kick in (by breaking the last low from H1)
In this case, a movement till the 0.08 support / demand would be expected where we will be looking for new short-term buy setups.
Which scenario do you think is more likely to happen first? and why?
📚 Always follow your trading plan regarding entry, risk management, and trade management.
Good luck!
All Strategies Are Good; If Managed Properly!
~Rich

#DBI to hit 5 cents by the #Bitcoin Miami conference ...Stranger things have happened in #crypto
Yesterday The DEV announced his conference in Florida
That's right a In Real Life conference in Tampa FL with the dev
access is granted by owning one of his #NFT's
Special guests ... I'm not sure who
I expect #BTC to be above $30k by the Miami conference
and Don't Buy Inu cruising on its way to 5c ...
#ThinkBigger

#DBI reload zone After launching DEV #NFT's last night
an expected sell the news dump has occurred in the price of DBI
Under 1 c may not last for long ... or it could take a few weeks to recover... either way
I'm adding to my holdings :)
Priced in #Ethereum the pullback looks especially juicy!

#Poorpleb I believe is winding up for another run. #HVF = 2.6x2.6X on a Logarithmic target.
I like the action the chart is showing
still constrained by the opening daily candle body range
But I believe the opening spike High price will get attacked
By some bullish developments that see to be occurring
in awareness and the potential utility coming very soon.
This obviously will provide the catalyst for price appreciation along with new holders.

Bitcoin Super HalvingIt was just fed up of constantly seeing charts being created based on the halving with such a small sample size, as if this is set in stone.
So I came up with the total reversed super halving.
You are more than welcome to use this chart in your next meme... have fun, stay calm, drink tea
Hugs

DOGE Long-Term View 🔎 Analysis #24/50Hello TradingView Family / Fellow Traders. This is Richard, also known as theSignalyst.
DOGE has been been overall bearish trading inside the red falling channel .
🏹 For the bulls to take over long-term , we need a break above the upper red trendline and 0.09 resistance.
Meanwhile, as we approach the blue support or green demand again, we will be looking for short-term buy setups
📚 Always follow your trading plan regarding entry, risk management, and trade management.
Good luck!
All Strategies Are Good; If Managed Properly!
~Rich

OHMI - One Hundred Million Inu 💯Memecoin Trade $OHMI
🟢 Narrative: One Hundred Million Inu 💯
🟢 Wyckoff Accumulation Schematic
🟢 On Balance Volume above resistance
🚨 Buy at your own risk. Community coin w active members 🚀

floki looking bullish floki is the cryptocurrency that has taken the world by storm.
Unlike most meme coins floki promises great utility within the ecosystem so I am extremally bullish on the meme coin
Easy and straight forward analysis

Floki at Max Momentum Ready For 200% ?Floki crypto is a relatively new meme that has gained popularity in recent months may be ready for another significant price move. Recent price action of Floki has been producing perfect curvature to the upside as it once again tests this curve it appears to be entering into a max bullish phase that may have significant upside.
However, it's important to remember that cryptocurrency markets are highly volatile, especially meme coins and subject to various factors that can impact prices as fast as elon can tweet. Failure to respond in the same momentum curve can just as easily lead to a massive sell off.
Current target is an additional 200%

Wojak buys Tesla, was it FOMOLets meme it up.
Wojak was thinking he could ride Tesla back to all time highs, he saw it was up 100% in just 1 month. Wojak thinks he will double his money easily in the next few months, the bull market is just getting started he says. He thinks to himself, we broke out of the trend line on the SNP500 Covid is Over. The fed is going to pivot. Lets go All-in.
Ring Ring Ring.
Yes?
He Bought?
Begin Operation 50 point rate hike.
Be careful Wojak!

$BBBY Shorts started coveringThese 15 min candles are what show shorts covering. The green disks we can expect a domino effect with the covering here soon. Expect volatility to come and big moves to come.

Twitter headsTry to avoid others opinions.. hard for me to say this when I'm posting my outlook for others to agree/disagree on..
But always do your due dilligence and have appropiate risk otherwise you could get burnt.

Volt INU Quick sharei have added support areas in yellow and target/resistance in blue Volt is less than a year old but will most likely print new ath before the rest due to the fact it doesn't have as far to go this alone could push the price up

Gme looking good
Some people have been worried about NYSE:GME and if the cycles were dead. Good news gme looks to still be on the cycle. Bad news Nov opex was in November. Shocked Pickachu face. After falling from the August run up gme stayed flat (1) while other meme stocks like NYSE:AMC and NASDAQ:TSLA fell (2). Because gme didn't get shorted it had a weak barely noticeable Nov Opex. however, as you can see other meme stocks did have a Nov opex (and you can even see gme did too albeit a small one). No shorting no opex. This may be disappointing for people still waiting for it. Good news however is after Nov opex all the meme stocks got shorted (3) and we seem to in the middle of bouncing from that (4). In short gme was dead sept 7th -dec 7th but now appears to be back on track.
Gamestop correlates strongly with inverse VIX. Correlation broke on Oct 31st 2022 for some reason and restored Jan 6th 2023.I believe we may be playing out the Vix movement from Oct 31st onwards delayed. VIX has gone down since then so we should go up.Vix has kept its trend and should go lower today and Gme should pop today. I believe we may be playing out delayed price action from when correlation broke (labeled with a 4) Would like to see a 10% up day and to break 24 today. Other meme stocks have rebounded to the price level they were at before they got shorted down. I expect gme to eventually get back to $25-$27. Depending on optiion interest that could cause a large run up past that. Also, ftd's have started on gme again stocksera.pythonanywhere.com and are due in febuary further helping gme. all in all, it's been a rough several months, but everything is looking really good for a run on gme soon.

$SHIB outperforming $DOGE again$SHIB leapfrogging $DOGE again
#SHIB looks good & volume coming in
14 area is next
#Shibarium #ShibaArmy

$DOGE weekly bull flag Plan is to piece out $DOGE lil by lil
Keep 1/2-1/4 LONG TERM
If $SHIB is lagging by decent amount roll it into that
#DOGE historically has led #SHIB in price action
BTW look at todays volume, not bad #dogearmy
But still low volume by older standards #crypto

$DOGE leading atm - $SHIB not shabby either - Meme coin turn???Please look at profile for more data on this post
LOOK @ S T R E N G T H
$DOGE looks good
As pointed out some time sold ton of $SHIB & rolled most into #DOGE, price is low - high 7's
Would still buy if didn't have
First time EVER, in my personal, anything is similar in size to #SHIB
Who let the dogs out? #meme
#dogearmy #SHIBARMY #crypto

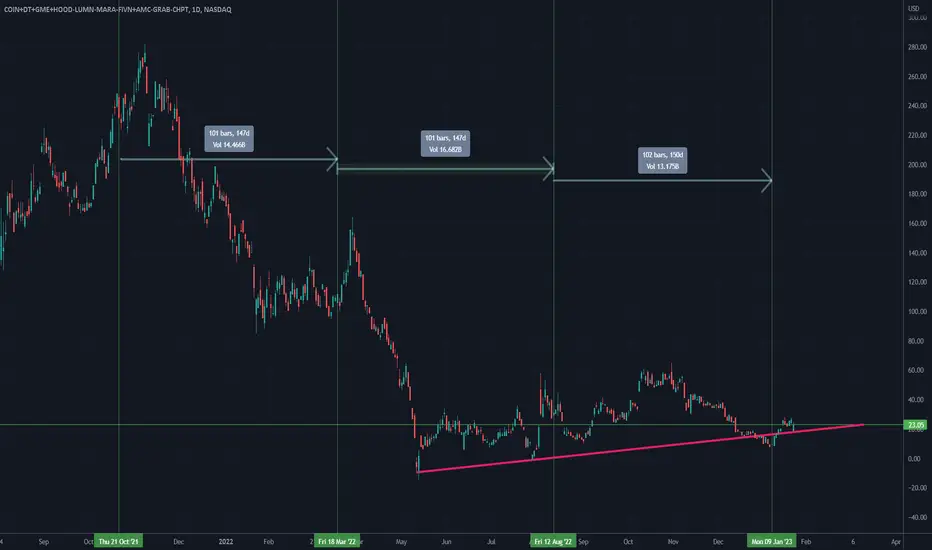
$GME Meme Basket: No ideaEnjoy the new GME basket. One stock was removed and was replaced with MARA a couple of weeks ago. I would've added APE as -APE in the formula that makes this basket, but Tradingview only allows up to 10 symbols to be combined into 1 ticker and APE is the 11'th ticker in this so...
Down to business, i have literally no clue what's going to happen.
imgur.com
Data says big downs, looks legit in my opinion. I have some reservations on what's going to happen so i'm keeping my eyes peeled.
In other news, FINV and GRAB are no longer in the data i'm receiving as of yesterday. No reason at all. I contacted TheOCC to see what's up with that.
Funnily enough, GRAB is IN the GME meme basket whilst another ticker called FIVN (Five9) is also in the basket whereas they removed GRAB and FINV(Finvolution). All timed perfectly with this auction error on open yesterday, all also timed perfectly well with when all of Opex Friday's volume was supposed to hit the tape yesterday but instead we got multiple chained glitches instead.
That being said, i have no idea where the market wants to move. TQQQ and QQQ are making huge moves in one direction whilst SPY is making big moves in the opposite direction. This flip happened before in Oct - December 2022 and now seems to be happenining again. I don't know what it means yet. I have no idea the direction we'll be taking. I need more data and more time. There's too many scenarios that could happen and it's impossible to pick the right one right now. We could start seeing volume on Friday due to yesterday's big OPEX volume having been FTD'd, we could see volume today from Monday's T+2 share settlement from option settlement... We could see T+3 share settlement or T+6 settlement into next week's Tuesday. We could see a move in around 33 days from now... it could be anything... So for now, i have no idea.
Guesstimate: Don't trade based on this. I think we'll have a short period of neutral trading as the flip between going short on one pair of Indices (TQQQ,QQQ) happens and shorts cover on SPY. Then we'll have a decent move up and then another move down. No idea about timeframes yet. This one is difficult to quantify. Obviously sideways for the market means downwards for GME, so... yeah.
GME Potential for Bearish Drop | 27th January 2023Looking at the H4 chart, my overall bias for GME is bearish due to the current price crossing below the Ichimoku cloud, indicating a bearish market.
Looking for a sell entry at 18.85 to form the retail double top pattern. Stop loss will be at 22.47, where the recent high is. Take profit will be at 15.43, where the previous swing low is.
Any opinions, news, research, analyses, prices, other information, or links to third-party sites contained on this website are provided on an "as-is" basis, as general market commentary, and do not constitute investment advice. The market commentary has not been prepared in accordance with legal requirements designed to promote the independence of investment research, and it is therefore not subject to any prohibition on dealing ahead of dissemination. Although this commentary is not produced by an independent source, FXCM takes all sufficient steps to eliminate or prevent any conflicts of interest arising out of the production and dissemination of this communication. The employees of FXCM commit to acting in the clients' best interests and represent their views without misleading, deceiving, or otherwise impairing the clients' ability to make informed investment decisions. For more information about the FXCM's internal organizational and administrative arrangements for the prevention of conflicts, please refer to the Firms' Managing Conflicts Policy. Please ensure that you read and understand our Full Disclaimer and Liability provision concerning the foregoing Information, which can be accessed on the website.

#Poorpleb double top breakoutbeautiful formation
#PP has been on a tear since bottoming and already 3X from its lows in USD
charted vs #HEX we see further room to run

Where is BTC headed following the latest pump?In this post i will be discussing the potential next move for Bitcoin after today's pump.
Using the Fibonacci retracement tool, we can identify key levels where the price could potentially retrace.
By drawing the tool from the bottom of the move to the top, we can see that the price could retrace to the fibonacci gold zone between $21,867 and $21,647.
This area is crucial as it's almost a guarantee that if the price rejects off of this area, it will hit the first price target of $23,512.
The second and third price targets are $23,512 and $23,952 respectively.
Finally, a riskier take profit would be $25,815.
It will be interesting to see if the price will follow this Fibonacci retracement pattern and reach these targets.
What do you think?
Like and comment to let me know what’s your take.
Also, VERY IMPORTANT! s3.tradingview.com Follow the arrows...
Thank y’all
*Note: This post was generated by ChatGPT (Generative Pre-trained Transformer) with my input.

Are rabbits the new dogs ? LTRBT/USDThis has had a good week, and this being the year of the rabbit its got good meme potential right now. i think its possible we get some kind of cup and handle pattern forming at the previous high and then a big move up, its been around a while , i think it started out as spunk bunny or something and pumped on an Elon Musk tweet, since then theres been a migration and this is the first decent move its made since then, worth keeping an eye on and maybe try to snag a small bag if it makes a cup handle . really you'd want to see the handle stay in the top third of the cup
