BTC/USD: From $95K Surge to Critical $89K Support – What’s Next?Bitcoin's 6-hour chart shows that after our last analysis, the price successfully rallied from $95,000, reaching all three targets: $96,200, $97,600, and $101,700, yielding over 8% return.
Today, Bitcoin finally broke the $90,000 support after holding for several days, dropping to $86,000 before recovering to the $89,000 range. If the price stabilizes above $89,000 in the next two days, we could expect an upward move towards the next targets at $90,800, $93,800, and $98,000.
Please support me with your likes and comments to motivate me to share more analysis with you and share your opinion about the possible trend of this chart with me !
Best Regards , Arman Shaban
Metals

$GOLD ANALYSIS (15-Minute Timeframe)! TVC:GOLD is testing the black resistance line ⚫ on the 15-minute chart.
✅ If breakout is successful, the first target is the green line level 🟩.

SILVER Is Going Down! Short!
Please, check our technical outlook for SILVER.
Time Frame: 1D
Current Trend: Bearish
Sentiment: Overbought (based on 7-period RSI)
Forecast: Bearish
The price is testing a key resistance 32.267.
Taking into consideration the current market trend & overbought RSI, chances will be high to see a bearish movement to the downside at least to 30.865 level.
P.S
We determine oversold/overbought condition with RSI indicator.
When it drops below 30 - the market is considered to be oversold.
When it bounces above 70 - the market is considered to be overbought.
Like and subscribe and comment my ideas if you enjoy them!

Gold's Resilience: A Bounce Back from Key Support Demand ZoneGold has rallied off a key demand area of support as the US Dollar peaked and then retraced. This precious metal is currently navigating challenges stemming from forecasts regarding US interest rates and ongoing economic policies tied to the Trump administration.
Fed Chair Jerome Powell has indicated that the US economy is in "remarkably good" shape, which has bolstered the Dollar while putting downward pressure on Gold. However, analysis of the Commitment of Traders (COT) report reveals that smart money remains positioned on the long side, suggesting that there is still potential for upward movement in Gold.
Despite its recent performance, Gold appears to be in a relatively oversold position, supported by favorable seasonal trends that could lead to a bullish outlook. The current demand area presents a crucial opportunity for Gold to retrace and gain momentum once again, making it an interesting point of observation for traders looking to capitalize on potential price recovery.
✅ Please share your thoughts about GC1! in the comments section below and HIT LIKE if you appreciate my analysis. Don't forget to FOLLOW ME; you will help us a lot with this small contribution.

Potential bearish drop?The Gold (XAU/USD) is reacting off the pivot which lines up with the 161.8% Fibonacci extension and could drop to the 1st support which has been identified as an overlap support.
Pivot: 2,953.33
1st Support: 2,882.38
1st Resistance: 2,979.66
Risk Warning:
Trading Forex and CFDs carries a high level of risk to your capital and you should only trade with money you can afford to lose. Trading Forex and CFDs may not be suitable for all investors, so please ensure that you fully understand the risks involved and seek independent advice if necessary.
Disclaimer:
The above opinions given constitute general market commentary, and do not constitute the opinion or advice of IC Markets or any form of personal or investment advice.
Any opinions, news, research, analyses, prices, other information, or links to third-party sites contained on this website are provided on an "as-is" basis, are intended only to be informative, is not an advice nor a recommendation, nor research, or a record of our trading prices, or an offer of, or solicitation for a transaction in any financial instrument and thus should not be treated as such. The information provided does not involve any specific investment objectives, financial situation and needs of any specific person who may receive it. Please be aware, that past performance is not a reliable indicator of future performance and/or results. Past Performance or Forward-looking scenarios based upon the reasonable beliefs of the third-party provider are not a guarantee of future performance. Actual results may differ materially from those anticipated in forward-looking or past performance statements. IC Markets makes no representation or warranty and assumes no liability as to the accuracy or completeness of the information provided, nor any loss arising from any investment based on a recommendation, forecast or any information supplied by any third-party.

+200 pips Best Level to Short EURUSD from Resistance🔸Hello traders, let's review the H4 chart for EURUSD today. Trading
near premium prices of the multiweek range, closing in on heavy S/R
Currently risk/reward is shifting in bears favor, so it's recommended
to look for sell side setups in EURUSD.
🔸Premium prices at 0500/0535, below at 0225/0190. range highs 0470
and range lows set at 0250. trading near premium prices.
🔸Recommended strategy for EURUSD traders: focus on short selling any rips/rallies or short sell at market price EURUSD is currently trading near premium levels and is almost maxed out already, limited upside. TP1 bears +100 TP2 bears +200 pips final exit 0225 keep in mind this is a swing trade setup so naturally will take more time to complete / hit both targets. good luck traders!
🎁Please hit the like button and
🎁Leave a comment to support our team!
RISK DISCLAIMER:
Trading Futures , Forex, CFDs and Stocks involves a risk of loss.
Please consider carefully if such trading is appropriate for you.
Past performance is not indicative of future results.
Always limit your leverage and use tight stop loss.

GOLD SELLERS WILL DOMINATE THE MARKET|SHORT
Hello, Friends!
GOLD pair is in the uptrend because previous week’s candle is green, while the price is clearly rising on the 12H timeframe. And after the retest of the resistance line above I believe we will see a move down towards the target below at 2,849.355 because the pair overbought due to its proximity to the upper BB band and a bearish correction is likely.
✅LIKE AND COMMENT MY IDEAS✅

XAUUSD: 25/2 Today's Market Analysis and StrategyGold technical analysis
Daily chart resistance 3000, support below 2892.
Four-hour chart resistance 3000, support below 2921.
Gold operation suggestions: Gold fell first and then rose yesterday, ushering in a strong bull bottoming out and breaking through the high. The US market accelerated to break through the 2956 mark and was suppressed and fell back. It quickly fell and once broke through the 2940 mark to reach around 2930, stabilized and rebounded, and finally returned to 2950 and closed.
From the current 4-hour analysis, the support below continues to focus on the vicinity of 2921, and the short-term pressure above focuses on the 2950-55 line. Continue to sell high and buy low in this range, and wait patiently for key points to enter the market.
Buy: 2930near. SL: 2925
Buy: 2921near. SL: 2915
Buy: 2892near. SL: 2888
Use small size, control risk

Gold H1 | Falling towards a multi-swing-low supportGold (XAU/USD) is falling towards a multi-swing-low support and could potentially bounce off this level to climb higher.
Buy entry is at 2,923.75 which is a multi-swing-low support that aligns with the 127.2% Fibonacci extension.
Stop loss is at 2,914.00 which is a level that lies underneath a multi-swing-low support and the 161.8% Fibonacci extension.
Take profit is at 2,946.51 which is an overlap resistance.
High Risk Investment Warning
Trading Forex/CFDs on margin carries a high level of risk and may not be suitable for all investors. Leverage can work against you.
Stratos Markets Limited (www.fxcm.com):
CFDs are complex instruments and come with a high risk of losing money rapidly due to leverage. 63% of retail investor accounts lose money when trading CFDs with this provider. You should consider whether you understand how CFDs work and whether you can afford to take the high risk of losing your money.
Stratos Europe Ltd (www.fxcm.com):
CFDs are complex instruments and come with a high risk of losing money rapidly due to leverage. 63% of retail investor accounts lose money when trading CFDs with this provider. You should consider whether you understand how CFDs work and whether you can afford to take the high risk of losing your money.
Stratos Trading Pty. Limited (www.fxcm.com):
Trading FX/CFDs carries significant risks. FXCM AU (AFSL 309763), please read the Financial Services Guide, Product Disclosure Statement, Target Market Determination and Terms of Business at www.fxcm.com
Stratos Global LLC (www.fxcm.com):
Losses can exceed deposits.
Please be advised that the information presented on TradingView is provided to FXCM (‘Company’, ‘we’) by a third-party provider (‘TFA Global Pte Ltd’). Please be reminded that you are solely responsible for the trading decisions on your account. There is a very high degree of risk involved in trading. Any information and/or content is intended entirely for research, educational and informational purposes only and does not constitute investment or consultation advice or investment strategy. The information is not tailored to the investment needs of any specific person and therefore does not involve a consideration of any of the investment objectives, financial situation or needs of any viewer that may receive it. Kindly also note that past performance is not a reliable indicator of future results. Actual results may differ materially from those anticipated in forward-looking or past performance statements. We assume no liability as to the accuracy or completeness of any of the information and/or content provided herein and the Company cannot be held responsible for any omission, mistake nor for any loss or damage including without limitation to any loss of profit which may arise from reliance on any information supplied by TFA Global Pte Ltd.
The speaker(s) is neither an employee, agent nor representative of FXCM and is therefore acting independently. The opinions given are their own, constitute general market commentary, and do not constitute the opinion or advice of FXCM or any form of personal or investment advice. FXCM neither endorses nor guarantees offerings of third-party speakers, nor is FXCM responsible for the content, veracity or opinions of third-party speakers, presenters or participants.

Gold trading zones: 25-Feb-2025Today's Gold trading zones: A starting point for your market analysis.

Gold is due for a fallGold is due to retest 2914 late this week. Macro drivers have subsided. As of yet, there have been no tangible effects of the Trump tariffs or government reductions in the real economy. As for the dollar, while it is still strong, volatility is down. Markets are settling in to wait and see the effects of the Trump presidency. For this week, given the relatively light macro docket this, gold bulls are going to be less aggressive, while bears will see an opportunity to push prices lower. Also gold has been in a range for the last two weeks and sits in the upper part of that range. And the average range of Gold has been falling for the last five sessions. Price will retest the lower part of this range down to 2914.

Gold will touch $3000In a comment to Kitco News, Chris Mancini - Portfolio Manager of Gabelli Gold Fund (GOLDX) - said that Western investors are pouring into gold ETFs to hedge against economic or inflation risks due to the impact of tariffs. He also emphasized that investment demand still has room to continue to increase.
"Gold is acting as a hedge against the devaluation of the USD and other currencies," he said. “Tariff measures could accelerate this process as global commodity prices rise. In addition, if global central banks (including the US Federal Reserve - FED) reduce interest rates or pump money to combat economic weakness, prices will tend to increase, making gold more attractive to investors.
"The buyers still show no signs of slowing down and this week continues to be a strong candle on the weekly chart. I think there is a high possibility that gold will reach the 3,000 USD/ounce mark in the near future, but there can also be big fluctuations around that level."

Gold is rotational for now! So we be PatientWe need a breakout to the upside or a break down to retrace before we get a significant move. For now we will just monitor the price action to see what they want to do. Cause in the area its in right now, it can go either way.

Trade Idea : XAUUSD Long ( BUY LIMIT )Technical Analysis:
• Daily Chart:
• Strong uptrend with price near all-time highs.
• MACD is bullish with strong momentum.
• RSI at 71.76, slightly overbought, but trend continuation is likely.
• 15-Minute Chart:
• Bullish structure, price making higher highs and higher lows.
• MACD is positive, confirming upward momentum.
• RSI at 51.04, showing room for further upside.
• 3-Minute Chart:
• Short-term retracement but price is stabilizing.
• MACD is negative, indicating a possible dip before continuation.
• RSI at 41.60, approaching oversold levels, signaling a possible rebound.
Fundamental Analysis:
• Gold remains bullish due to:
• Market uncertainty (global economic instability).
• Strong demand for safe-haven assets.
• Weakening USD amid potential Fed rate cuts.
Entry: 2946 (Wait for price to stabilize after the short-term pullback on M3)
Stop Loss (SL): 2936 (Below recent support)
Take Profit (TP): 2966 (Near previous resistance)
Risk-Reward Ratio (RRR): 2:1
FUSIONMARKETS:XAUUSD

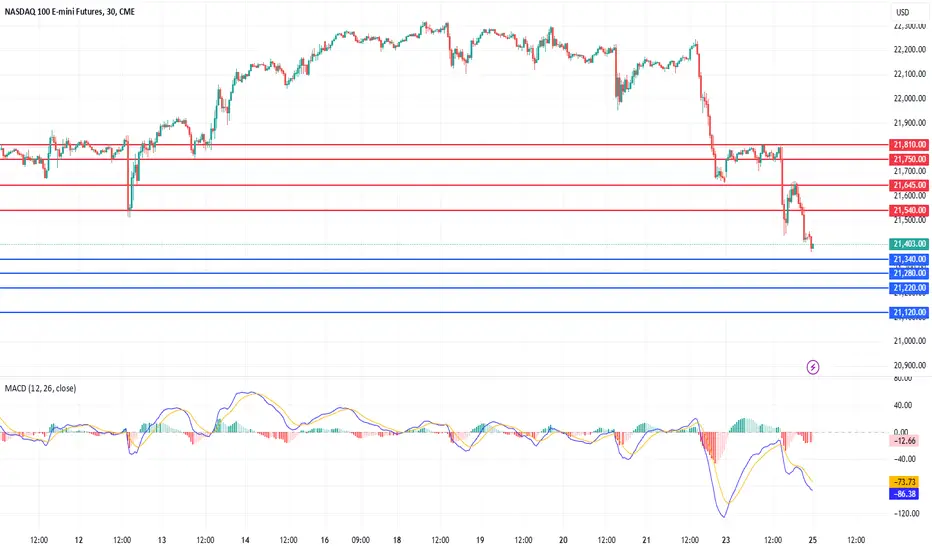
Today analysis for Nasdaq, Oil, and GoldNasdaq
The Nasdaq closed lower following news that Microsoft is reducing its data center leasing. This week, the weekly chart suggests strong selling pressure, meaning long positions should be approached with caution.
On the daily chart, yesterday’s bearish candle confirmed the MACD sell signal, though the signal line remains above the zero line. In a broader context, a potential bounce could occur near key technical levels, including the lower Bollinger Band, 120-day moving average, and previous resistance zones.
Two days ago, a large bearish candle formed, and yesterday’s price action provided an opportunity to sell at the 3-day moving average. However, the market failed to test the 3-day MA during pre-market, leading to a false impression that the daily close was rejected at resistance. This illustrates how a daily close can sometimes be misleading, reinforcing the need to plan for alternative scenarios.
Since selling was executed at the 3-day MA yesterday, today’s key resistance level shifts to the 5-day moving average. Given the wide gap between price and the 5-day MA, a short-term rebound toward this level is possible.
On the 240-minute chart, both the MACD and signal line have moved below the zero line, confirming continued selling pressure. However, since the Nasdaq has now entered a key support zone from a previous range, a short-term bounce toward the 5-day MA is possible. Traders should be cautious with short positions and focus on range-bound strategies rather than chasing downside momentum.
Crude Oil
Crude oil gapped down but managed to close higher. Despite the ongoing MACD sell signal on the daily chart, oil held above the key $70 support level.
This week’s weekly close is critical—if oil can end the week with a bullish candle, it could set the stage for a potential reversal. Holding above $70 remains the key technical factor, as a breakdown below this level would signal further downside.
On the daily chart, if the market fails to extend lower and instead rebounds, a MACD double-bottom pattern could develop, reinforcing potential upside momentum. However, since market flows remain mixed, it is best to treat oil as range-bound until a decisive break occurs.
On the 240-minute chart, both the MACD and signal line are below the zero line, but price action is attempting a temporary rebound. While selling into rallies remains the preferred approach, traders should be cautious of event-driven volatility, as news developments could trigger sudden moves.
The $70 level remains the key downside level to monitor—if it breaks, selling pressure could intensify. Risk management is crucial when taking long positions.
Gold
Gold briefly made new highs before closing flat within its range. On the daily chart, the buy signal remains intact, but today’s session will be crucial in determining whether gold can sustain its momentum or enter a consolidation phase.
The key factor to watch is whether gold finds support at the signal line and continues higher or if a bearish crossover forms, leading to a range-bound correction.
On the 240-minute chart, a bullish MACD crossover has occurred, but for the uptrend to be confirmed, a strong breakout candle is needed. Without a significant bullish move, gold risks forming a bearish divergence, meaning that even if price breaks to new highs, the MACD may fail to confirm the move.
Since market flows remain mixed, a range-trading approach remains most effective, with a focus on buying at strong support levels and avoiding breakout trades. Traders should remain flexible and manage risk carefully, as both upside and downside scenarios remain open.
Looking at VIX futures, a strong buy signal has emerged at the zero level. Historically, VIX buy signals near zero tend to generate large price swings, suggesting that Nasdaq volatility may increase significantly. This increases the likelihood of a sharp correction, making risk management a top priority.
Stay disciplined, manage risk carefully, and wishing you a successful trading day! 🚀
If you like my analysis, please follow me and give it a boost!
For additional strategies for today, check out my profile. Thank you!
GOLD Bullish Bias! Buy!
Hello,Traders!
GOLD is making a bullish
Rebound from the support
Cluster of rising and horizontal
Support levels so as Gold is
Trading in an uptrend we are bullish
Biased and we will be expecting
A further bullish move up
Buy!
Comment and subscribe to help us grow!
Check out other forecasts below too!
