🧅Another good entryAgain with another good entry for NAS100
.
target still at previous equal low
.
.
This is Not Financial Advice
.
🧅JUST AN OPINION OF THE ONION.🧅
Nas100analysis

🧅 1:13 1:13 RR on NAS100
.
open position around previous high OB
.
target at previous equal low
.
.
This is Not Financial Advice
.
🧅JUST AN OPINION OF THE ONION.🧅

NAS100 Daily Outlook | 22 - AprPrice printed huge changes yesterday with up to 300 pips profits. Today, an very keen to see what price has in stock for us.
I will update result later.
Kings.

🧅 waiting for confermation on NAS100 1:6 RR on NAS100
.
with 73 pips SL
.
waiting for third wave
.
pending buy position at previous OB
.
This is Not Financial Advice
.
🧅JUST AN OPINION OF THE ONION.🧅

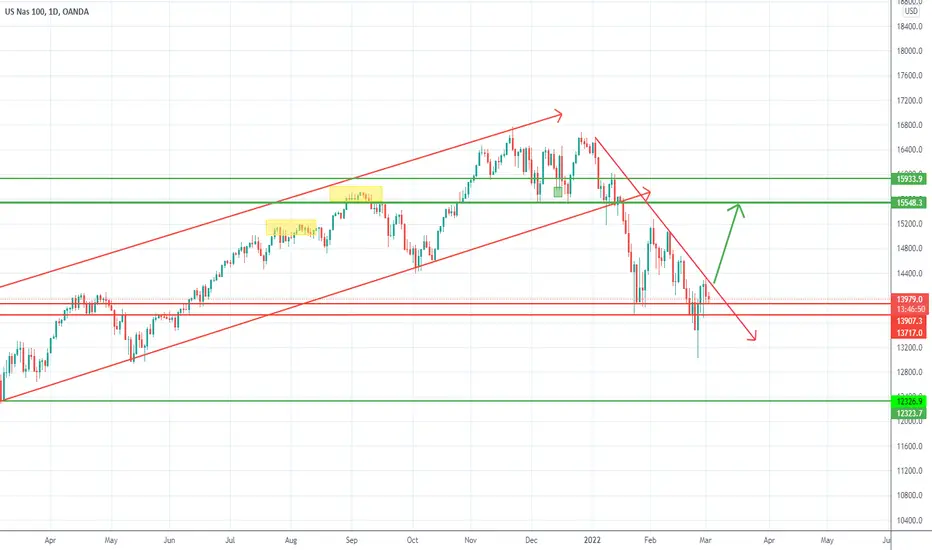
Nasdaq's 14,000 support line holding so far Nasdaq's 14,000 support line holding so far
Despite all talk of aggressive tightening, US stocks including the tech-heavy Nasdaq is holding firmly. For the 4th session, buyers haven't hesitated to jump in to buy the dip every time the Index has dropped below the 14,000 level, representing a 15% drop year-to-date.
Strong earnings are making it difficult for the bears, and technicals are signaling the index is willing to retest the 14,400 resistance before making any leg lower (if any).

NAS100 Hrly long | Algorithm Trade NAS100 hrly long
buystop @ 14830
TP #1 @ 14954 77.78% wr
TP #2 @ 15054 56.67% wr
SL @ swing low 14574 12.22% hr
WR and HR determined from past trades on this pair, on this timeframe.
More trades like this on my profile and on Bifrost Trades.


Nasdaq100- Was 13k the bottom for this correction?War or not war, Nas100 reversed strongly from 13k zone and increased 10% in just 3 days.
At this time the price is in a normal correction and if 13500-13700 holds, we can expect a new leg up to 15500.
That being said, bulls can look for opportunities to buy in that zone with a negation under 13k.
Best of luck!
Mihai Iacob
NASDAQ Holding WeeklyNASDAQ has touched the second support (turning into a bearish market) but quickly returned above the first support.
We're in an uncertain time. However, a strong return above the weekly support usually points towards a bullish movement and candle looking bullish.
I'm keeping my rating neutral for now due to the external events and Bullard repeating he wants to see FED rates 100 BP higher by July 1.

1:16 😂 1:16 RR on NAS100
.
if i lose it's a small lose , i can take that if you can't take that just go.
.
This is Not Financial Advice, JUST AN OPINION OF THE ONION.
.
JUST AN OPINION OF THE ONION.
.
JUST AN OPINION OF THE ONION.
.
JUST AN OPINION OF THE ONION.

1:13 on NAS1001:13 RR on NAS100
.
.
Black lines are where you can Take Profit
.
This is Not Financial Advice, JUST AN OPINION OF THE ONION.

NAS100 Buy AnalysisPrice has broke out of the trendline on 1H timeframe
Currently looking for long potential positions which confluence with the retest of the level the market broke out

Nas100: The light is getting brighter/watch this pattern Nas100 is creating a triangle formation. We only have to wait for this pattern to be completed and violated on either side to be able to predict the direction of the market. As we know, after an impulse follows a correction, that is how the market moves and will always move. What we see right now is just a correction and a strong move is yet to come. Here is what we should keep in mind, if we see a violation of this pattern anytime soon to the bottom of it then we can expect a strong move to the downside, probably a move that will send price at least to 12000.
If bulls succeed to reverse price and if they can be able to violate the pattern to the top then we will see a strong recovery on Nas100.
Additionally, as long as Russia and Ukraine tension continues to escalate, we can expect the worst for the stock markets which will dramatically put downward pressure to the index.
Maybe you have additional thought to add to this. Please make use of the comment section to share your opinion.
If you like this idea, please be kind to hit that like button❤️
I truly appreciate each an everyone of you for your continuous support❤️
Keep on Trading Smart☺️
Forexintelligence

NAS100 hrly short | Algo Trading NAS100 hrly short
shortstop @ 14476
TP #1 @ 14351.20 78.48% wr
TP #2 @ 14236.06 56.96% wr
SL @ swing high 14677 11.39% hr
WR and HR Determined from past trades on this pair.
More trades like this on my profile and on Bifrost Trades.

NAS100: Do not miss this buy opportunity!Traders as I mentioned previously, if bulls break above 14840.00 we can expect more buying pressure. Getting a boost from the giant stocks now turning green, we can only be confident that the Nas100 whales are back and higher price will be driven.
I am very eager to see what will happen at the nearest high at 15250, a break above this level bulls will continue to dominate until 16000. I will probably take partial of my profit at 15250 and lock in some positions.
If you caught this trade from my previous idea then congratulations.
Do not hold back your appreciation by liking this idea.

NAS100NAS100 is getting Ready to go Up for a Big Time Big Move . But it would fill up the down area a bit Build it's Bottom Strong and then will Fly Upwards !

Nas100 keep looking for buy opportunities The market is in a strong bullish momentum. It will keep rising with little or no big retracements. I expect price to reach three of my targets before printing new record highs.
15236.08, 15565.71 and 15908.81
If there will be any big retracement, that might occur at my first target down to 14600.00 for it to mitigate some orders.
Otherwise Nas100 is offering good opportunities for dip buyers.
Please show your appreciation if you find this idea very helpful.
Keep it simple and trade smart.

NAS100If you look closely the reversal candlesticks on the H4 TF is confirmed and the momentum of the bulls are high. Potential bull setup..trade safe and be blessed..

NAS100 Buy OpportunityHere is my analysis for NAS100 for the upcoming week, wait for price to pullback to retest SUPPORT and take a long up to the next resistance area where we can expect a sell.
What are your thoughts? Leave it in the comments below!
Blue Signal FX Rules-Based Trading
1. CHECK THE NEWS!
2. WHAT IS THE OVERALL TREND?
3. IS PRICE AT A LEVEL OF SUPPLY OR DEMAND (SUPPORT OR RESISTANCE)?
4. IS PRICE APPROACHING A LEVEL OF SUPPLY OR DEMAND (SUPPORT OR RESISTANCE)?
5. ARE YOU TRADING WITH THE TREND OR AGAINST THE TREND (MAKE SURE YOU ONLY TRADE AGAINST THE TREND ON THE 4HR TIME-FRAME AND ABOVE.
6. CHECK FOR DIVERGENCE.

NAS100 Buy Opportunity NAS100 broke the resistance level which became the new support level , possible buy opportunity once the market opens.
Targets:
TP1-15125.2
TP2-15525.2
TP3-15194.1
Use proper risk management!

NAS100 BUYNAS100 BUY, Who else agrees with this idea please leave a comment down below. I Think we will enjoy this

Nas100: Buy the dipHey hey friends and family of Tradingview. Here we go again😁
From my previous analysis on Nas100 I said about it finding support around 15600 for the reason that it printed a pin-bar. I also stated that it would be very difficult for bears to run the race to the downside penetrating through and down the pin-bar. I understand that some are anticipating the move to the downside, and I know, I know, maybe they have some sell positions stack somewhere. Maybe not! Hahahaha, but for me I am still holding onto my bullish bias for various reasons. Please note that we cannot pin point every technical detail on the chart less you find my charts looking nasty and dirty. I am trying my best to pin point few technical details why I feel that Nas100 has found bottom and we could expect a bullish run:
To start, Nas100 is moving in a high timeframe ascending channel. The support of this channel was already reached, first it broke out of the support, it rose and again it came back to this support. Towards the market close on Friday we saw a bounce up from this support, yes again, for the second time. What do you think? Could this be a double bottom? If so then my hope of price reaching to 16400 or even 16500 is not something to doubt. But the question is, how are we going to reach 16400 when there is 16000 significant level ahead of us? If bulls successfully violate 16000 then it would be easy for them to take price higher, since 16000 will mark as a neckline of the double bottom. It is very possible that we could see price reaching 16000 very fast this week and for this reason: first take a look at the snapshot below on lower timeframe.
Inverse Head and Shoulders on Lower Timeframe:
What we see is a clear inverse head and shoulders pattern. I expect price to rise, since price closed above the neckline on Friday. If there is any retracement, I believe that is only to mitigate some positions for those still holding their positions below and we could see a strong impulse to the upside.
Pin-Bars around the demand zone (Daily Timeframe):
Have you any different thoughts and opinion? Feel free to share with me and everyone in the comment session below.
And hey, don't forget to be awesome. Please hit that like button so I know you appreciate my contribution to the Tradingview community.
Otherwise, have a great week ahead!

NAS100 SETIPLooking for a fill of the imbalance of atleast 50%.
Trying to target the highs and even further to make new ATHs
