Weekly Market Forecast SP500 NASDAQ DOW: Short Term BUYS!In this video, we will analyze the S&P 500, NASDAQ, AND DOW JONES Futures for the week of March 24 - 28th. We'll determine the bias for the upcoming week, and look for the best potential setups.
The equity markets have been choppy lately, but this week may be different. The economic calendar shows a smooth week ahead, as there are no NFP, FOMC, or similarly volatile news ahead to potentially reverse a market out of the blue. The indices show potential to break consolidation and move upwards. So we wait until there are definitive market structure shifts to occur, acting as confirmations.
Only then do we pounce!
Enjoy!
May profits be upon you.
Leave any questions or comments in the comment section.
I appreciate any feedback from my viewers!
Like and/or subscribe if you want more accurate analysis.
Thank you so much!
Disclaimer:
I do not provide personal investment advice and I am not a qualified licensed investment advisor.
All information found here, including any ideas, opinions, views, predictions, forecasts, commentaries, suggestions, expressed or implied herein, are for informational, entertainment or educational purposes only and should not be construed as personal investment advice. While the information provided is believed to be accurate, it may include errors or inaccuracies.
I will not and cannot be held liable for any actions you take as a result of anything you read here.
Conduct your own due diligence, or consult a licensed financial advisor or broker before making any and all investment decisions. Any investments, trades, speculations, or decisions made on the basis of any information found on this channel, expressed or implied herein, are committed at your own risk, financial or otherwise.
Nasdaq

Combined US Indexes - Time to make a Lower HighFrom the last time, the Combined US equity indexes did keep into the Extension Zone (EZ) as marked out. This Zone is defined from the lowest point of the TD Setup and the range is determined by the range of the candle that has the lowest point, this case being Candle 9 (4 March).
So after the expected two week in the EZ, we see an indication of the week ahead to continue the Sell Setup and break out of the EZ for the week, at least from mid-week where it would be candle 9.
According to TD rules, this Sell setup is NOT bullish, and can be expected to turn further down from resistance (Orange Line). This orange line is determined from the weekly chart where there is an ongoing TD Buy Setup (bearish) that needs to be kept intact for the trend to continue.
So, based on the techincals, the combined US equities may be seeing a last week of bullishness which goes through the yellow ellipse, then face strong resistance and continue the main Bearish trend (as depicted by the prevailing Buy Setup (20Feb to 4Mar). Noted that the main trend changed to Bear once the TDST was broken down on 3Mar.
Here are very good live examples for those keen on (Thomas) Demark indicators; watch and wait for it to develop...

US30 - Catch The Next Wave!US30 is currently in an uptrend, with price action respecting a well-defined ascending channel. We anticipate another bounce from channel support.
In Wave 2, price was rejected at the 38.2% Fibonacci retracement level, and we expect a similar reaction for Wave 4.
Our strategy is to wait for price to enter the buy zone, between the 38.2% and 50% Fibonacci retracement levels, and look for bullish reversal signals before entering a position.
Potential Bullish Reversal Signals:
Trendline break
Break of structure (BOS)
Other confirmation patterns
Trade Plan:
- Monitor price movement into the buy zone, aligning with channel support.
- Enter long positions upon confirmation of bullish price action, placing stop-loss below the established low formed after bullish confirmation.
Target levels: 45,000 and 48,500, with the remainder held for a potential extended swing trade.
Goodluck and as always, trade safe!

$GLD to outperform tech going forward(note for some reason this chart is showing just as GLD, but it's GLD/QQQ)
While I've been waiting for this correction to play out, I've been analyzing stocks and other assets to see what I want to buy for the future.
One thing has caught my attention: As I compare gold to any other chart, gold looks like it's set to outperform pretty much everything (even BTC-- although we're not quite at the point where I'd say fully own gold over BTC as the trend is just starting).
I feel like we're about to get a big monetary reset where our currency is backed by more hard assets. That will lead to commodities outperforming.
For the foreseeable future, gold looks like the better play over tech and the traditional stocks you thought outperformed everything. I could care less about NVIDIA, TSLA and lots of the other names, and while I might have them as a very small portion of my portfolio, I'm really looking at gold and silver miners as the stocks I want to own going into this next part of the cycle.
When you look at the chart, you can see that on the monthly timeframe, we look like we're set to break out of a long term downtrend. Once price can make it over the red cloud, we'll officially be in a new bull trend of gold outperformance. Being it's a monthly trend, I don't see this changing anytime in the near future, so I'll be allocating a large portion of my portfolio to gold/silver and miners.

Bearish Alert: Nasdaq’s Downtrend May Deepen Beyond 5%Hey Realistic Traders, Will CAPITALCOM:US100 Bearish Trend Stop? Let’s Dive In....
On the H4 timeframe, Nasdaq continues to follow the bearish trendline and the EMA-200 . Both trend analysis tools clearly signal a bearish trend. The downtrend may persist as a rising wedge pattern has formed, followed by a breakout and a MACD crossover.
Based on these technical signals, I anticipate a potential downward movement toward the first target at 19,077. After reaching this level, a minor pullback is likely before the decline continues toward a new low at 18,544.
This outlook remains valid as long as the price move below the stop-loss level at 20,080
Besides technical factors, U.S. President Donald Trump still intends to implement new reciprocal tariff rates on April 2, adding further uncertainty to the market. This could limit growth potential and contribute to an inflationary environment by increasing the cost of imported goods. Given this uncertainty, we believe the market will continue to decline.
Support the channel by engaging with the content, using the rocket button, and sharing your opinions in the comments below.
Disclaimer: "Please note that this analysis is solely for educational purposes and should not be considered a recommendation to take a long or short position on Nasdaq.

Nasdaq Intraday TradeWith the overnight GAP, price jumped above the white Centerline, just to come back in the Asia session.
We see that price broke the white CL and halted afterwards. Do yo see where it halted? Yes, at the Centerline of the yellow Momentum Fork!
And currently it's pushing up through the white CL again...hmmm...
So, we have momentum, clear support at the yellow CL, a potential new push through the white CL and a loooooot of Air...and stop/losses above to be sucked in §8-)
I'm long with a stop below the yellow CL low, and with multiple targets to the upside.
Let's have fun!

Nasdaq analysis: 21-MAR-2025Good morning, traders! Today's Nasdaq analysis will help you achieve your trading goals. Let's work together towards success.

2025-03-20 - priceactiontds - daily update - nasdaqGood Evening and I hope you are well.
nasdaq e-mini futures
comment: Market is contracting and I highly doubt tomorrow will bring the breakout. Next week we will either see the beginning of a big second leg down for the bears or a higher pullback to maybe 21k. The past days market has gone nowhere and mean reversion was the money printer 19900 is the fair price for now and anything above 20165 or below 19600 would surprise me. Market is in total balance but since bulls could not get a decent pullback, bears are favored to continue the bear trend.
current market cycle: strong bear trend but currently in W2
key levels: 19600 - 20200
bull case: Bulls have strong legs from higher lows up to print lower highs. They are quick to exit and lock in profits, since bears have demonstrated strength for 5 weeks straight. This week the pullback should have gone much higher and it was a really bad week for bulls. Likely more pain to come. Whats the likelihood of a strong bull trend day tomorrow? Very, very low. We are in a bear flag on the daily chart and bulls have tried for 3 days now to make higher highs. I doubt it will work on Opex. Many times the market will oscillate around the price where market makers want it to close into Opex. This does seem to be such a week.
Invalidation is below 19604.
bear case: Bears are doing what they needed to, in order to make this bear trend really look like one and a strong one at that. They are currently fine with 19900 and going sideways, knowing that the odds of a trend resumption down are greater for them than a surprise bull breakout.
short term: Neutral around 19900. Bearish below 19600 and bullish above 20200 but the signals would have to be insanely strong for me to take them. Mean reversion was key this week and I won’t do dumb things on Opex.
medium-long term - Update from 2024-03-16: My most bearish target for 2025 was 17500ish, given in my year-end special. We don’t know if we have printed the W1 of the new bear trend or repeat the pattern from 2024, where we sold of very strong to reverse even more strongly and make new all time highs. Market needs a bounce and around 20000/20500 we will see the real battle for the next weeks.
trade of the day: Bars 66 to 86 were strong enough and had 3 legs up. Market then was close enough to previous resistance and bears printed stronger bear bars 91, 5+6, 8 and 15 -17. 18 was the absolute latest you had to get short, since market demonstrated more than enough at that point, that it does not want to go up anymore. Short with a stop above y high was banger.
Could you have taken the long from 19765 up to 20100? Certainly not on Bar 24 or 25 but bar 35 was a huge bull surprise on the open and we printed a double bottom at y low. Longs since bar 36 were decent with 200 points upside potential while stop had to be 150 points.

US100/NASDAQ100/QQQ same thing, failed to reclaim the trendlineSame trendline retest failed on the US100/QQQ after 3 attempts. I suspect lower low will be happening before we bounce.

MASSIVE $QQQ BOUNCE INCOMING!MASSIVE NASDAQ:QQQ BOUNCE INCOMING!🚀
I believe we are setting up for a run to the 200DMA around $494ish🎯
- Wr% is uptrending after breaking out of Bearish WCB
- MACD is uptrending with the histogram rising
- RSI uptrending and broke out of bearish box
- Stochastic uptrending into the sweet spot after
breaking out of bearish box
We keep rejecting off the H5_S by wicking off it, which is bearish, but all other indicator show bullishness...
I could be wrong, but it's what the probabilities of everything and my GUT tell me.
Not financial advice

Nasdaq: Wave A Done – Now Lining Up for a Strong BounceThe Nasdaq is starting to look really interesting here. In my view, we've completed Wave ((a)) to the downside—a clean (abc) correction. Why do I think it's done? Because we've just tapped into a Fair Value Gap (FVG) and saw a strong reaction, just above last year’s VWAP, which I always consider a key reference point on the higher time frame.
Ideally, I would have liked to see that 19,090 level get tagged—unfortunately, we didn’t quite reach it. But honestly, this reaction is solid enough to still keep the bullish scenario intact.
Adding to that, the RSI is now in oversold territory, and the last two times we’ve seen that, it was followed by strong upward moves. Based on all of this, I’m expecting a solid bounce over the coming weeks, likely lasting into Q1 or even Q2 2025 .
Where could this move take us? I see two key zones: the first between 22,000 and 22,425 and the second between 23,320 and 23,675. Could it land somewhere in between? Sure. But one of those zones is where I expect this corrective structure to wrap up. That would likely complete the larger ((abc)) correction, after which we’ll finally begin forming the macro Wave A—which will open the next big leg of structure.
So the bigger picture is in play here. In the meantime, I’ll be hunting for entries on the lower time frames, because I do think we’re setting up for a pretty solid push on this index in the coming weeks.

MNQ!/NQ1! Day Trade Plan for 03/20/2025MNQ!/NQ1! Day Trade Plan for 03/20/2025
📈19850 19900
📉19760 19670
Like and share for more daily NQ levels 🤓📈📉🎯💰
*These levels are derived from comprehensive backtesting and research and a quantitative system demonstrating high accuracy. This statistical foundation suggests that price movements are likely to exceed initial estimates.*

Quick Technical Take on Agape ATP Corporation (ATPC)Let’s break down the 1-hour chart for Agape ATP Corporation (ATPC) as of March 20, 2025. The stock’s sitting at $1.02, down about 1%, and it’s been a wild ride lately.
The price spiked to $3.00 in late January before crashing hard. Since then, it’s been hanging around the $1.00 mark, which has been a solid support; buyers keep stepping in here, like clockwork, especially in early March.
The Bollinger Bands show the price dipping below the lower band in mid-February, hinting at an oversold bounce, and now it’s consolidating near that $1.00 level. We’ve got a recent "Sell" signal at $1.06, so there’s some short-term bearish pressure.
The SmartMCDX indicator below the chart is flashing mixed signals: green for bullish, red for bearish. Lately, it’s leaning red, suggesting the bears might have the upper hand for now. Volume’s pretty quiet, which means no big players are jumping in yet, so we might just keep drifting near $1.00.
What to Watch : If the price holds above $1.00, we could see a push toward $1.06 or even $1.20. But if it breaks below $1.00, things could get ugly, maybe dropping to $0.90. For now, I’d sit tight and see which way the wind blows; $1.00 is the key.

This RUT/NDX ratio may convince you to buy NASDAQ aggressively.Nasdaq (NDX) has been under heavy selling pressure in the past 30 days. This short-term pull-back however is nothing but a buy opportunity on the long-term, and this study shows you why.
The answer lies on the RUT/NDX ratio which shows that this may be the time to get heavier on tech. The use of the Russell 2000 index (RUT) is due to the fact it represents a wider array of companies. Naturally over the years (this 1M chart shows data since 2006), the ratio declines within a Channel Down as historically the riskier tech sector attracts more capital and grows more.
However there are instances where Russell gains more against Nasdaq. We are currently though at a time where this isn't the case as the ratio seems to be ready for decline following the completion of a consolidation that on previous fractals (March 2015, September 2008) was bearish, thus positive for Nasdaq.
As you can see, this movements can be grasped by the Sine Waves, though not perfectly, but still good enough to understand the cyclical pattern we're in, also with the help of the 1M RSI Triangles.
Nasdaq (which is represented by the blue trend-line) has started massive expansion Channel Up patterns following this unique signal given by the RUT/NDX ratio. The first was right after the 2009 Housing Crisis bottom and the second during the 2015/ 2016 E.U., VW and Oil crisis.
The key here is on the 1M RSI. The Triangle is about to beak to the upside and every time this happened in the last 20 years, it coincided with a pull-back on Nasdaq (blue circle) similar to the current one. What followed was massive rallies each time.
As a result, this could be an indication that even though the tariffs have rattles investor confidence lately, this is an opportunity for a strong buy position for at least the rest of the year.
-------------------------------------------------------------------------------
** Please LIKE 👍, FOLLOW ✅, SHARE 🙌 and COMMENT ✍ if you enjoy this idea! Also share your ideas and charts in the comments section below! This is best way to keep it relevant, support us, keep the content here free and allow the idea to reach as many people as possible. **
-------------------------------------------------------------------------------
💸💸💸💸💸💸
👇 👇 👇 👇 👇 👇

MNQ!/NQ1! Day Trade Plan for 03/18/2025MNQ!/NQ1! Day Trade Plan for 03/18/2025
📈20040 20085
📉19670 19620
Like and share for more daily NQ levels 🤓📈📉🎯💰
*These levels are derived from comprehensive backtesting and research and a quantitative system demonstrating high accuracy. This statistical foundation suggests that price movements are likely to exceed initial estimates.*

MNQ!/NQ1! Day Trade Plan for 03/19/2025MNQ!/NQ1! Day Trade Plan for 03/19/2025
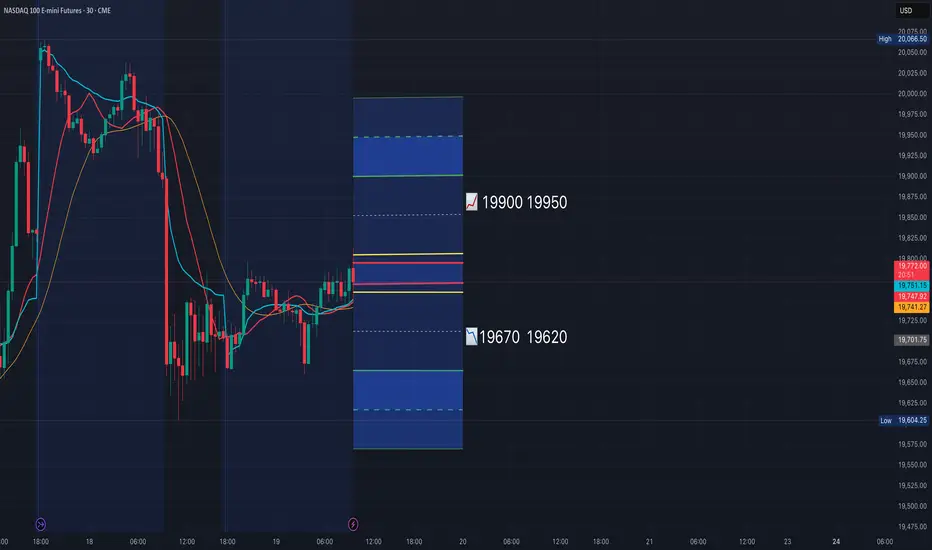
📈19900 19950
📉19670 19620
Like and share for more daily NQ levels 🤓📈📉🎯💰
*These levels are derived from comprehensive backtesting and research and a quantitative system demonstrating high accuracy. This statistical foundation suggests that price movements are likely to exceed initial estimates.*
NAS100 Bullish Trend H4 confirms the change of character to bullish. Long here. Turn to bearish if the price is below 19.100.
The next target is 20.400–20.600.
Good luck!


NASDAQ: 4H MA50 broke. Time for a full recovery.Nasdaq is still bearish on its 1D technical outlook (RSI = 39.669, MACD = -426.120, ADX = 56.837) but crossed above its 4H MA50. The last time a bearish wave of this Channel Down crossed above the 4H MA50 was on August 9th 2024. It was achieved again after an oversold 1D RSI bounce and initially hit the 0.786 Fibonacci level and then peaked on the 1.382 Fib extension. The trade is long, TP1 = 21,500 and TP2 = 23,400.
## If you like our free content follow our profile to get more daily ideas. ##
## Comments and likes are greatly appreciated. ##

Microsoft (MSFT): The "Can’t Go Wrong" Stock... Until It DoesAh, Microsoft—the tech titan that could probably survive a meteor impact. 🌍☄️ With a market cap so large it could buy entire countries and still have spare change for a few yachts, MSFT is the stock that everyone loves... even when it’s overvalued. But hey, let’s take a look at the "genius" behind the current price action. 🔍💰
📊 The Almighty Stock Performance (Because Fundamentals Don’t Matter Anymore?)
📉 Price: $385.76 (up a whole 0.00584%! Call the champagne guy! 🍾)
📊 Intraday High: $387.88
📉 Intraday Low: $383.27 (because even Microsoft has bad days, right? 😅)
🔮 200-day moving average: $423.98 (oh look, it's trading below that... bearish much? 🐻)
So, let me get this straight. MSFT is 7.80% down year-to-date, but analysts are still screaming “BUY! 🚀.” Sure, because blindly trusting price targets has always worked out well for retail investors. 🤑
💰 Valuation: Overpriced? Who Cares, It’s Microsoft!
📢 Intrinsic Value Estimate: $316.34
😬 Current Price: $385.76
💰 Overvaluation? About 18%
But let’s be honest—does valuation even matter anymore? If people are throwing money at meme coins, why not pay a premium for MSFT? 🤷♂️ It’s basically a subscription service at this point—you pay every month, and the stock just keeps draining your wallet. 💸
🤖 AI Goldmine or Just Another Buzzword?
Microsoft has been riding the AI hype train harder than a teenager with ChatGPT. 🚂💨 Their enterprise AI growth is over 100%, and they’re pulling in a $13 billion annual run rate from AI services. But sure, let’s pretend that no one remembers the last time “the next big thing” crashed and burned. (cough dot-com bubble cough). 💀💾
Evercore analysts claim MSFT will dominate AI for enterprises. Well, duh. If you’re an enterprise and don’t buy Microsoft AI services, Satya Nadella himself might show up at your office and force you to install Windows 11. 🏢💻
📉 Risk Factors? No Way! MSFT is Invincible... Right?
🦅 Hawkish Fed = Potential Market Sell-Off (But don’t worry, just HODL, right? 🤡)
🚀 Tech Bubble Concerns (Microsoft will totally be the exception… like every overhyped stock before it. 😬)
🧐 Overvaluation? Pfft, who cares? (People said the same about Tesla at $400. Look how that turned out. 🪦)
📢 Analyst Hot Takes (Because They’re Always Right 😂)
📊 D.A. Davidson: Upgraded to Buy with a price target of $450. (Ah yes, let’s just throw numbers out there. Why not $500? $600? 🚀)
🔮 UBS: Predicts $3,200 for gold, but Microsoft will somehow go even higher. (Probably. Because… reasons. 🤷♂️)
🎭 Final Thoughts: Buy? Sell? Just Panic?
Microsoft is basically the “safe” tech stock everyone clings to while pretending that the market isn’t built on dreams and overleveraged hedge funds. 🏦💰 If you believe in the power of monopolies, overpriced AI services, and analysts pulling price targets out of thin air, then MSFT is your golden ticket. 🎟️💎
Otherwise, maybe—just maybe—waiting for a dip below fair value isn’t the worst idea in the world. But what do I know? I’m just some guy on the internet. 🤷♂️
🚀💸 Good luck, traders. You’ll need it. 😈📉
💬 What do you think? Drop your thoughts below! 👇🔥

NASDAQ 100: Moon Mission or Reality Check? Ah, the NASDAQ 100—our favorite rollercoaster 🎢 where tech dreams are either made ✨ or brutally crushed 😵💫. Right now, it’s hovering around 19,500, and traders are debating: "Is this the launchpad to new highs or just a dead-cat bounce in disguise?" 🐱💀
Let’s break it down 👇
🚀 The Bullish Hopefuls: "We're Going to Valhalla, Boys!"
✅ Rebound Mode ON 🎯: After a nasty selloff, the market has found some footing and is showing signs of recovery 📈. Maybe the worst is over? (Yeah, sure, we've heard that before... 🙃)
✅ Fed to the Rescue? 🏦: With the FOMC meeting on deck, traders are hoping for some dovish magic dust ✨ to send tech stocks flying again. Because why rely on solid fundamentals when you have the Fed, right? 🤡
😨 The Bearish Doom-Sayers: "Brace for Impact!"
❌ Big Tech = Too Crowded 🚶♂️🚶♂️🚶♂️🚶♂️: Asset managers are side-eyeing Big Tech, calling it "overcrowded" 🙄. Translation? Expect a nasty rug pull soon.
❌ Healthy Correction... or the Start of Something Worse? 🚑: The S&P 500 dropped 10%, the NASDAQ fell 11%, and Treasury Secretary Scott Bessent is calling it a "healthy correction" 🤡. Yeah, just like how falling down the stairs is a “healthy adjustment” for your spine.
🤔 The Fence-Sitters: "We're Just Watching the Chaos 🍿"
🔮 Multiple Futures Await 🔮: Analysts are juggling four possible scenarios for the NASDAQ—ranging from "moon mission" 🚀 to "welcome to the abyss" 🕳️. Basically, flip a coin.
So... Where Are We Headed? 🤷♂️
Are we strapping in for another ride to the stratosphere 🚀, or is this just a perfectly orchestrated bull trap 🐂🔫? Either way, buckle up, folks—volatility is the only guarantee 🎢😵💫.
💬 What do you think? Drop your thoughts below! 👇🔥
(Disclaimer: This isn't financial advice. Do your own research before yeeting into the market. 🚀📉)

GOOGL, Short, 1D✅ GOOGL broke the key support at 166.25, confirming bearish momentum. The price is expected to decline further toward the next key support at 149.50.
SHORT 📉
✅ Like and subscribe to never miss a new analysis! ✅

Nasdaq insights: 19-MAR-2025Good morning, traders! As a seasoned price action trader, I'll share my Nasdaq insights to help you improve your trading skills.

Emergence of Bear Flag in Nasdaq The price action seems to be suggesting the formation of Bear Flag Pattern.
The price fell steeply and then gave a pullback, which is getting sold into.
As the channel of flag breaks downwards, the fall may gain momentum.
Further price action will confirm or negate the pattern, it may move cleanly or will have whipsaws.
If the price starts consolidating for long here, rather than breaking downwards, the pattern may fail.
Trade Safe
