natural gas - short - Head and ShoulderThe price action is very bullish but is arrived on biggest resistence area and in 15minute time frame is creating a potential H&S patter. If confirmed the break of neck line we can have a short impulse to near support area.
Natural-gas

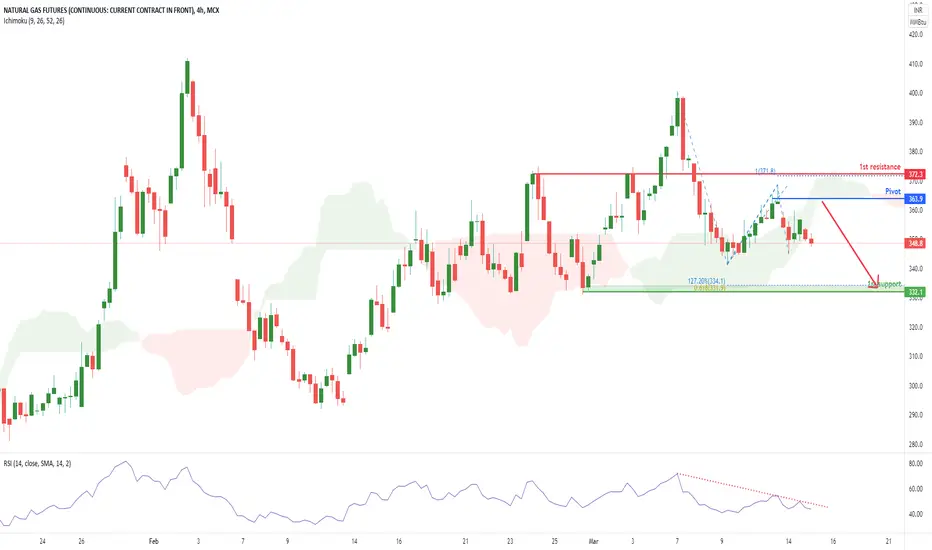
Natural Gases Futures (NG!), H4 Potential for dip!Type: Bearish drop
Resistance : 372
Pivot: 363.9
Support : 332
Preferred case: We see the potential for a further bearish drop from our Pivot at 363.9 in line swing high resistance towards our 1st support at 332 in line with 127.2% Fibonacci projection and 61.8% Fibonacci retracement. Our bearish bias is further supported prices trading below our ichimoku clouds.
Alternative scenario: If prices were to reverse, they can potentially climb towards our 1st resistance at 372 which is in line with 100% Fibonacci projection
Fundamentals: Warmer weather conditions and renewable energy sources might mean temporary setback on the commodities
Natural Gas - updateNatural Gas - idea update
Flat situation... but is it possibile a new short action in the next week

Long NATGAS short term optionNatural has been on a decline ever since their recent high of 5.3.
Price is heavily oversold here.
We can see that the trend has recently left the falling flag and most recently breaking out of the descending triangle, recording a positive RSI divergence there too.
Currently on a important resistance level and my first target is the resistance up in a area around 4.5.

Natural Gas - Potential Path for next week? As we know, NATGAS is a beast with it's own mind and often technicals fail to support it's move, but here's one anyway!
As you can see there's a descending flag that has been accumulating and I've used a fib extension to determine it's next target.
It's severely oversold on the hourly and the 4hr charts, due to I'm sure the profit ejections from the previous run.
The most recent reports aren't that bearish IMO and I can see this easily taking flight again soon.

Natural Gas SHORTNatural Gas SHORT
Analysis based on pure technical - trend line analysis - Fib retracement (power of Fibonacci Retracement , so we can use as like our advantage in the future), I think now patience is the essential key as always. It is about understanding FLOW (flow of markets)

Natural Gas on the Up? Natural gas has made a lovely set up here, with a breakout from the ascending triangle and is resting on the support level within a descending flag.
The weather in the US isn't getting any milder and inflation worries can really set this one up for a huge run.
Great R/R Ratio here.
Breaking out from the top support is vital here, and if it does, prices might go to the moon.

Natural Gaslooks like prices have stabilized, at current prices we see allot of fear based trading, but i think it's best not to give into these short term trends and look at the bugger picture, natural gas has been in a uptrend for a while now and i see no reason for the uptrend to come to an end.

Natural Gas LONG News:
The US benchmark for the price of natural gas was in recovery mode on December 3 after falling significantly over the last four trading sessions.
The January gas delivery contract at the US Henry Hub was up 3.6% as of 12:25 GMT to trade at $4.20/mn Btu. The benchmark, however, lost 25.5% over the previous four trading sessions.
The latest natural gas weekly report from the US Energy Information Administration shows working natural gas stocks are 10% lower then year-ago levels and 2% lower than the five-year average through 2020 for this week.
Moderate weather for the continental United States, however, has kept Henry Hub below recent highs of around $6/mn Btu. The National Oceanic and Atmospheric Administration in its latest monthly forecast calls for above-normal temperatures across most of the Lower 48 states.
In the more immediate forecast, the National Weather Service said to expect record-breaking high temperatures for this time of year for parts of the country, though the Northern Plains and Upper Midwest could see heavy snow during the weekend.

NATURAL GAS - NatGas - LongPotential pull back until POC price
The price are working on support area and up 200 average medium price so there is posibility for an pull back

NATURAL GAS GOING FOR FINAL RALLY OF 5th WaveNatural gas is going to make a new high for the 5th wave. We can buy it when it will come down for the correction.
#ElliottWave #NaturalGas

Complex analysis of "Natural Gas", the strongest analysis Complex analysis of "natural gas", the strongest analysis - know the upcoming price movement
Analyze natural gas prices in the short or medium term
The target is shown in the drawing. If Target 2 is breached upwards and stability, we will take off to the top
The analysis fails if it falls below $4.75
Several schools of technical analysis were used in this drawing. I hope you like it
Like - follow me

NATGAS Bullish Setup! Buy!
Hello,Traders!
NATGAS has retested a support cluster
Formed by the rising support and a horizontal key level
I am bullish on Gas overeall, and my bias is supported
By the recent bullish breakout from the local falling channel
Taking everything into consideration
My verdict is that Gas will most likley go up mid-term
The target you see on the chart is a good TP level
But I also belvie that Gas might go even higher
To retest the recent all-time-high
Buy!
Like, comment and subscribe to boost your trading!
See other ideas below too!

$ERII: Midstream Dream$ERII setting up with a really nice base in the energy space, I'm being very selctive about $XLE and energy names due to political risk and potential commodity gluts.

Natural Gas shortKing Warns Natural Gas Exports Harming Americans, Strengthening Competitors
A proposal to expand natural gas capacity on the Kern River Gas Transmission Co. pipeline system to serve a Utah power plant has received a favorable.

NATURAL GAS The top is in. But how low can it go?Exactly two months ago by making use of Natural Gas' clear long-term cycles, I called for a potential Top of the current Cycle after the formation of a Golden Cross on the 1W time-frame:
Even though the price rose a bit more, the peak was made shortly after. This time I am narrowing the horizon to 5-6 years and as you see the Cycle's peak was made exactly on the Higher Highs trend-line that started after the December 2016 High. An important technical development is that the 1W MACD made a Bearish Cross, which when formed on that Higher Highs trend-line, is a Top. Even though on a multi-year basis, the technical outlook has Natural Gas going as low as the Support Zone, on the less long-term, it may follow a consolidation phase as in 2017.
A long-term startegy for a cyclical investor would be to sell every rebound as the current one and gain from such swings on a 1-2 year horizon. In 2017/2018 it was only when the 0.618 Fibonacci retracement level broke, that NG broke down towards the Support Zone. So in such strategy long-term traders may resume selling once the current 0.618 Fib breaks (3.374) towards the Support Zone.
--------------------------------------------------------------------------------------------------------
** Please support this idea with your likes and comments, it is the best way to keep it relevant and support me. **
--------------------------------------------------------------------------------------------------------

Natural gasBuy only if candlestick cross up yellow line and stay above yellow line.
TP Goals 5815 and 5900

✅NATURAL GAS LOCAL SHORT🔥
✅NATGAS broke the local horizontal key level
And is now retesting it form below
I think that a local bearish reaction is possible
Because gas is relatively overbought
So a correction is viewed as healthy
SHORT🔥
✅Like and subscribe to never miss a new idea!✅


Natural Gas Big Inverse Head and Shoulders Pattern playing outI have spotted this pattern a bit too late, but now we are few weeks after its activation and target is only half way through. I am expecting this to hit the target before we start thinking about possible top.
What do you think? It looks like a textbook execution, I would be surprised if we fail. Now we also have broken the trendline of the previous two highs and we have printed 2 very bullish looking candles on the weekly to support this going further up, maybe even without many corrections.
On the shorter timeframe I see a cup and handle to support the move higher as well. I am very bullish on this based on these factors. Please share your view.

$NRG: Rapid Growth in this Customer Focused Utility CompanyGuidance & Growth
NRG is reaffirming its guidance range for 2021 with respect to Adjusted EBITDA, Adjusted Cash from Operations and Free Cash Flow before Growth Investments (FCFbG) which excludes the full year impact of Winter Storm Uri. NRG's FCFbG for the six months ended June 30, 2021 was $768 million.
NRG has a very compelling value proposition, a unique consumer business that can deliver 15% to 20% annual growth in free cash flow per share over the next five years.
Dividend
A strong dividend growing at 7% to 9% per year. A best-in-class sustainability framework embedded in everything we do and a commitment to maintain a strong balance sheet and continue to be excellent stewards of your capital.
Technicals
You can see we've built up a strong long term base with a recent burst higher. High natural gas prices could be here to stay and NRG could benefit.

✅NATURAL GAS BULLISH BIAS|LONG🚀
✅NATGAS is retesting the horizontal support
Which is a daily support level
And I think that we will see a rebound
Because the support is strong enough
LONG🚀
✅Like and subscribe to never miss a new idea!✅

The Next Meme Stock? -Natural gas is seeing alot of news recently.
-Currently in a massive rising wedge pattern on the daily
-A breakout of the pattern could send it into a new bull run up to its ATH again
