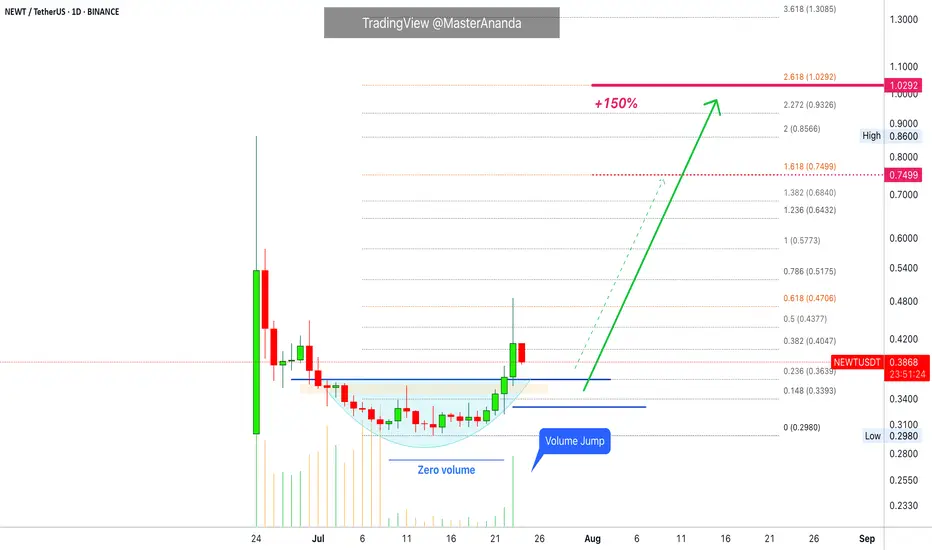
Newton Protocol · Volume Signal · 150% PP Short-TermI will show you now a successful choice on a volume signal as we look at Newton Protocol (NEWTUSDT) on the daily timeframe.
Notice how trading volume is flat while NEWTUSDT is producing a rounded bottom with the daily candles. It reads "zero volume" on the chart.
Now notice the strong "volume jump" today, 23-July, as soon as the action moves outside the rounded bottom, also a Fib. extension resistance. The strong jump confirms the start of a bullish advance. Our short-term target gives us 150% profits potential.
I will end this series soon and go back to our usual schedule.
These charts show the altcoins market being full of opportunities at this point in time. There is something for all types of market participants, active or passive traders. Risk lovers or risk averse. We are only getting started.
Your support is appreciated and all feedback is welcome.
Do you enjoy short-term trades?
Did you know, you can hold these pairs long-term once the bullish trend develops. Selling for profits is only optional, the market is set to grow until late 2025 or maybe into Q1 2026 or beyond.
The things that are happening worldwide in relation to Crypto are a first in the history of humanity. It is the first time that money is free from a tiny controlling monopoly. It is the first time in our history that you can create your own money. Decentralized finance. No middle men. The greatest financial and technological development in our history.
Namaste.
Newton
Roger Babson and the 1929 Crash: Action Reaction Ien.wikipedia.org
The Late Roger Babson allegedly predicted the 1929 crash and hence made what was probably the trade of last century. It would be the equivalent of a billion dollar trade in today's market.
Dr Alan Andrews later took his mentor's concepts, which related to Newtonian physics and devised the Action-Reaction method of technical analysis; modelled on Newton's Third Law.
Babson was an interesting character- who merged business, science and esoterics. Like most visionaries he was treated sceptically in his own lifetime. Certainly his adventures in antigravity helped disguise his genius.
Other than the famous 'Babson Chart' there is little to go on as to how he did what he did in 1929.
But an acquaintance and I believe we have deduced the method.
Tradingview makes easier for contemporary traders to mechanise what was a laborious task in the 20th century.
I present to you: the action-reaction chart
NOT TRADING ADVICE


VIS Re-entry BUY Target 16%Knowing the market and use suitable tools.
Follow Re-entry Trading Plan.
1. Price reject EMA6,EMA12 and above SMA50
2. Ultra Low Volume
3. Target profit are coincidence with Fibo extension 100% and Newtinion Law's.
4. Exit when price breach previous Low.

Action & Reaction At WorkThis is how Action/Reaction roughly works:
1) take the center of a major swing
2) mesure back and
3) project it forward.
Observe how price is acting/reaction at the R-Lines.
This is the same principle like: "If you push to a wall, the wall is pushing back."
On my new Blog-Post for registered FreeFTG members, I'm going into details about this technique that stem from Newtons 3rd law of motion, and adapted to the charts by Dr. W. Babson, who made a fortune and started the Babson Collage.
It pays out to know more then just common trading knowledge...
P!

TLT - This should open your eyes a litte moreJust look, study and begin to see.
If you know the rules about Action/Reaction, about the Forks, you have a better sense what potentially could happen when price reaches the centerline, or breaks out of the U-MLH and comes back ("overshoot" - "back to centerline" in pink).
Follow each bar, from left to right...slowly...think about what's going on bevor going to the next bar.
Feel how markets swing, up and down and up and down...breathe in, breath out...contraction, release.
As above so below
Drop me a message if you like it, have comments or want to learn more about the Forks.
P!

AUDUSD - At Upper Extreme And TBNot ripe yet, but observing this short down to the centerline (CL.).
P!
mytradingcoach.teachable.com

IUX Russel - Rejection from the TrendBarrierWhat is important on this chart is not the trade!
It is how you can see support and resistance at the lines.
If you know how to use these tools your chance of profit increase dramatically, because all these lines do is follow the law of Action/Reaction - Newtons law.
It's not a holy grale or such. But when something is happening over 80% of time, then we should pay attention to it and think about how we can use this for our trading. And yes, price is going to the centerline (CL.) over 80% of time.
This is only one rule of many, of the A/R freamweork.
I like to trade small, very small, but trade many occurences to increase my chance of making a profit at the end.
That is why i like to sell options very much! Selling options have a built in success of expiring out of the money over 70%!
Now combine this with this fantastic Action/Reaction framework and you have a hell of a great system to make money from the markets.
I have put togheter a very basic Action/Reaction and Fork course where you can attend for free.
Use this for your advantage and take you seat and start to dive in the world of Newtons law of Action/Reaction on this website: mytradingcoach.teachable.com
P!

USD - Hell of a range and on the way to the south?P5 is reached...at least it looks like.
The tiny lower close is very suspicious...
At least price broke out of the "creative" downsloping Fork and reached the CL.
From here price either zooms through the CL, or comes down to the L-MLH.
Chance for the walk to the south are 80% - same as going to the CL!
And why NOW?...well, as i said, price reached the CL. So it's at the center OR
it is at a potential extreme. If you think about it for a while - the CL could be the
upper extreme...if you threw in a WL (Warning line = 50% projection to the downside)...
Think about this...
P!

NSC - Dead End for the Bears?This Company was mentioned in my options group
and it looked very interesting to me. So i got my
hands on it and found a nice potential trade.
The fast run down seems to have a end.
Frequency catched up bevor, then shifted and now
we find price at the WL (Warning Line), where the
shifted Frequency meets Action/Reaction.
Potential for a long with a nice stopp below 71
seems a fair bet for a PTG between 95/100.
P!

SPX - Similarity...uncertainty...now what?The 2011 pattern looks very similar to the one we have now.
Even the priceaction from the Bars look nearly the same to me.
Facts for Long
- similar pattern as in 2011
- support at the L-MLH is pointing North.
- no real LT low is broken!
- so far a wide distance from the open to the actual (potential) close
Facts for Short
- the frequency shift (red slidings) on the top, warn about the temporarily potential Max. High.
- if price is reaching the CL and U-MLH (Convergence), ther's a high probability that it is a classic Test/Rtest of the "zoomed" Centerline, and that price is heading south, to the next line - the L-MLH (Lower Medianline Parallel)
- if price would continue north, it had to eat through the upper resistance block
So, really no cristal clear statement.
How could we trade? How about income trades with options, where wo don't even have to know where the market is going?
Take credit from below the market AND from above the market?
Whereever this market will go, it's time to play it save...but also to capitalize on the opportunities...
P!

Gold - Potential to fall below 1100Trade what you see...Facts, nothing more.
In this Chart the facts are, Gold has had havy resistance athe the CL's and the U-MLH, now breaking the most important, Big-Boy CL's again to the South.
Steam is blown in the wind and many probably getting hurt...again...
Longterm i see Gold far below 1100, not just at the CL.
...but this is just my opinion, no facts, just reading in the Espresso ;-)
P!
