GDX Gold Miners First Take Profit Reached, Still Long Short TermThis is a continued trade based on my previous post. This was posted on my blog yesterday night
We have a big week ahead of us with potential updates on several important political event, along with some important economic data being released throughout the week. The news that we should keep our eyes on are updates on the trade deal, and vote outcomes of the Brexit extension set to be voted on Wednesday. US and China are in what seems like the final stretch of signing a trade deal that could help boost the world economy, however we can’t discount the multiple occasions where US trade reps admitted that there are still issues which need to be resolved before a deal can be made. As long as investors are still in the dark, markets will likely trade in a range as the speculation continues.
Wednesday is looking like a big day in terms of catalysts that could drive the market in one direction, at least in the very short term. We have the decision on the Brexit extension, as well as CPI numbers coming out in the US. These indicators and events could help Gold break out of its recently tight range and make a strong push in one direction. As previously mentioned in my daily posts, Gold has been consolidating at the bottom end of its descending triangle, meaning it’s found support and more likely to breakout to the upside than downside. As of writing this, Gold is up 0.4% overnight so far and I believe it’ll push up to at least the downward trendline.
The US dollar is still relatively flat, and looks to be consolidating as well near the top end of the ascending triangle. My current view is still that it’ll likely trend down after some more sideways trading, however my thesis depends on the price action this week so stay tuned for my daily updates.
Yields are starting to slip as investors wait for more catalysts, with CPI numbers and the Fed minutes being the most important ones this week.
Gold miners will likely continue its short-term trend upwards given the bullish sign from Gold. While I am bullish on miners in the short term, I will be actively taking profits as it hits the previous resistances marked on the chart. My medium term view is still unclear and depends on further macro development and more concrete directional news flow. I will also be watching the price action throughout the week to gauge sentiment that might be helpful in my predictions.
Have a great trading week everyone!
NUGT

GDX Not Done YetGold falls as US dollar rises, accompanied by an across the curve rise in yields. Today’s macro news was relatively light with GDP data coming in slightly lower at 2.2% vs 2.4% expected, and initial jobless claims 211K vs 225K expected. There was a new piece of trade news indicating that China is willing to give the US more access to its domestic cloud-computing industry.
The market is currently looking for more directional signals, whether it be from trade news or economic data. The yield curve remains inverted when you consider the 3 months and 10 year, however that does not give a clear sell signal as of yet. The initial sell-off due to the inversion was quickly bought up, indicating that there’s still a lot of bullish momentum. A recent JPM analyst showed that even though the 3 and 10 inversion preceded all the recessions, it wasn’t until months later that the market turned negative. In fact, the market performs has historically performed well right after an inversion. What I believe is most likely is that the SPX will trade in a fairly large range until a string of positive or negative news can push it into a longer trend. Range is between $263 and $285, it seems like a large range but when considering the amount of volatility we’ve had over the last year, it’s not unlikely that we may get a 5%-6% correction, especially since the SPX has been trading at the top of its range over the last 6 months. If the correction does come, I believe it might cause some investors to think the same 2018 sell-off is happening, and pile into gold as a safe haven.
Yield Curve Forecast:
Yields will likely remain flat and trade within the current range, unless a string of positive economic news is released. The 10 yr is likely to trade within the 2.35%-2.45% range. This will help support gold prices in the near future.
US Dollar Forecast:
The US dollar has recently consolidated and has finally pushed upwards towards its resistance at 12275 (US dollar index). It’s currently trading in an ascending triangle pattern and could be stopped again at that key resistance. If that’s the case, then I expect the US dollar to fall to the sub 12100 levels. This will help push gold prices up further in the near term.
Gold Miners Forecast:
I believe gold miners still have more room to run for several reasons, most are mentioned above:
1.) The probability of the US dollar going on a major bull run is slim.
2.) Yields should continue to be pressured downwards/staying in this low range
3.) Uncertain backdrop of global growth won’t cause a major sell off in safe haven metals such as gold
I’ve accumulated 10% of a full position in $NUGT today at $20.47 at that first support, which it proceeded to break through in the afternoon. Looking to add 30% of full position at $19.05 and then another 30% at $18.


$jnug $nugt $dust $gdxj Gold miners threaten Breakout$jnug $nugt $dust $gdxj Gold miners threaten Breakout


Gold Price Clearly Defined and Price TargetsThis last chart, a Monthly price chart, illustrating the Pennant/Flag formation in Gold should be the clearest example we can provide that Gold will soon break out to the upside and rally extensively higher if our research and analysis are correct. The momentum that has built up over the past 2+ years, as well as the global demand for Gold by central banks and by investors as a hedging instrument, could prompt Gold and Silver to rally at least 50~60% in this first upside breakout wave – resulting in $1900 gold prices. Silver could rally to well above $18~19 in a similar move and the number our researchers believe may become the upside target in Silver is $21.

Just admit that gold is at resistance and bearish!Just admit that gold is at resistance and bearish!
The chart speaks for its self.
The Russell 2000 ETF continues to deliver critical technical and longer-term price patterns for skilled technicians. Combining the IWM chart with the Transportation Index, Oil, Gold, and others provide a very clear picture of what to expect in the immediate future.
Recently, we posted a research article about the Head-n-Shoulders pattern setting up in the $INDU. Again, the IWM chart is also showing a very clear Head-n-Shoulders pattern with critical resistance near $159.50 and support near $144.25. Our researchers, at Technical Traders Ltd., believe this right Shoulder will prompt a downside market move towards support near $144.25 before a downward sloping wedge pattern sets up. This first downward price leg will setup and congesting wedge formation that will, eventually, break to the upside and drive market prices higher.
I also posted a Russell 2K ( IWM ) forecast here www.thetechnicaltraders.com

Dollar and Precious Metals at Key Turning PointsDollar index is testing its lower support channel and could have a strong bounce, which in turn would send precious metals tumbling. Gold miners are looking bearish on the daily chart and I expect a move lower this week. See more videos at www.TheTechnicalTraders.com

NUGTDecided to put some Golden Charts out here for you tonight and what better way than with NUGT right on the line wow! ready to go long or short with this set up based on which line she crosses.

Gold/GLD Weekly Chart Video Shows What to Expect NextThis is my first video on Tradeviews and I'm still learning the software but I wanted to give it a try and share my overall analysis for what you should expect next in gold.
GLD GDX GDXJ JNUG NUGT SIL SILJ
I share my daily pre-market video each and every day before the market opens on my website
.

Commodities and Transportation paint PictureOur ongoing efforts to dissect these markets and to help educated and inform traders has led us on an exploration path into the general market activities of two leading market indicators; Commodity prices and Transportation Prices. These two core elements of any regional or global economy are usually about 3~6 months ahead of the general markets. When viewing the Transportation Index, remember that transportation is key to any growing economy and a healthy economy. When an economy is doing well, the transportation sector will be busy shipping and delivering consumer product and staples as well as manufacturing equipment and supplies. When viewing the Commodity Index, remember the Supply and Demand equation where greater demand for commodities needed to manufacture, create, deliver or sell a product will drive prices higher as supply remains relatively constant, prices will increase.
Therefore, the theory of today’s research post is “are Transportation and Commodity prices telling us anything important about the future stock market valuations?”. Let’s get into the research.
First, the NASDAQ Transportation Index is painting a very clear picture that the upside price move starting near the end of 2016 drove prices well above historical normal ranges. Even today, we are well above historical ranges originating from the lows in 1998 and including the range expansion from the highs of 2007 to the lows of 2009. Given the premise that the Transportation Index would be highlighting increased economic activities across the planet and particularly those of more mature economies, one should expect that global trade/economic activity should be near all-time highs.
What we would expect to find to help confirm our analysis is the price levels of general commodities would be increased to match the renewed optimism we believe is growing in the global markets. Obviously, if the global economies are doing well and trade/sales are increasing, then we would expect core commodity levels to increase as demand stays strong which we have seen this happen time and time again during economic cycles.
GLD SLV GDX JNUG NUGT SIL GDXJ IYT XTN TPOR


Gold need a correction before a more clear signalGold broke its previous resistance and move higher. And we could find that there are tons of resistances ahead of current level.
RSI and MACD are overbrought. So i think we need a healthy correction very soon.

Gold should fall to this support level before bouncingThe US Dollar is poised to rally back to near $97.50 as this recent downside price swing ends. We believe the US/China trade talks and North Korea deal with result in a strong upside potential for the US Dollar and the US stock market as time progresses.
A certain number of industry analysts are starting to announce the recent December 24th lows and subsequent rally as a “new bull market”. We have been suggesting to our followers that this market has lots of room to run as a continued global capital shift takes place. We do expect some price rotation over the next 3~5+ weeks in certain sectors – including the US stock market and Gold. We believe the US Dollar INDEX:DXY strength will continue to push higher, above $97, with the potential to reach near $99 before the end of this year.

DXY weekly, possible head and shoulders. FOMC TomorrowDXY weekly, possible head and shoulders. FOMC Tomorrow will send it lower? Powell said 2 raises this year from previous 4. I think they keep dovish tone, until economic data is better. Consumer sentiment was 120, compared to 124. Oil looks really good, gold has quite a run already. I am in 1/3 pos $UWT and $Nugt. Sanctions against Venezuela could be bullish for oil too. Good luck!


Short GDX, Gold. Hitting $1280 resistanceShort GDX, Gold. Hitting $1280 previous resistance, 50% Fibonacci level. $GDX has hit resistance and cannot close above $21. Sold my nugt from 2 weeks ago. Now bought 1/3 of $dust for swing. January, markets may rebound, so metals go down. Will wait and see, Happy new year!

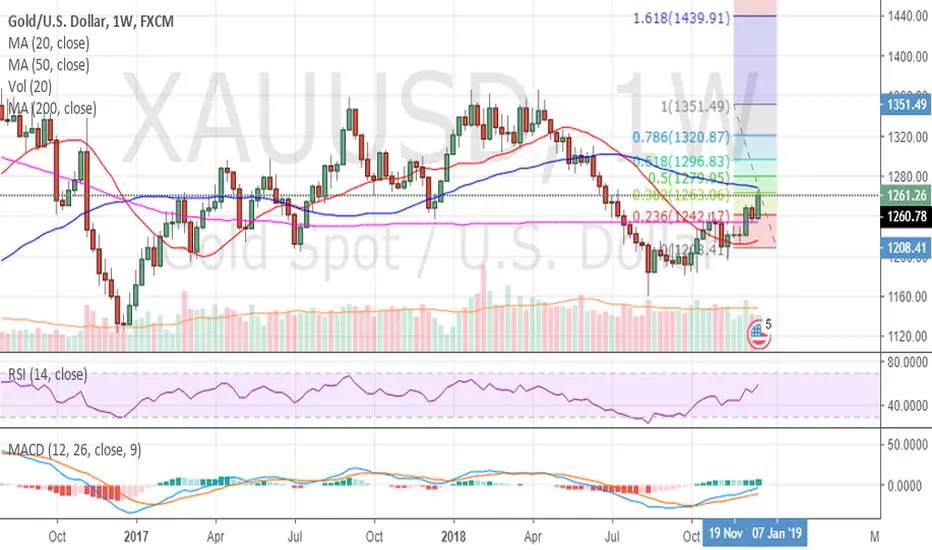
Bullish XAUUSD with close over $1260, FIB Level at .382Bullish XAUUSD with close over $1260, FIB Level at .382. Looking for back test of 200 MA, $1252 or so. Trump news and gov't shutdown could push gold higher for next month. FOMC said 2 hikes in 2019, instead of original 3 and they will be data dependant. GDP data out Dec 21. I am in $GDX Jan $20 Calls and Jan $QQQ 152 puts. Bearish USD to .95 or lower in next 2 weeks. Happy holidays! DK

Jnug to Gold "final drop in bound"?I am expecting gold to move into its final drop and possibly bottom in February. Then we should get a very strong move up similar to the 2016 run. I do not see the start of the bull gold market. Just a large strong C wave up to above $1400.
And miners should also make a similar move as the 2016 run. GL


RANGE BREAK in gold miners! NUGT 3X ETFNugt is a 3x . your starting to see GDX setup. this is a nice bottom booty bounce setup here over the break of this trendline
stops would be at 9ema on daily chart. STill needs to setup intraday looking for break and then dip

consolidating (M): sideways on the monthly very long term breakout over 1375 (above 2yr high: Aug 2016) holding leaps C's for now $GDX $NUGT $ABX $$GDXJ $URA (gold+uranium)
