Daily Bullish Signal #NXS #NXSBTC (26-09)#NXS (NXS/BTC)
Buy : 1300
Flash Sell : 1350
Short Sell : 1400
Long Sell : 1500-1600-1700-1800
Stop : 1200
Follow me for more signals daily
Inbox me if you need help or learn to trade
NXSBTC

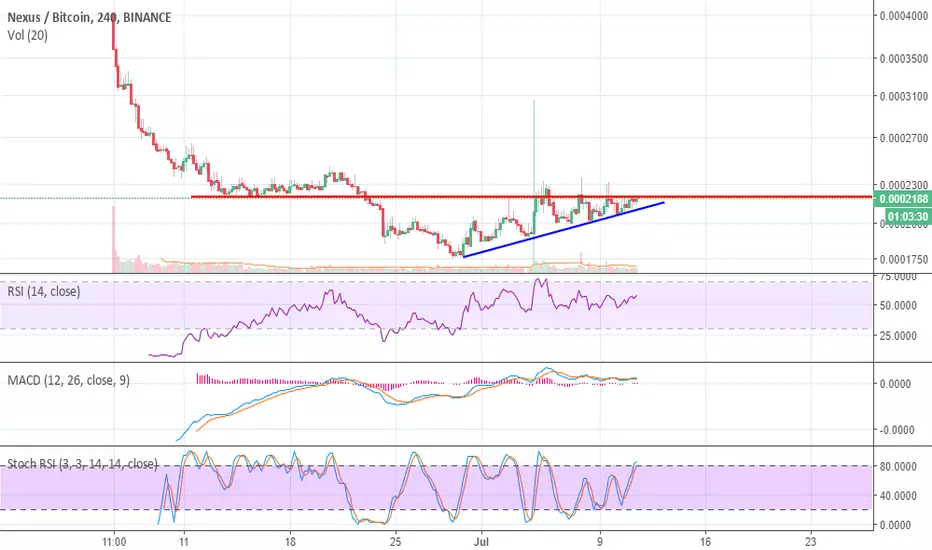
There is a possibility for the beginning of an uptrend in NXSBTCTechnical analysis:
. Nexus/Bitcoin is in a range bound and the beginning of uptrend is expected.
.The price is above the 21-Day WEMA which acts as a dynamic support.
. The RSI is at 50.
Trading suggestion:
. There is a possibility of temporary retracement to suggested support zone (0.00013642 to 0.00010182). if so, traders can set orders based on Price Action and expect to reach short-term targets.
Beginning of entry zone (0.00013642)
Ending of entry zone (0.00010182)
Entry signal:
Signal to enter the market occurs when the price comes to "Buy zone" then forms one of the reversal patterns, whether "Bullish Engulfing" , "Hammer" or "Valley" in other words,
NO entry signal when the price comes to the zone BUT after any of the reversal patterns is formed in the zone.
To learn more about "Entry signal" and the special version of our "Price Action" strategy FOLLOW our lessons:
Take Profits:
TP1= @ 0.00016799
TP2= @ 0.00018287
TP3= @ 0.00021931
TP4= @ 0.00028481
TP5= @ 0.00039385
TP6= @ 0.00048141
TP7= @ 0.00056937
TP8= @ 0.00069433
TP9= @ 0.00085432
TP10= Free

$NXS, Lower Low Ahead…
Weekly
Looking at our trend timeframe we see price continuing to respect our downtrend, stochastic rsi showing momentum is heading towards the upside. Will be watching smaller timeframe for entry, lower high formed at 15000 expecting price to continue falling towards our 5000 support zone.
Daily
Shifting over to our pattern timeframe we see a double bottom has formed inside our support zone. Stochastic RSI showing momentum looking to form a higher low and continue towards the upside. A daily close above 13700 activates our trade.

$NXS are we ready for another run?Just my thoughts on a possible path for NEXUS..
RSI could come down a bit lower then a nice bounce.
Possible head and shoulders on 30m if it gets rejected quite bullish.

Technical Analytic for #NXS #Nexus (27/08) - CryptoStation#NXS (NXS/BTC)
Buy : 1185
Flash Sell : 1190-1200-1210-1220
Short Sell : 1240-1260-1280-1300
Long Sell : 1350-1400-1450-1500
Stop : 1130
Follow me for more signals


$NXS, 20000 Support Or Bust…
Weekly
Looking at our highest timeframe we see price testing our major support of 20000 satoshis, stochastic rsi showing momentum has bottomed out. Expecting price to come as low 19500 on the weekly candle, however I do not expect price to close below this level.
Daily
Shifting over to our pattern timeframe we see price has found resistance at 22000, and has since been consolidating between 20000—22000. A daily close below either one of these levels indicates our next direction. Stochastic RSI showing momentum in favor of bulls with no signs of slowing down, although price is showing otherwise.

#NXS $NXS bullish long term idea (#bittrex, #binance)#NXS nice setup, added to Binance, road to 90k? Let`s wait and see....


NXSBTC Bittrex 4H up to 09JUN18 Crypto Trading Analysis (TA)BITTREX:NXSBTC
4H Chart, also works in 1H, at this time NEXUS (NXS) is testing the SUPPORT ZONE (0.00025383 BTC) by second time since May 27, gaining strength to increase its price. The 50, 100, 200 MA is about to cross down its 100/200 days signals (YELLOW ARROWS), the Volume is decreasing -BUY SIGNAL-, the Stochastic RSI Index is in Bearish below 20 & MACD below the Histogram both about to pierce up respectively (GREEN ARROWS), we could spect the NXS price to move UPwards in the next hours. But remember, this is our optimistic approach, keep in mind that is plenty of possibilities to witness a reverse from any point at any time. At this time the Market Cap is in the 340 Billions Band and the BTC is traying to push over $7.6K. Good Luck!
4H Chart, también funciona en 1H, en este momento NEXUS (NXS) está probando la ZONA DE APOYO (0.00025383 BTC) por segunda vez desde el 27 de mayo, ganando fuerza para aumentar su precio. El Indicador 50, 100, 200 MA está a punto de cruzar sus señales de 100/200 días (FLECHAS AMARILLAS), el Volumen está disminuyendo -BUY SIGNAL-, el índice estocástico RSI está en Bearish por debajo de 20 y MACD por debajo del Histograma ambos a punto de cruzarse en ascenso respectivamente (FLECHAS VERDES), podríamos esperar que el precio de NXS se mueva hacia ARRIBA en las próximas horas. Pero recuerde, este es nuestro enfoque optimista, tenga en cuenta que hay muchas posibilidades de presenciar un retroceso desde cualquier punto en cualquier momento. En este momento, Market Cap está en la Banda de 340 mil millones y el BTC está tratando de moverse por encima de $7,6K. ¡Buena suerte!
"Bitcoin will do to Banks what Email did to Postal Industry / El Bitcoin le hara a los Bancos lo mismo que el Correo Electronico hizo a la Industria Postal"
REMEMBER: I am not a financial adviser nor is any content in this article presented as financial advice. The information provided in this blog post and any other posts that I make and any accompanying material is for informational purposes only. It should not be considered financial or investment advice of any kind. One should consult with a financial or investment professional to determine what may be best for your individual needs. RECUERDE: No soy un asesor financiero y el contenido de este artículo no se presenta como asesoramiento financiero. La información provista en esta publicación de blog y cualquier otra publicación que haga y cualquier material que la acompañe es solo para fines informativos. No debe considerarse asesoramiento financiero o de inversión de ningún tipo. Se debe consultar con un profesional financiero o de inversiones para determinar qué es lo mejor para sus necesidades individuales.

$NXS - Nexus Daily Chart BittrexNexus has been on a good rin and finally broke through the 20, 50 and 200 period moving averages. The 20 and 50 periods are still below the 200 though but a cross of the 20 day may happen. I have been waiting for a correction to look for possible entry and we may have it soon. Right now we have a large momentum drop and a lot of selling going on which is normal after such a bullish run. What i want to see though is support at the 200 period moving average and a crossover of the 20 period. MACD is trending down though and i fear this coin may crash though if the 20 period crosses thats two good areas of support. Once we test this line and see a positive move, an entry may be viable. We will wait and see if we find this support first then I will look for the next move.

NXS – Mainnet in the sky? 420 % Possible EarningsHi our dear crypto family.
We are back with another trading idea.
Today we will make summary of NXS.
Nexus has revolutionary idea to create its mainnet on the orbit.
Each satellite will operate as a full node, and connect with its peers in orbit and on the ground to establish a complete mesh network that will be resistant to external control. This robust and autonomous infrastructure will run parallel to the Internet, providing alternate pathways for the global community.
How cool is that???
Nexus is creating a distributed satellite and ground based mesh network to enable global access to the Nexus blockchain. In partnership with Vector Space Systems, a nanosatellite company, we will launch communication satellites to provide a fast, affordable, and secure network with unparalleled coverage, distributed across multiple satellites for enhanced reliability and performance. The capabilities provided by the Galactic Sky platform combined with the flexibility of Vector’s launch model bring us one step closer to accomplishing our mission of providing the world with a decentralized currency that can be accessed virtually anywhere, anytime.
This is not the end of innovation.
Three dimensional blockchain - Using a unique implementation of three consensus channels, Nexus will transform the blockchain into a 3D process called the 3 dimensional chain. By adapting to transaction volume, using trust to secure the network, and weighting transactions to determine the most efficient use of resources, the 3DC will increase decentralization and limit the influence exerted by any one system. The 3DC protocol will organically scale to meet network computational demands, which means the network will get faster as more nodes join the system.
Moreover, they claim to be first truly quantum-resistant blockchain, incorporating advanced cryptography designed to negate the threat posed by quantum technology of the future. The 3DC combines 571-bit private keys, 1024-bit Skein and Keccak quantum-resistant hashing algorithms, and an evolving signature scheme called signature chains.
Team
They have a strong team (21 people on board – 6 experienced developers).
Their Chief Software Architect is Collin Cantrel who is experienced coder (since he was 6), music composer and entrepreneur. He is also enthusiasts of space science and quantum phisic. He designed the whole protocol aiming to be the best and most robust.
Ajay Ahuja – very experienced executive (over 20 years) - leading global business initiatives across industries, ranging from developmental-stage companies to Fortune 100 corporations.
Scott Bischoff - has 20+ years cross-functional leadership experience in multiple Fortune 500 companies including Bristol-Myers Squibb and Teva. Areas of expertise include strategic marketing, business development, operations, project management, and finance.
When looking at google trends we are now increasing rapidly.
We are level 34 and growing which is very good sign as we need interest for buy. We need buy for price increase. trends.google.com
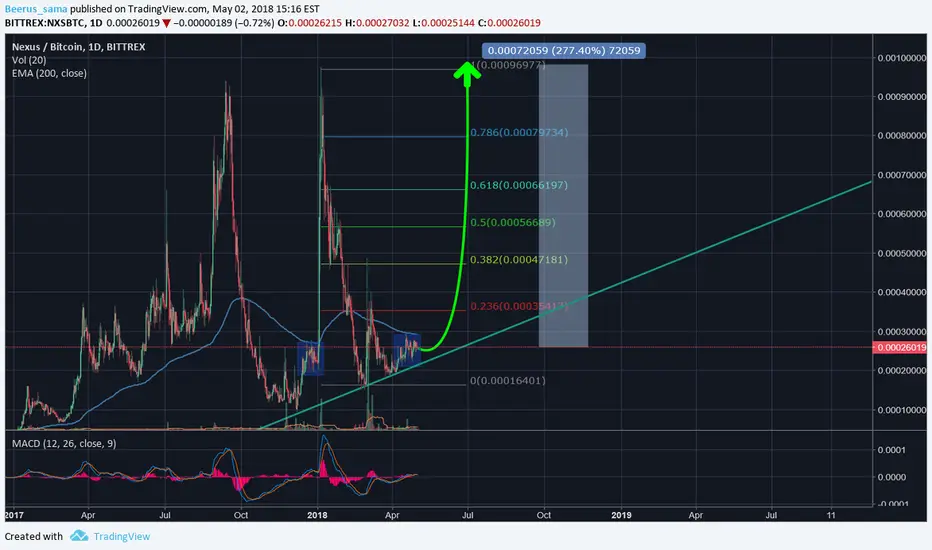
Technical Analysis details:
Very low at Fibonacci scale
According to Volume Profile we just crossed the “ fair trade” line which is at 0.00023615. At this price many people have bought their NXS and want to sell with profit. We expect price rise.
According to Weis Wave we have almost no supply and demand is growing – GOOOD!
Chakin Money Flow indicator – we crossed 0 and we in uptrend. It means there is a price pressure – demand is growing.
MACD positive convergence – bullish
VWMA50 crossed
Fibonacci:
Target 1: 0.00042556
Target 2: 0.00052782
Target 3: 0.00063176
Target 4: 0.00077760
Target 5: 0.00096368 (ATH)
Target 6: 0.00149867 (new ATH)
Stop-loss: 0.00025896
Thank you for all support. You are the reason why we are making this.
If you like our job give us a like. Do not hesitate to comment. We are very open and value your contribution!

NXS next cyle 1st target @0.00033-35
2nd target @0.00045-47
3rd target @0.00055-57
4th target @0.00065-67
5tt target @0.00077-80
ALL TIME HIGH @0.00097
$NXS - Nexus Daily ChartNexus has had a good overall run on the long term so I am looking for an entry point. It seems though I may have missed my opportunity as over the last week we have seen some nice gains overall. Right now though we are breached above the top Bollinger Band and the BB% shows we are overbought. This means we will see some correction happening, though this is good. Depending on where we correct too I may consider an entry. The AC oscillator is still green showing the trend is still strong and as long as we close above 28549 today that becomes a new line of support, so I hope for a correction this point and wait for a verified bounce. If this new support doesn't hold, we can see correction as far down as the 20 period moving average. As long as we see support there, this is still a viable trade to look for entry.

There will be LAMBOS after NXS Moon!This is a Weekly Chart. Any guesses where its headed?
I've been watching it for a while now.
The bounce from support is now confirmed. This is a solid buy imo for Long term. Buy now and put sell orders at 100-250% and forget about it.
I just bought some and gonna hold for atleast 1 month. Maybe 2.
Oh and Previous weekly Candle was a BUY according to my FOMO Indicator (Blue candle).
Look what happened to its price after blue candles on weekly chart.


There is possibility for the beginning of uptrend in NXSBTCTechnical analysis:
NEXUS/BITCOIN is in a range bound and beginning of up trend is expected.
The price is below the 21-Day WEMA which acts as a dynamic resistance.
The RSI is at 49.
Trading suggestion:
The price is in a range bound, but we forecast the uptrend would begin.
There is possibility of temporary retracement to suggested support zone (0.000193 to 0.000100), if so, traders can set orders based on Daily-Trading-Opportunities and expect to reach short-term targets.
Beginning of entry zone (0.000193)
Ending of entry zone (0.000100)
Entry signal:
Signal to enter the market occurs when the price comes to "Buy zone" then forms one of the reversal patterns, whether "Hammer" or "Valley" , in other words,
NO entry signal when the price comes to the zone BUT after any of reversal patterns is formed in the zone.
To learn more about "Entry signal" and special version of our "Price Action" strategy FOLLOW our lessons:
Take Profits:
TP1= @ 0.00026
TP2= @ 0.00036
TP3= @ 0.00046
TP4= @ 0.00056
TP5= @ 0.00095
TP6= Free


Nexus - Positive Vibes Only #Nexus #NXSNXS is close to my heart and it looks like the market agrees.
This one has positive energy returning into it for the next 60 days or so and should see a nice return in the market.
I know they are working on sending blockchain satellites into space... But can they put one on The Moon as well??
Only Time will Tell...
Peace & Love.
BK

Next Stop Moon, Nexus Long
Weekly
*Notes In Picture*
Daily
Looking over at our trend timeframe we can see price has hit major resistance @ 0.00030000 forming a triple top. Minor support currently being tested on daily @ 0.00030000. Stochastic RSI showing momentum is heading towards the upside.
4Hour
Shifting over to our pattern timeframe we can see price is respecting our uptrend forming higher highs and higher lows. A 4hour break and close above 0.00027000 activates our 4hour trade. Stochastic RSI showing momentum is slowing down and searching for equilibrium.
Hourly
Finally shifting over to our trigger timeframe we can see price failed to hold a higher low and was followed by a Lower High. Price has now returned to form a Lower Low @ the same time testing the beginning of our uptrend. A hourly close above 0.00026000 activates our aggressive trade.
Conclusion
Buy: After 4hour close above 0.00027000
Sell: Please No
