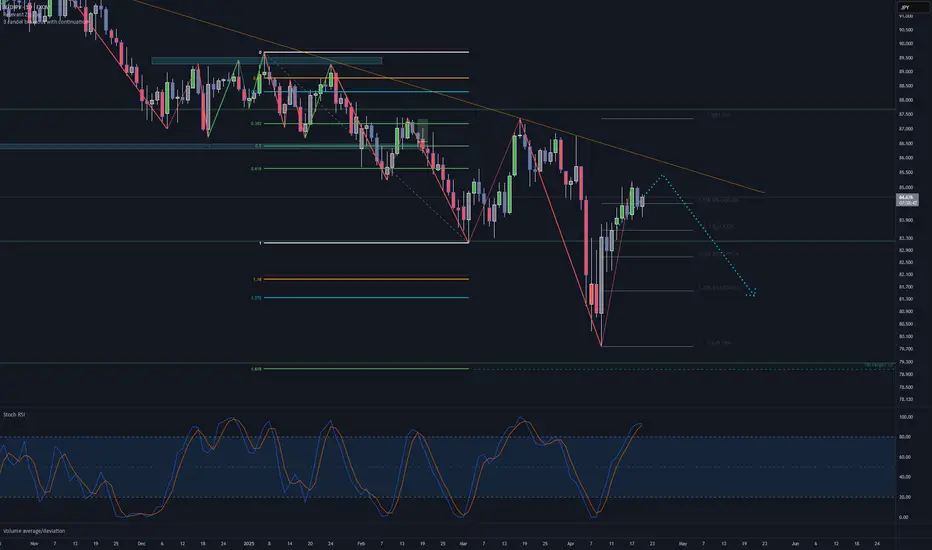
NZDJPY: Short Signal Explained
NZDJPY
- Classic bearish formation
- Our team expects fall
SUGGESTED TRADE:
Swing Trade
Sell NZDJPY
Entry Level - 85.165
Sl - 85.986
Tp - 83.647
Our Risk - 1%
Start protection of your profits from lower levels
Disclosure: I am part of Trade Nation's Influencer program and receive a monthly fee for using their TradingView charts in my analysis.
❤️ Please, support our work with like & comment! ❤️
NZDJPY

NZD/JPY SHORT FROM RESISTANCE
Hello, Friends!
The BB upper band is nearby so NZD-JPY is in the overbought territory. Thus, despite the uptrend on the 1W timeframe I think that we will see a bearish reaction from the resistance line above and a move down towards the target at around 83.709.
Disclosure: I am part of Trade Nation's Influencer program and receive a monthly fee for using their TradingView charts in my analysis.
✅LIKE AND COMMENT MY IDEAS✅

NZDJPY The Target Is UP! BUY!
My dear followers,
I analysed this chart on NZDJPY and concluded the following:
The market is trading on 82.050 pivot level.
Bias - Bullish
Technical Indicators: Both Super Trend & Pivot HL indicate a highly probable Bullish continuation.
Target - 83.982
Safe Stop Loss - 81.284
About Used Indicators:
A super-trend indicator is plotted on either above or below the closing price to signal a buy or sell. The indicator changes color, based on whether or not you should be buying. If the super-trend indicator moves below the closing price, the indicator turns green, and it signals an entry point or points to buy.
Disclosure: I am part of Trade Nation's Influencer program and receive a monthly fee for using their TradingView charts in my analysis.
———————————
WISH YOU ALL LUCK

NZDJPY - Following the Bears...Hello TradingView Family / Fellow Traders. This is Richard, also known as theSignalyst.
📈From a long-term perspective, NZDJPY has been overall bearish trading within the falling wedge pattern in red.
Moreover, the orange zone is a strong supply.
🏹 Thus, the highlighted red circle is a strong area to look for sell setups as it is the intersection of the upper red trendline and supply.
📚 As per my trading style:
As #NZDJPY approaches the red circle zone, I will be looking for bearish reversal setups (like a double top pattern, trendline break , and so on...)
📚 Always follow your trading plan regarding entry, risk management, and trade management.
Good luck!
All Strategies Are Good; If Managed Properly!
~Rich
Disclosure: I am part of Trade Nation's Influencer program and receive a monthly fee for using their TradingView charts in my analysis.

Bullish bounce?NZD/JPY has bounced off the support level which is an overlaps support that lines up with the 23.6% Fibonacci retracement and could rise from this level to our take profit.
Entry: 83.98
Why we like it:
There is an overlap support level that lines up with the 23.6% Fibonacci retracement.
Stop loss: 82.82
Why we like it:
There is an overlap support level that is slightly above the 50% Fibonacci retracement.
Take profit: 86.15
Why we like it:
There is a pullback resistance level.
Enjoying your TradingView experience? Review us!
Please be advised that the information presented on TradingView is provided to Vantage (‘Vantage Global Limited’, ‘we’) by a third-party provider (‘Everest Fortune Group’). Please be reminded that you are solely responsible for the trading decisions on your account. There is a very high degree of risk involved in trading. Any information and/or content is intended entirely for research, educational and informational purposes only and does not constitute investment or consultation advice or investment strategy. The information is not tailored to the investment needs of any specific person and therefore does not involve a consideration of any of the investment objectives, financial situation or needs of any viewer that may receive it. Kindly also note that past performance is not a reliable indicator of future results. Actual results may differ materially from those anticipated in forward-looking or past performance statements. We assume no liability as to the accuracy or completeness of any of the information and/or content provided herein and the Company cannot be held responsible for any omission, mistake nor for any loss or damage including without limitation to any loss of profit which may arise from reliance on any information supplied by Everest Fortune Group.

NZDJPY short oportunityWatch for end of retracment trade!
I think this can be good RR oportunity, the Target is to Low of previousextension.
On 4 chart we are already see some bearih divergances, But still in uptrend. Soo wiat for some kind of confirmation.
Trade safe ;)
SHORT ON NZD/JPYNZD/JPY is in a overall downtrend.
Price has completed its pullback phase to a key supply area and has created bearish divergence.
I expect price to drop to the next support level which was the previous low it created. (green line).
I am aiming to make 300-400 pips

NZDJPY is Approaching The Daily TrendHey Traders, in today's trading session we are monitoring NZDJPY for a selling opportunity around 86.000 zone, NZDJPY is trading in a downtrend and currently is in a correction phase in which it is approaching the trend at 86.000 support and resistance area.
Trade safe, Joe.

NZD/JPY BEST PLACE TO SELL FROM|SHORT
NZD/JPY SIGNAL
Trade Direction: short
Entry Level: 84.696
Target Level: 82.624
Stop Loss: 86.074
RISK PROFILE
Risk level: medium
Suggested risk: 1%
Timeframe: 8h
Disclosure: I am part of Trade Nation's Influencer program and receive a monthly fee for using their TradingView charts in my analysis.
✅LIKE AND COMMENT MY IDEAS✅

NZDJPY: Market of Sellers
Balance of buyers and sellers on the NZDJPY pair, that is best felt when all the timeframes are analyzed properly is shifting in favor of the sellers, therefore is it only natural that we go short on the pair.
Disclosure: I am part of Trade Nation's Influencer program and receive a monthly fee for using their TradingView charts in my analysis.
❤️ Please, support our work with like & comment! ❤️

Bullish bounce?NZD/JPY is falling towards the pivot and could bounce to the 1st resistance.
Pivot: 83.52
1st Support: 82.38
1st Resistance: 85.13
Risk Warning:
Trading Forex and CFDs carries a high level of risk to your capital and you should only trade with money you can afford to lose. Trading Forex and CFDs may not be suitable for all investors, so please ensure that you fully understand the risks involved and seek independent advice if necessary.
Disclaimer:
The above opinions given constitute general market commentary, and do not constitute the opinion or advice of IC Markets or any form of personal or investment advice.
Any opinions, news, research, analyses, prices, other information, or links to third-party sites contained on this website are provided on an "as-is" basis, are intended only to be informative, is not an advice nor a recommendation, nor research, or a record of our trading prices, or an offer of, or solicitation for a transaction in any financial instrument and thus should not be treated as such. The information provided does not involve any specific investment objectives, financial situation and needs of any specific person who may receive it. Please be aware, that past performance is not a reliable indicator of future performance and/or results. Past Performance or Forward-looking scenarios based upon the reasonable beliefs of the third-party provider are not a guarantee of future performance. Actual results may differ materially from those anticipated in forward-looking or past performance statements. IC Markets makes no representation or warranty and assumes no liability as to the accuracy or completeness of the information provided, nor any loss arising from any investment based on a recommendation, forecast or any information supplied by any third-party.

NZDJPY to continue in the sequence of lower highs?NZDJPY - 24h expiry
The primary trend remains bearish.
The rally is close to a correction count on the daily chart.
The RSI is trending lower.
Bearish divergence is expected to cap gains.
Bespoke resistance is located at 84.50.
Preferred trade is to sell into rallies.
We look to Sell at 84.50 (stop at 85.15)
Our profit targets will be 81.90 and 81.50
Resistance: 85.00 / 85.50 / 86.30
Support: 83.20 / 82.25 / 81.85
Risk Disclaimer
The trade ideas beyond this page are for informational purposes only and do not constitute investment advice or a solicitation to trade. This information is provided by Signal Centre, a third-party unaffiliated with OANDA, and is intended for general circulation only. OANDA does not guarantee the accuracy of this information and assumes no responsibilities for the information provided by the third party. The information does not take into account the specific investment objectives, financial situation, or particular needs of any particular person. You should take into account your specific investment objectives, financial situation, and particular needs before making a commitment to trade, including seeking advice from an independent financial adviser regarding the suitability of the investment, under a separate engagement, as you deem fit.
You accept that you assume all risks in independently viewing the contents and selecting a chosen strategy.
Where the research is distributed in Singapore to a person who is not an Accredited Investor, Expert Investor or an Institutional Investor, Oanda Asia Pacific Pte Ltd (“OAP“) accepts legal responsibility for the contents of the report to such persons only to the extent required by law. Singapore customers should contact OAP at 6579 8289 for matters arising from, or in connection with, the information/research distributed.

NZDJPY The Target Is DOWN! SELL!
My dear friends,
Please, find my technical outlook for NZDJPY below:
The instrument tests an important psychological level 84.401
Bias - Bearish
Technical Indicators: Supper Trend gives a precise Bearish signal, while Pivot Point HL predicts price changes and potential reversals in the market.
Target - 82.960
Recommended Stop Loss - 85.188
About Used Indicators:
Super-trend indicator is more useful in trending markets where there are clear uptrends and downtrends in price.
Disclosure: I am part of Trade Nation's Influencer program and receive a monthly fee for using their TradingView charts in my analysis.
———————————
WISH YOU ALL LUCK

NZD_JPY SHORT SIGNAL|
✅NZD_JPY went up and
Retested the horizontal
Resistance above around 85.023
So we are locally bearish biased
And we can now take a short
Trade with the TP of 83.645
And the SL of 85.405
SHORT🔥
✅Like and subscribe to never miss a new idea!✅
Disclosure: I am part of Trade Nation's Influencer program and receive a monthly fee for using their TradingView charts in my analysis.

NZD-JPY Will Fall! Sell!
Hello,Traders!
NZD-JPY went up sharply
But then hit a horizontal
Resistance of 85.069
From where we are already
Seeing a bearish pullback
So we will be expecting
A local bearish move down
Sell!
Comment and subscribe to help us grow!
Check out other forecasts below too!
Disclosure: I am part of Trade Nation's Influencer program and receive a monthly fee for using their TradingView charts in my analysis.

NZDJPY: Market of Sellers
Our strategy, polished by years of trial and error has helped us identify what seems to be a great trading opportunity and we are here to share it with you as the time is ripe for us to sell NZDJPY.
Disclosure: I am part of Trade Nation's Influencer program and receive a monthly fee for using their TradingView charts in my analysis.
❤️ Please, support our work with like & comment! ❤️

Could the price reverse from here?NZD/JPY us rising towards the pivot an could reverse to the 1st support.
Pivot: 85.30
1st Support: 84.12
1st Resistance: 86.71
Risk Warning:
Trading Forex and CFDs carries a high level of risk to your capital and you should only trade with money you can afford to lose. Trading Forex and CFDs may not be suitable for all investors, so please ensure that you fully understand the risks involved and seek independent advice if necessary.
Disclaimer:
The above opinions given constitute general market commentary, and do not constitute the opinion or advice of IC Markets or any form of personal or investment advice.
Any opinions, news, research, analyses, prices, other information, or links to third-party sites contained on this website are provided on an "as-is" basis, are intended only to be informative, is not an advice nor a recommendation, nor research, or a record of our trading prices, or an offer of, or solicitation for a transaction in any financial instrument and thus should not be treated as such. The information provided does not involve any specific investment objectives, financial situation and needs of any specific person who may receive it. Please be aware, that past performance is not a reliable indicator of future performance and/or results. Past Performance or Forward-looking scenarios based upon the reasonable beliefs of the third-party provider are not a guarantee of future performance. Actual results may differ materially from those anticipated in forward-looking or past performance statements. IC Markets makes no representation or warranty and assumes no liability as to the accuracy or completeness of the information provided, nor any loss arising from any investment based on a recommendation, forecast or any information supplied by any third-party.

Last Week’s FX Recap: April 7–11 (Zone Reactions & Trade Notes)📈 Weekly Forex Recap – Market Reactions & Lessons (Apr 7–11)
Last week there were about +320 pips of reaction potential (excluding Gold, which I was completely off on). There were multiple opportunities to capture solid intraday or swing setups.
3 out of 6 weekly targets were hit.
5 out of 6 trend biases were either accurate or neutral —meaning no major misreads, aside from one or two volatile zones. The only pair that really got me was Gold.
Let’s run it back real quick:
✅ AUDJPY
Bearish bias accurate.
30 pip reaction off zone with just 1 pip drawdown.
Weekly target hit.
✅ NZDJPY
Bearish bias accurate.
Weekly target hit, though price never reached the watch zone.
No setup triggered, but direction was respected.
⚠️ EURUSD
Range-bound bias played out majority of the week.
Gave about 90–100 pip drop from the hot zone mentioned.
Weekly target came close but didn’t hit.
⚠️ GOLD
Watch zone completely failed.
Short-term bounce gave 480 pip reaction—but that volatility was tough to catch cleanly.
Directional bias wasn’t helpful here. Gold was chaos.
✅ EURGBP
Cleanest setup of the week.
Bias was bullish, price tapped the buy zone and ran 100 pips.
Weekly target hit. Textbook move.
⚠️ GBPUSD
Consolidation-heavy.
Watch zone gave 100 pip reaction, but weekly target didn’t hit.
Bias was unclear—no real conviction either way.
📉 Total Zone Reaction Potential: 320 pips
🎯 Weekly Targets Hit: 3/6
📊 Trend Accuracy: 50% (3 clear hits, 2 neutral, 1 miss)
But that’s done now.
Whether you hit it last week or fumbled the ball, let it go.
We trade forward. Eyes up. Mind clear.
Time to dive into the new week.
Let’s get it. 👊

Potential bullish rise?NZD/JPY has bounced off the support level which is an overlap support and could rise from this level to our take profit.
Entry: 83.42
Why we like it:
There is an overlap support level.
Stop loss: 82.42
Why we like it:
There is a pullback support level.
Take profit: 85.16
Why we like it:
There is an overlap resistance level that aligns with the 78.6% Fibonacci retracement.
Enjoying your TradingView experience? Review us!
Please be advised that the information presented on TradingView is provided to Vantage (‘Vantage Global Limited’, ‘we’) by a third-party provider (‘Everest Fortune Group’). Please be reminded that you are solely responsible for the trading decisions on your account. There is a very high degree of risk involved in trading. Any information and/or content is intended entirely for research, educational and informational purposes only and does not constitute investment or consultation advice or investment strategy. The information is not tailored to the investment needs of any specific person and therefore does not involve a consideration of any of the investment objectives, financial situation or needs of any viewer that may receive it. Kindly also note that past performance is not a reliable indicator of future results. Actual results may differ materially from those anticipated in forward-looking or past performance statements. We assume no liability as to the accuracy or completeness of any of the information and/or content provided herein and the Company cannot be held responsible for any omission, mistake nor for any loss or damage including without limitation to any loss of profit which may arise from reliance on any information supplied by Everest Fortune Group.

NZDJPY We expect New Zealand to rise against the Japanese yen, but on the condition that the 84.138 area is broken to 83.875, and we target 86.318. But we must be careful because of geopolitical news, as any sudden decision completely changes the issues of analysis.

nzdjpy sell / shortBy utilizing levels, historical patterns, , we can formulate a hypothesis that the market might follow a similar trajectory if bullish sentiment prevails.

Potential bullish nounce?NZD/JPY has bounced off the pivot and could rise to the 1st resistance.
Pivot: 82.77
1st Support: 81.64
1st Resistance: 84.43
1st Resistance: 1.1089
Risk Warning:
Trading Forex and CFDs carries a high level of risk to your capital and you should only trade with money you can afford to lose. Trading Forex and CFDs may not be suitable for all investors, so please ensure that you fully understand the risks involved and seek independent advice if necessary.
Disclaimer:
The above opinions given constitute general market commentary, and do not constitute the opinion or advice of IC Markets or any form of personal or investment advice.
Any opinions, news, research, analyses, prices, other information, or links to third-party sites contained on this website are provided on an "as-is" basis, are intended only to be informative, is not an advice nor a recommendation, nor research, or a record of our trading prices, or an offer of, or solicitation for a transaction in any financial instrument and thus should not be treated as such. The information provided does not involve any specific investment objectives, financial situation and needs of any specific person who may receive it. Please be aware, that past performance is not a reliable indicator of future performance and/or results. Past Performance or Forward-looking scenarios based upon the reasonable beliefs of the third-party provider are not a guarantee of future performance. Actual results may differ materially from those anticipated in forward-looking or past performance statements. IC Markets makes no representation or warranty and assumes no liability as to the accuracy or completeness of the information provided, nor any loss arising from any investment based on a recommendation, forecast or any information supplied by any third-party.

Bullish rise?MZD/JPY is falling towards the pivot and could bounce to the 1st resistance.
Pivot: 82.77
1st Support: 81.64
1st Resistance: 84.63
Risk Warning:
Trading Forex and CFDs carries a high level of risk to your capital and you should only trade with money you can afford to lose. Trading Forex and CFDs may not be suitable for all investors, so please ensure that you fully understand the risks involved and seek independent advice if necessary.
Disclaimer:
The above opinions given constitute general market commentary, and do not constitute the opinion or advice of IC Markets or any form of personal or investment advice.
Any opinions, news, research, analyses, prices, other information, or links to third-party sites contained on this website are provided on an "as-is" basis, are intended only to be informative, is not an advice nor a recommendation, nor research, or a record of our trading prices, or an offer of, or solicitation for a transaction in any financial instrument and thus should not be treated as such. The information provided does not involve any specific investment objectives, financial situation and needs of any specific person who may receive it. Please be aware, that past performance is not a reliable indicator of future performance and/or results. Past Performance or Forward-looking scenarios based upon the reasonable beliefs of the third-party provider are not a guarantee of future performance. Actual results may differ materially from those anticipated in forward-looking or past performance statements. IC Markets makes no representation or warranty and assumes no liability as to the accuracy or completeness of the information provided, nor any loss arising from any investment based on a recommendation, forecast or any information supplied by any third-party.

NZDJPY - Potential bounce to 85.300 from SupportOANDA:NZDJPY has reached a major support level, an area where buyers have previously shown strong interest. This zone has acted as a key zone, increasing the likelihood of a bounce if buyers step in.
A bullish confirmation, such as a strong rejection pattern, bullish engulfing candles, or long lower wicks, would strengthen the case for a move higher. If buyers take control, the price could bounce toward the 85.300 target. However, a decisive breakdown below this support would invalidate the bullish scenario and could lead to further downside.
This isn’t financial advice, just my take on how I approach support and resistance zones. Best to wait for clear confirmation, like a strong rejection or a volume spike, before making a move.
Every trader has a unique perspective. Let’s discuss this setup within the TradingView community!
