DowJones bullish breakout retest?Key Support and Resistance Levels
Resistance Level 1: 45000
Resistance Level 2: 45445
Resistance Level 3: 46000
Support Level 1: 44000
Support Level 2: 43700
Support Level 3: 43430
This communication is for informational purposes only and should not be viewed as any form of recommendation as to a particular course of action or as investment advice. It is not intended as an offer or solicitation for the purchase or sale of any financial instrument or as an official confirmation of any transaction. Opinions, estimates and assumptions expressed herein are made as of the date of this communication and are subject to change without notice. This communication has been prepared based upon information, including market prices, data and other information, believed to be reliable; however, Trade Nation does not warrant its completeness or accuracy. All market prices and market data contained in or attached to this communication are indicative and subject to change without notice.
Community ideas

FTSE100 overbought pullback supported at 8880The FTSE remains in a bullish trend, with recent price action showing signs of a corrective pullback within the broader uptrend.
Support Zone: 8880 – a key level from previous consolidation. Price is currently testing or approaching this level.
A bullish rebound from 8880 would confirm ongoing upside momentum, with potential targets at:
8900 – initial resistance
9040 – psychological and structural level
9090 – extended resistance on the longer-term chart
Bearish Scenario:
A confirmed break and daily close below 8880 would weaken the bullish outlook and suggest deeper downside risk toward:
8840 – minor support
8820 – stronger support and potential demand zone
Outlook:
Bullish bias remains intact while the FTSE holds above 8880. A sustained break below this level could shift momentum to the downside in the short term.
This communication is for informational purposes only and should not be viewed as any form of recommendation as to a particular course of action or as investment advice. It is not intended as an offer or solicitation for the purchase or sale of any financial instrument or as an official confirmation of any transaction. Opinions, estimates and assumptions expressed herein are made as of the date of this communication and are subject to change without notice. This communication has been prepared based upon information, including market prices, data and other information, believed to be reliable; however, Trade Nation does not warrant its completeness or accuracy. All market prices and market data contained in or attached to this communication are indicative and subject to change without notice.

Kiwi on the Edge: Sell the Bounce Below 0.6080Among major currencies, the New Zealand Dollar (NZD) is often viewed as peripheral in global capital flows. Yet it consistently ranks among the world’s top 10 most traded currencies. Its relevance stems from New Zealand’s strong exposure to international trade, especially with China and Australia, and an economy heavily reliant on commodity exports. As a result, the NZD is classified as a "pro-risk" currency, highly sensitive to global cyclical dynamics, interest rate differentials, and Asian demand. It also maintains a strong correlation with the Australian Dollar (AUD), due to similar macroeconomic drivers and trade linkages.
In the FX community, the NZD is often affectionately referred to as the "Kiwi," a nod to the iconic flightless bird native to New Zealand and depicted on the country’s coins. Despite being a smaller player on the geopolitical scene, New Zealand’s currency frequently presents appealing opportunities for FX traders, particularly in times of shifting risk sentiment or commodity market volatility.
With the Reserve Bank of New Zealand (RBNZ) having just announced its latest policy decision, it’s time to reassess the Kiwi’s fundamental landscape, technical backdrop, and market sentiment to refine our directional trading outlook.
Fundamental Outlook: RBNZ holds rates, but easing bias remains
As widely expected, the RBNZ held its Official Cash Rate (OCR) steady at 3.25% during its July 9 policy meeting. This pause comes after an aggressive easing cycle that saw the OCR lowered by 225 basis points since August 2024. The move reflects the central bank’s aim to stabilize inflation without undermining the fragile recovery.
The tone of the accompanying statement remains dovish. Policymakers clearly left the door open for further rate cuts later in the year, conditional on continued disinflation and signs of weaker demand. For now, however, inflation is running at a comfortable 2.5% year-over-year, right in the middle of the RBNZ’s 1–3% target band. Meanwhile, the economy has shown some resilience: Q1 2025 GDP posted a quarterly gain of +0.8%, confirming a technical exit from the recession experienced in 2024.
Nonetheless, external headwinds remain a concern. Sluggish data from China (New Zealand’s largest trading partner) continue to cast a shadow over the medium-term outlook. Slower Chinese demand for dairy and meat exports, as well as raw materials, could limit the momentum of New Zealand’s recovery, thereby reinforcing the need for accommodative policy.
Technical Analysis: Key resistance near 0.6080
Technically, the picture has deteriorated significantly on the 6NU2025 contract since Monday, with a sharp downside acceleration toward the psychological 0.60 level. Price is still hovering around this threshold.
Volume profile analysis reveals a clear liquidity gap between 0.6040 and 0.6065, a zone that could be filled before any new directional move unfolds. Just above, a major congestion area emerges around 0.6080, where the point of control (POC) is located. This area represents a key short-term pivot and a potential resistance level, especially as it also sits just above the 10- and 20-day simple moving averages.
As long as price remains capped beneath 0.6080, the bias remains moderately bearish. A rejection in the 0.6060–0.6080 area would confirm resistance and suggest renewed downside risk. However, a decisive daily close above 0.6100 would invalidate the bearish scenario and open the door toward 0.6150 and possibly above. In the near term, the setup favors a cautious bearish stance, but timing remains critical.
Sentiment and Positioning: Retail crowded longs raise red flags
Commitment of Traders (COT) data provides additional context. As of the latest report, non-commercial speculators hold a net long position of approximately +4,150 contracts in the 6N futures. This moderately bullish stance likely reflects the unwinding of prior bearish bets in response to the sustained weakness of the US dollar over the past quarter. Meanwhile, commercial hedgers, typically exporters and importers, remain net short, which is structurally consistent with hedging flows rather than directional speculation.
From a retail perspective, the sentiment skew is more concerning. Aggregated positioning data across FX/CFD brokers shows that nearly 60% of retail traders are long NZD/USD. Some platforms report even more extreme figures, with bullish retail exposure above 80%. Historically, such one-sided positioning often foreshadows downside risk, especially if stop losses are triggered en masse below recent support levels.
Volatility conditions also merit attention. The VIX, Wall Street’s fear index, remains near its annual lows, suggesting a market backdrop of complacency. While this environment typically supports pro-risk currencies like the NZD, the fact that the S&P 500 just notched fresh all-time highs raises the possibility of profit-taking or corrective flows, potentially weighing on risk-correlated assets in the short term.
Trade Idea: Sell the rally toward 0.6060–0.6080
Given the current macro setup, sentiment profile, and technical resistance overhead, a sell-the-bounce approach appears tactically appropriate. We propose the following directional futures trade on the September contract (6NU2025):
Entry Point: Short at 0.6060, to take advantage of a potential fill of the low-volume gap
Stop Loss: 0.6100 on a daily close basis, just above the POC and confluence resistance
Target 1: 0.5985, below the recent swing low
Target 2 (extended): 0.5890, just under the June 23 bottom
This setup aims to capture a continuation of the downtrend that began in early July. It relies on disciplined risk management and realistic target zones, while respecting key technical structures and the crowded long positioning among retail traders. The strategy will be invalidated if prices manage to close above 0.6100 on a daily basis, signaling a shift in near-term momentum.
---
When charting futures, the data provided could be delayed. Traders working with the ticker symbols discussed in this idea may prefer to use CME Group real-time data plan on TradingView: tradingview.com/cme/.
This consideration is particularly important for shorter-term traders, whereas it may be less critical for those focused on longer-term trading strategies.
General Disclaimer:
The trade ideas presented herein are solely for illustrative purposes forming a part of a case study intended to demonstrate key principles in risk management within the context of the specific market scenarios discussed. These ideas are not to be interpreted as investment recommendations or financial advice. They do not endorse or promote any specific trading strategies, financial products, or services. The information provided is based on data believed to be reliable; however, its accuracy or completeness cannot be guaranteed. Trading in financial markets involves risks, including the potential loss of principal. Each individual should conduct their own research and consult with professional financial advisors before making any investment decisions. The author or publisher of this content bears no responsibility for any actions taken based on the information provided or for any resultant financial or other losses.

NVO: Trend Continuation With 4.74 R/R SetupNovo Nordisk ( NYSE:NVO ) is showing classic strength — bouncing off the cloud, reclaiming structure, and flashing early signs of momentum rotation. This is how you catch continuation trades without chasing.
📊 Technical Breakdown
Ichimoku: Price reclaimed the top of the cloud and is now building above it. Kijun and Tenkan are aligned. This is the first real bullish structure since the March breakdown.
MACD: Histogram curling upward. We’re not fully bullish yet, but the pressure is shifting back to buyers.
R1 Pivot ($81.31) is the first big test. A clean break above that opens the path toward R2 and beyond.
🎯 Trade Specs
Entry: $71.58
Target: $93.33 (+30.44%)
Stop: $67.00 (–6.42%)
Risk/Reward: 4.74 — elite-level skew for a high-quality name

USDCAD's Opportunity Bell Is Ringing — Don’t Miss Out!Hey there, my valued friends!
I’ve prepared a fresh USDCAD analysis just for you.
📌 If the 1.37245 level breaks, the next target will be 1.38000.
Every single like you send my way is the biggest motivation behind sharing these analyses.
🙌 Huge thanks to each and every one of you who supports me!
Would you like to add a visual or a catchy headline to boost engagement even more? I can help with that too.

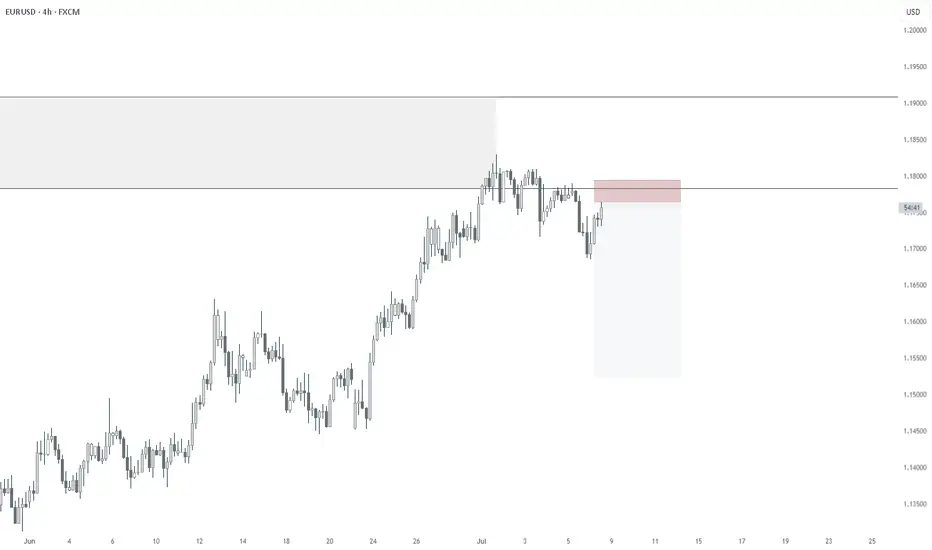
EURUSDRecent Price Action
• Price attempted to break the descending structure but failed near 1.1705.
• A bearish rejection followed by a drop to 1.1667 shows sellers remain in control.
• Current bounce to 1.1680 is weak — no strong bullish follow-through.
Next Move Scenarios
Scenario 1: Bearish Continuation (Base Case)
• If 1.1685–1.1700 holds as resistance, a move down is expected.
• Breakdown of 1.1667 likely leads to:
• Target 1: 1.1650
• Target 2: 1.1600
Sell Setup
• Entry: 1.1685–1.1695
• Stop Loss: 1.1715
• Take Profit: 1.1650 , 1.1600 and 1.15250

AUD/USD: Short Setup to 0.6450This trade idea is rooted in a data-driven approach, leveraging a rare asymmetry in the economic calendar and specific quantitative models to identify a high-clarity opportunity.
📊 The Thesis by the Numbers
My model assigns clear probabilities to the potential scenarios for this week, based on the scheduled U.S. data releases.
60% Probability: Base Case (USD Strength). Triggered by a U.S. Core CPI reading at or above 0.3% MoM.
30% Probability: Alternative Case (USD Weakness).
10% Probability: Wildcard Scenario (Risk-On Rally).
🧠 The Data-Driven Rationale
This setup scored a -5 on my quantitative thesis model, indicating a strong bearish conviction. The core of this is the one-sided event risk. With Australia's calendar completely empty, the AUD is a sitting duck. Meanwhile, a volley of tier-one U.S. data (CPI, PPI, Retail Sales) is expected to confirm a robust economy. This fundamental divergence, combined with a technical picture of price coiling below long-term resistance, creates the conditions for a catalyst-driven drop.
⛓️ Intermarket & Statistical Edge
Further analysis of market correlations and forward-looking models reinforces the bearish bias.
🌐 Correlations: The positive correlation of AUD/USD with equities (SPY: +0.31) suggests that a strong USD report, which could pressure stocks, would create a direct headwind for the Aussie.
🎲 Monte Carlo Simulation: While the mean outcome is neutral, the model's 5th percentile for price is down at 0.6503 , highlighting the statistical risk of a significant downside move if the catalyst fires.
✅ The Trade Setup
📉 Bias: Bearish / Short
👉 Entry: Watch for a bearish reversal pattern on the 1H or 4H chart within the $0.6550 resistance zone.
⛔️ Stop Loss: A decisive daily close above the 0.6622 resistance level.
🎯 Target: 0.6458 (June low-day close).
Good luck, and trade safe.

Trade Idea: $HOOD – $106C by 7/25 | Bullish Setup🧠 Thesis:
After topping out at $100, NASDAQ:HOOD pulled back ~10%. I believe this recent pullback sets up a healthy base for a continuation move back toward $100+ in the coming sessions. If momentum kicks in, we could see a push toward the $106 level by expiration.
📊 Key Levels:
Resistance: $95.60 → $97.34 → $99.77 → $102 → $106
Support: $94.00 (uptrend line), $92.97 (higher low), $90.97 (must hold for bulls)
📌 Trade Strategy:
I'm scaling into the $106 Calls expiring 7/25.
Looking for:
A breakout above $97.34 to trigger upside momentum
Profit-taking zones around $99.77 and $102
Final target near $106 (ITM zone)
Risk is managed below $92.97.
🧭 Notes:
Watching broader market sentiment and NASDAQ:QQQ correlation closely. Volume confirmation will be key on any breakout attempts.

07/08/2025 - EURUSD - HEDGE SHORTHedge Short for FX:GBPUSD
COT Retailer still extended
We are on the higher timeframe weekly zone
Substructure is already confirmed bearish
VI Stock(India) Looking for bullish Rally! {5/07/2025}Educational Analysis says that VI Stock (India) may give trend Trading opportunities from this range, according to my technical analysis.
Broker - NA
So, my analysis is based on a top-down approach from weekly to trend range to internal trend range.
So my analysis comprises of two structures: 1) Break of structure on weekly range and 2) Trading Range to fill the remaining fair value gap
Let's see what this Stock brings to the table for us in the future.
Please check the comment section to see how this turned out.
DISCLAIMER:-
This is not an entry signal. THIS IS FOR EDUCATIONAL PURPOSES ONLY.
I HAVE NO CONCERNS WITH YOUR PROFIT OR LOSS,
Happy Trading, Fx Dollars.

How to seize gold trading opportunitiesNews:
On Friday (July 11) in the Asian time zone, US President Trump posted a "tariff change" on social media, announcing that a 35% tariff would be imposed on all Canadian goods from August 1, a 10 percentage point increase from the current rate. This decision was like a thunderbolt, instantly igniting the market's risk aversion sentiment, and the spot gold price soared, reaching a high of $3,344 per ounce during the session. Although Trump extended the tariff agreement to August 1, which once suppressed the gold price, he subsequently stated that it would not be extended after the expiration, and launched further tariff attacks after the expiration, announcing a new 50% tariff on copper imports from the United States and a 50% tariff on goods from Brazil, which increased concerns about tariff risks and pushed the gold price to rebound from the bottom;
Gold trend analysis:
The market is fluctuating repeatedly now, and it is possible to rise or fall, but under the bullish trend, the main force is still rising. Therefore, this week's trading is to fall back and do more at a low price. Whether it is the previous 3285, 3304, or 3317, there are good profits. Although it is temporarily unable to break out of the bullish volume, at least the trend remains unchanged, and there will definitely be a large upward space in the future. Today is Friday, and we still pay attention to the possibility of bullish volume. This Monday has been emphasizing that if it rises during the week, it will look at the 3345 high point. If 3345 breaks, there are still 3365 and 3400 above. Friday will see whether this idea is realized.
From a technical point of view, all cycles are obviously bullish now. The daily line bottomed out on Tuesday, and Wednesday and Thursday were all small broken Yang rising. If it continues, we will first see whether the daily Bollinger middle rail 3345 pressure is broken. After the break, the big Yang closes high. This wave of rise may reach 3400. Therefore, the daily cycle has a lot of room for growth and should not be taken lightly. The H4 cycle needs to see whether today's rise can break 3345, because if it breaks 3345, there is a possibility of the upper rail opening. After the upper rail opens, gold will have a unilateral trend. Therefore, today's bullish target is 3345. If 3345 is not broken, there is still a possibility of a decline. If 3345 breaks, there will be 3365 and 3400 above. Here, it is clearly bullish and optimistic about the break of 3345. After determining the direction, the trading idea on Friday is also clear. It must be mainly long on the decline. The support below is 3320-3310. Don't chase more in the European session. Trade again if there is a decline.
Gold operation strategy: It is recommended to go long if it falls back to around 3315-3325, with the target at 3335-3345; it is recommended to consider shorting if it touches 3345 but does not break, with the target at 3335-3325.

USD/CHF H4 | Bearish reversal off a multi-swing-high resistance?USD/CHF is rising towards a multi-swing-high resistance and could potentially reverse off this level to drop lower.
Sell entry is at 0.7986 which is a multi-swing-high resistance that aligns closely with the 38.2% Fibonacci retracement.
Stop loss is at 0.8090 which is a level that sits above the 61.8% Fibonacci retracement and an overlap resistance.
Take profit is at 0.7871 which is a swing-low support.
High Risk Investment Warning
Trading Forex/CFDs on margin carries a high level of risk and may not be suitable for all investors. Leverage can work against you.
Stratos Markets Limited (tradu.com ):
CFDs are complex instruments and come with a high risk of losing money rapidly due to leverage. 63% of retail investor accounts lose money when trading CFDs with this provider. You should consider whether you understand how CFDs work and whether you can afford to take the high risk of losing your money.
Stratos Europe Ltd (tradu.com ):
CFDs are complex instruments and come with a high risk of losing money rapidly due to leverage. 63% of retail investor accounts lose money when trading CFDs with this provider. You should consider whether you understand how CFDs work and whether you can afford to take the high risk of losing your money.
Stratos Global LLC (tradu.com ):
Losses can exceed deposits.
Please be advised that the information presented on TradingView is provided to Tradu (‘Company’, ‘we’) by a third-party provider (‘TFA Global Pte Ltd’). Please be reminded that you are solely responsible for the trading decisions on your account. There is a very high degree of risk involved in trading. Any information and/or content is intended entirely for research, educational and informational purposes only and does not constitute investment or consultation advice or investment strategy. The information is not tailored to the investment needs of any specific person and therefore does not involve a consideration of any of the investment objectives, financial situation or needs of any viewer that may receive it. Kindly also note that past performance is not a reliable indicator of future results. Actual results may differ materially from those anticipated in forward-looking or past performance statements. We assume no liability as to the accuracy or completeness of any of the information and/or content provided herein and the Company cannot be held responsible for any omission, mistake nor for any loss or damage including without limitation to any loss of profit which may arise from reliance on any information supplied by TFA Global Pte Ltd.
The speaker(s) is neither an employee, agent nor representative of Tradu and is therefore acting independently. The opinions given are their own, constitute general market commentary, and do not constitute the opinion or advice of Tradu or any form of personal or investment advice. Tradu neither endorses nor guarantees offerings of third-party speakers, nor is Tradu responsible for the content, veracity or opinions of third-party speakers, presenters or participants.

Bitcoin & new rallyBitcoin surpassed its previous all-time high of $112,000 and is now approaching $124,700, the third resistance level for July's pivot.

Filecoin FIL price analysis🪙 It would seem that #Filecoin is a “dinosaur” of the crypto market, having survived so many different cycles and “shocks,” whose fundamentals should only increase the annual application of the project, but no... it's not happening...
Looking at the OKX:FILUSDT chart, we see that the accumulation phase in the $2-11.50 range has been going on for over 1150 days, which means that another +/- 30-60 days of correction will not make a significant difference.
What can we say: we wish the holders patience and hope they wait for their moment of glory together with #FIL
🙂 And for those who want to test their luck and try to jump on the “last train” — place a “bucket” at $1.80 (any lower than that would be indecent)
Of course, if you believe that the price of #FILUSD will still be able to grow to at least $4.50 this year, and ideally to $11.50.
_____________________
Did you like our analysis? Leave a comment, like, and follow to get more

ZRX Just Broke Out… But Is It a Bull Trap Before a Collapse?Yello Paradisers did you catch that breakout from the falling wedge, or are you about to get faked out like the rest?
💎#ZRX/USDT has finally broken out of its descending resistance after weeks of compression. While this is a promising signal, this move alone is not enough. What really matters now is how price behaves on the retest. We're watching closely for a pullback either into the previous wedge resistance or directly into the key demand zone between $0.205 and $0.215. That area needs to hold if the bulls want to keep momentum on their side.
💎The structure remains valid as long as we stay above the $0.180 level. A break below that zone would completely invalidate this bullish setup and open the door to a deeper drop. On the upside, if buyers step in with volume, the path toward $0.260 and possibly $0.300 becomes much more realistic.
💎This is not the moment to chase. Let retail traders jump in too early our job is to position smartly, not emotionally. Watch the retest, measure the reaction, and act only when the market confirms.
This is where most retail traders get trapped, they chase the move too late or panic-sell too early. Don’t be that trader. Stay focused. Be precise.
MyCryptoParadise
iFeel the success🌴

GOLD continues to recover, tariff war changes unpredictablyInternational OANDA:XAUUSD continued to rise, boosted by a slight decline in the US Dollar and US Treasury yields. At the same time, investors are closely monitoring the developments in trade negotiations as US President Trump expands the tariff war.
As of the time of writing, spot OANDA:XAUUSD increased by 0.3% to 3,333 USD/oz. The general weakness of the US Dollar, the decline in US Treasury yields and renewed concerns about the escalation of the trade war have helped stabilize gold prices.
On Thursday evening (July 10) local time, US President Donald Trump once again increased pressure on trading partners. He announced that he would impose a 35% tariff on imported goods from Canada, and the USD/CAD exchange rate rose sharply in the short term.
Trump posted on his social media platform Truth Social that a 35% tariff would be imposed on imported goods from Canada, effective from August 1, 2025.
It is still unclear whether the current exemptions for goods traded under the United States-Mexico-Canada Agreement (USMCA) will be extended or terminated.
Due to the impact of escalating trade tensions, spot gold prices also rose by more than 10 dollars in the short term at the beginning of the Asian trading session on Friday, and the current high price of gold has reached around 3,336 USD/ounce.
In an interview with NBC News on Thursday, Trump said he was also considering imposing a flat tariff of 15% to 20% on most of his trading partners, adding that the exact tariff rate was being worked out. The current flat tariff rate is 10%.
Trump sent letters to trading partners this week, announcing that the new tariffs would take effect on August 1 if they could not negotiate more favorable terms. He is expected to send letters to European Union member states soon.
Trump sent the first batch of tariff letters to 14 countries, including Japan and South Korea, on July 7, with tariffs ranging from 25% to 40%. He also said he would send more similar letters this week.
Minutes from the Fed's June 17-18 meeting showed that only a "few" Fed officials thought a rate cut was possible as early as this month, while most preferred to hold off until later in the year due to inflation concerns caused by Trump's tariffs.
The Federal Open Market Committee (FOMC) voted unanimously to leave interest rates unchanged at its June meeting. The next policy meeting is scheduled for July 29-30.
Markets will focus on progress in Trump's tariff negotiations, key US economic data and speeches by Federal Reserve officials later in the day for fresh trading direction for gold prices.
Technical Outlook Analysis OANDA:XAUUSD
Gold has had 2 sessions of recovery from the area around the 0.382% Fibonacci retracement, but the temporary upside momentum is still limited and does not qualify for a new bullish cycle.
In the short term, the EMA21 with the 0.236% Fibonacci retracement will act as the nearest resistance, if gold takes the price action to break above the 0.236% Fibonacci retracement level it will qualify for a new bullish cycle with the target then being around $3,400 in the short term, more so than $3,430.
On the other hand, with the current neutral trend, once gold is sold below the 0.382% Fibonacci retracement level again, it will have conditions to decline, and the target then is around 3,246 USD in the short term, more than the 0.50% Fibonacci retracement level.
The RSI index is hovering around 50, also showing that the market sentiment is still hesitant to have a specific direction.
During the day, the sideways trend of gold prices will be noticed by the following positions.
Support: 3,300 - 3,292 USD
Resistance: 3,340 - 3,350 - 3,371 USD
SELL XAUUSD PRICE 3388 - 3386⚡️
↠↠ Stop Loss 3392
→Take Profit 1 3380
↨
→Take Profit 2 3372
BUY XAUUSD PRICE 3296 - 3298⚡️
↠↠ Stop Loss 3292
→Take Profit 1 3304
↨
→Take Profit 2 3310

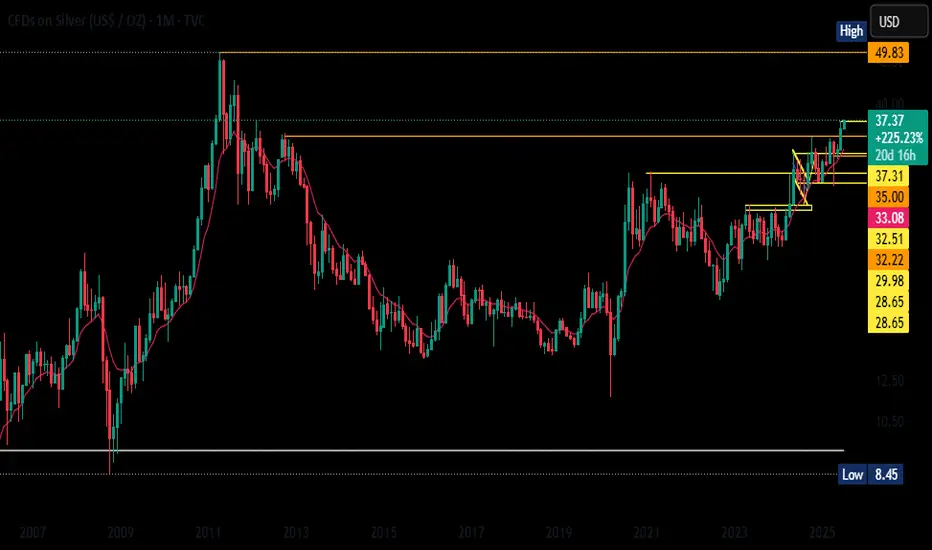
Final call before take offLook at the monthly chart of Silver (CFDs in USD/OZ), the longterm trend is clearly bullish. After spending over a decade consolidating below the $30–35 zone, The breakout above this historical resistance is significant and shows strong momentum, especially with price holding well above the 10-month EMA. We’re currently testing the $37.31 level, and if that gets taken out cleanly, the next major target is the all-time high at $49.83 from 2011. The recent structure even resembles a cup-and-handle or ascending triangle pattern, adding more weight to the bullish case. Support zones are now layered at $35, $33.06, and $32.51—key levels that were previous resistances. If there's any dip back to those zones, it may offer a solid buy-on-dips opportunity. As long as Silver holds above $35 on the monthly chart, I stay bullish with eyes on a move toward the $49.83 zone.
M/USDT Trade SetupM/USDT is a newly launched coin, and it looks good to hold this token for a short-term trade.
~ Long M/USDT at CMP.
~ Stop Loss: $0.1928.
~ Leverage: 5x-10x.
~ Target: $0.24.
Note: Always do your own research and analysis before investing.
Regards,
Team Dexter.

Falling towards 50% Fibonacci support?DAX40 (DE40) is falling towards the pivot and could bounce to the pullback resistance.
Pivot: 24,122.25
1st Support: 23,935.80
1st Resistance: 24,622.91
Risk Warning:
Trading Forex and CFDs carries a high level of risk to your capital and you should only trade with money you can afford to lose. Trading Forex and CFDs may not be suitable for all investors, so please ensure that you fully understand the risks involved and seek independent advice if necessary.
Disclaimer:
The above opinions given constitute general market commentary, and do not constitute the opinion or advice of IC Markets or any form of personal or investment advice.
Any opinions, news, research, analyses, prices, other information, or links to third-party sites contained on this website are provided on an "as-is" basis, are intended only to be informative, is not an advice nor a recommendation, nor research, or a record of our trading prices, or an offer of, or solicitation for a transaction in any financial instrument and thus should not be treated as such. The information provided does not involve any specific investment objectives, financial situation and needs of any specific person who may receive it. Please be aware, that past performance is not a reliable indicator of future performance and/or results. Past Performance or Forward-looking scenarios based upon the reasonable beliefs of the third-party provider are not a guarantee of future performance. Actual results may differ materially from those anticipated in forward-looking or past performance statements. IC Markets makes no representation or warranty and assumes no liability as to the accuracy or completeness of the information provided, nor any loss arising from any investment based on a recommendation, forecast or any information supplied by any third-party.

Bullish bounce>WTI Oil (XTI/USD) is falling towards the pivot which acts as a pullback support and could bounce to the 1st resistance.
Pivot: 65.65
1st Support: 63.74
1st Resistance: 68.24
Risk Warning:
Trading Forex and CFDs carries a high level of risk to your capital and you should only trade with money you can afford to lose. Trading Forex and CFDs may not be suitable for all investors, so please ensure that you fully understand the risks involved and seek independent advice if necessary.
Disclaimer:
The above opinions given constitute general market commentary, and do not constitute the opinion or advice of IC Markets or any form of personal or investment advice.
Any opinions, news, research, analyses, prices, other information, or links to third-party sites contained on this website are provided on an "as-is" basis, are intended only to be informative, is not an advice nor a recommendation, nor research, or a record of our trading prices, or an offer of, or solicitation for a transaction in any financial instrument and thus should not be treated as such. The information provided does not involve any specific investment objectives, financial situation and needs of any specific person who may receive it. Please be aware, that past performance is not a reliable indicator of future performance and/or results. Past Performance or Forward-looking scenarios based upon the reasonable beliefs of the third-party provider are not a guarantee of future performance. Actual results may differ materially from those anticipated in forward-looking or past performance statements. IC Markets makes no representation or warranty and assumes no liability as to the accuracy or completeness of the information provided, nor any loss arising from any investment based on a recommendation, forecast or any information supplied by any third-party.

NIFTY 1. Rectangle Box (Sideways Zone)
Nifty had earlier made a strong range-bound consolidation around 24,400 -25,000.
This has now become a strong support zone (red shaded area).
2. Breakout & Retest Pattern:
Nifty then broke out of this zone and went to around 25,600.
Now it is retesting the same old resistance (now support).
3. Price Action Zones:
Support Zone: 24,950 25,100
Resistance Zone: 25,600 - 25,800
If you find this helpful and want more FREE forecasts in TradingView, Hit the 'BOOST' button
Drop some feedback in the comments below! (e.g., What did you find most useful?
How can we improve?)
Your support is appreciated!
Now, it's your turn!
Be sure to leave a comment; let us know how you see this opportunity and forecast.
Have a successful week
DISCLAIMER: I am NOT a SEBI registered advisor or a financial adviser. All the views are for educational purpose only

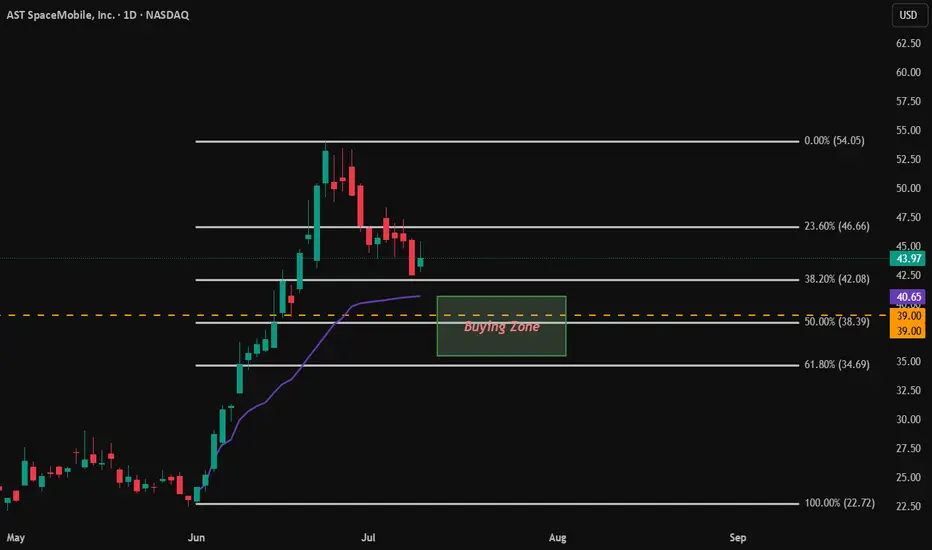
$ASTS Buying the dip. [Long]
Previous bull runs with 50.0% - 61.8% retracements each time.
Stock is still overvalued.
RSI on weekly and monthly confirm this.
50 SMA is still above 200 SMA, and better retracement will be healthy for a stronger bull run continuation.
Buying Zone: $35.50 - $40.65.
Key Levels and points of interest.
Wave 2 completion at 50%-61.8% retracement. This would place Wave 3 around a target range of $85 or higher.
$55-$57 range is around 45% increase from Wave 2 retracement. This happened during the second run and form a H&S pattern. We want our next run up to pass this $55-57 level.
This isn't intended for financial advice, merely personal analysis.
EURUSD I Daily CLS I Model 1 I KL FVG I Target 50%Yo Market Warriors ⚔️
Fresh outlook drop — if you’ve been riding with me, you already know:
🎯My system is 100% mechanical. No emotions. No trend lines. No subjective guessing. Just precision, structure, and sniper entries.
🧠 What’s CLS?
It’s the real smart money. The invisible hand behind $7T/day — banks, algos, central players.
📍Model 1:
HTF bias based on the daily and weekly candles closes,
Wait for CLS candle to be created and manipulated. Switch to correct LTF and spot CIOD. Enter and target 50% of the CLS candle.
For high probability include Dealing Ranges, Weekly Profiles and CLS Timing.
Trading is like a sport. If you consistently practice you can learn it.
“Adapt what is useful. Reject whats useless and add whats is specifically yours.”
David Perk aka Dave FX Hunter
💬 Don't hesitate to ask any questions or share your opinions

CAKE : Are we left behind?Hello friends🙌
😉We came with a good currency analysis from the decentralized exchange Pancake Swap.
So you see that we have a good price support that buyers supported the price well after each collision.
🔊Now, considering the collision with this support, we can expect growth to the specified areas. Of course, don't forget that capital management and risk are the priority of trading.
🔥Follow us for more signals🔥
*Trade safely with us*
