NZDUSD Potential UpsidesHey Traders, in today's trading session we are monitoring NZDUSD for a buying opportunity around 0.60350 zone, NZDUSD is trading in an uptrend and currently is in a correction phase in which it is approaching the trend at 0.60350 support and resistance area.
Trade safe, Joe.
Community ideas

Tesla - There's more after the +60% rally!Tesla - NASDAQ:TSLA - will blow even further:
(click chart above to see the in depth analysis👆🏻)
It is almost incredible to see such a large cap stock rally more than +60% in less than two months. But Tesla is clearly the exception and therefore we should expect the unexpected. What's quite likely is at least another rally of about 25% from here and a retest of the previous all time high.
Levels to watch: $250, $400
Keep your long term vision!
Philip (BasicTrading)

GBPNZD Ready to Flip? Key Reversal Zone in Play🔹 1. Price Action and Technical Structure
Price is currently at 2.2405, declining from the recent high in the 2.26–2.28 area.
The pair completed a descending channel with potential for reversal. A bullish reaction is taking place from the 2.2280–2.2170 demand zone, supported by previous volume spikes.
The RSI is falling, nearing oversold territory but not yet at extreme levels.
Possible technical scenarios:
Bullish: Recovery toward 2.2560–2.2600, with a potential breakout above recent highs.
Bearish: A break below 2.2170 could trigger further downside toward 2.2000 and 2.1800.
🔹 2. Seasonality (June)
NZD
June tends to be slightly positive for NZD (average: +0.0011 over 20 years), with consistent monthly patterns.
GBP
June is historically neutral to negative for GBP (average: +0.0015 over 20 years, but negative over 5 and 2 years).
➡️ This implies a seasonal edge for NZD over GBP.
🔹 3. Retail Sentiment
60% of retail traders are long on GBPNZD.
40% are short, but long positions average 2.1874, currently in profit.
➡️ This presents a mild contrarian bearish pressure, due to crowding on the long side.
🔹 4. Commitment of Traders (COT) – Institutional Positioning
GBP (as of 2025-06-03)
Commercials Net Long: +74.5K
Non-Commercials Net Short: -11.3K
Weekly changes: +30.3K longs vs. +32.6K shorts
➡️ Moderate balance, but growing speculative short interest.
NZD (as of 2025-06-03)
Non-Commercials Net Short: -23.6K
Strong weekly increase in commercial longs (+6.4K) and total long flows
➡️ NZD is seeing renewed interest from commercial players — a potential bullish signal.
🔹 5. Trading Outlook
📌 Current Bias: Neutral with short-term bearish tilt, but medium-term bullish reversal risk rising.
➤ Potential setups:
Conservative Long Entry: On bullish confirmation at 2.2170 (double bottom or bullish engulfing), target 2.2560–2.2600
Aggressive Short Entry: On pullback to 2.2490–2.2560, with stop above 2.2620, target 2.2280–2.2170
🎯 Seasonal and institutional factors favor NZD strength, but technical structure calls for caution and confirmation.

keep an eye on 144.80 !boost and follow for more!💖
NVDA is hitting my bullish targets a mentioned in my last update from early April🎯, now watching my final short term price target of 144.80, if this can break and hold this week then a rally to new ATH/175-200 should follow.
if we reject here then a dip to 124-132 should come before the upside continues.

BITCOIN The beauty of structured patterns. $150k is next.Bitcoin (BTCUSD) has invalidated all bias calling for a deeper pull-back after May's new All Time High (ATH), as yesterday it broke above the previous ATH Resistance, invalidating the short-term Head and Shoulders pattern, while rebounding last week exactly on the dashed Lower Highs trend-line, confirming it as a Support level.
Within BTC's 3 year Channel Up pattern, we have seen this price action structure another 3 times. The minimum rise on such pattern has been +101% and that wasn't even a Lower Highs rebound. The other two that were exactly like the current formation, increased by a lot more.
As a result, we expect Bitcoin to complete a minimum +101% rise from the April 07 bottom, which translates to a clean $150000 Target.
Do you think the structure ill continue to hold up to $150k and possibly beyond? Feel free to let us know in the comments section below!
-------------------------------------------------------------------------------
** Please LIKE 👍, FOLLOW ✅, SHARE 🙌 and COMMENT ✍ if you enjoy this idea! Also share your ideas and charts in the comments section below! This is best way to keep it relevant, support us, keep the content here free and allow the idea to reach as many people as possible. **
-------------------------------------------------------------------------------
💸💸💸💸💸💸
👇 👇 👇 👇 👇 👇

Selling pressure, bears active⭐️GOLDEN INFORMATION:
Gold prices (XAU/USD) edge higher toward $3,325 during the early Asian session on Tuesday, supported by a softer US Dollar as markets turn cautious ahead of key developments in US-China trade negotiations.
Delegations from the United States and China are set to continue discussions for a second consecutive day in London. President Donald Trump expressed optimism, stating the talks “should go very well.” According to US officials, discussions may lead to Washington lifting certain tech export restrictions in exchange for Beijing easing controls on rare earth exports — materials vital to sectors ranging from energy and defense to advanced technology. The outcome of these negotiations could provide fresh direction for the precious metal.
⭐️Personal comments NOVA:
The market is mainly sideways and accumulating, under selling pressure below 3300 due to the US-China trade negotiations taking place today.
⭐️SET UP GOLD PRICE:
🔥SELL GOLD zone : 3350- 3352 SL 3357
TP1: $3340
TP2: $3330
TP3: $3320
🔥BUY GOLD zone: $3276- $3274 SL $3269
TP1: $3285
TP2: $3300
TP3: $3312
⭐️Technical analysis:
Based on technical indicators EMA 34, EMA89 and support resistance areas to set up a reasonable sell order.
⭐️NOTE:
Note: Nova wishes traders to manage their capital well
- take the number of lots that match your capital
- Takeprofit equal to 4-6% of capital account
- Stoplose equal to 2-3% of capital account
EURUSD: Breakout and Potential RetraceHey Traders, in today's trading session we are monitoring EURUSD for a selling opportunity around 1.14200 zone, EURUSD was trading in an uptrend and successfully managed to break it out. Currently is in a correction phase in which it is approaching the retrace area at 1.14200 support and resistance zone.
Trade safe, Joe.

covered call on COINCryptos are pumping.. Trend is bullish. Moving averages, gaps, volume, everything looks like this should eventually resolve higher.

USD/JPY – Short-term bullish structure within a larger downtrendThe USD/JPY pair has been in a well-established downtrend on the daily timeframe, showing consistent weakness over recent weeks.
Daily timeframe
The pair recently bounced from a significant and well-respected support zone around the $140.00 level. This area has historically provided a strong base for price, and once again, it appears to be holding as reliable support. Although the overall daily trend remains bearish, this bounce introduces the potential for a short-term retracement or consolidation phase.
Clear Rising Trendline on the 4H Chart
Zooming into the 4-hour timeframe, the price action shows a notable shift in momentum. A clear rising trendline has formed, acting as a dynamic support level and guiding the pair higher in the short term. As long as this trendline remains intact and unbroken, the bullish bias on the 4H remains valid. This upward move suggests a corrective phase within the broader daily downtrend, supported by increasing demand at higher lows.
Approaching Key Resistance — FVG and 0.786 Fibonacci Level
The pair is currently approaching a key resistance area near the $145.50 level. This zone aligns with the 4-hour Fair Value Gap (FVG) left by the previous strong downward move and coincides with the 0.786 Fibonacci retracement level, measured from the most recent swing high to swing low. A few days ago, price action briefly tested the lower boundary of this FVG but failed to fully fill the imbalance. Given the current momentum, another attempt to fill the entire FVG and test the 0.786 Fibonacci level is likely. This confluence of technical factors creates a strong resistance zone that could trigger significant price reactions, potentially resuming the broader downtrend.
Target Levels — Where to Look for Reversal or Profit-Taking
A sensible short-term target would be the previous lower high around the $144.00 level. This zone may serve as an initial resistance or take-profit area before price challenges the $145.50 resistance region. Additionally, if the pair breaks below the rising trendline on the 4H, this $144.00 zone could become a support level from which the pair might attempt another move higher.
Conclusion
To summarize, the USD/JPY pair remains in a broader daily downtrend but has shown signs of short-term strength after bouncing from the $140.00 support zone. On the 4-hour timeframe, bullish momentum is evident, supported by a rising trendline and upward movement toward a significant resistance area. Traders should closely watch the $145.50 zone, as it represents a confluence of the FVG and 0.786 Fibonacci retracement — both of which could act as a strong ceiling for price. Until the rising trendline breaks, the short-term outlook remains cautiously bullish, but the medium-term bias leans bearish if resistance holds and selling pressure resumes.
Disclosure: I am part of Trade Nation's Influencer program and receive a monthly fee for using their TradingView charts in my analysis.
Thanks for your support.
- Make sure to follow me so you don't miss out on the next analysis!
- Drop a like and leave a comment!

Chainlink (LINK): Looking For Target of 200EMA (Daily)Chainlink has done very well, and we have also opened one long position near the breakout area at $14. Now we are looking for the price to have a proper retest after what we expect to see some downward movement so eyes on the daily 200EMA line for now!
Swallow Academy

THE KOG REPORT - UpdateEnd of day update from us here at KOG:
A good start to the week with the lower level holding as expected and giving us the tap and bounce for the longs which we wanted to target the 3330-35 level on. This is now completed and if preference is for higher, there is a higher hotspot which could be a possibility.
For the above reason, although we may get a RIP from around here it's on the flip with support now 3320, so the higher level is possible in the early session before a retracement which will be level to level for now, unless there is a clean reversal. If we hold that 3320-15 level it's very likely they will want to take this higher!
KOG’s bias of the week:
Bearish below 3336 with targets below 3306✅, 3299✅, 3297✅, 3285 and 3275
Bullish on break of 3336 with targets above 3345, 3350, 3355, 3367 and 3376
Red boxes:
Break above 3310 for 3320, 3332, if held above 3335, 3347 and 3362 in extension of the move
Break below 3306 for 3299✅, 3295✅, 3285, 3280 and 3264 in extension of the move
As always, trade safe.
KOG

ETH update 9.06.2025Hello everyone, many of you asked me to publish my vision for ETH.
Here you go!
I believe that the previous impulse movement was only the first upward movement, and now we are in a sideways correction movement — call it what you will, but the fact is that the exit from this flat will be upward.
1. End of the year
2. ETH is accumulating on the Onchain
3. Liquidity overflow from BTC can be seen on the ETHBTC chart, and the overflow began at the very bottom
4. What else can large conservative players accumulate?
5. We are going after liquidity from above and should break 4100 by September
Best Regards EXCAVO

XAU/USD.1h chart pattern.
📈 Trade Setup (Long Position on Gold)
Entry: 3320
Target 1: 3370 (💰 +50 points)
Target 2: 3400 (💰 +80 points)
Stop-Loss (suggested): You haven’t specified, but a technical stop-loss around 3290–3300 could be prudent, depending on volatility and timeframe.
Risk-Reward Ratio:
Target 1: 1:2 (assuming 25-point SL)
Target 2: 1:3.2 (approx.)
🧠 Key Considerations
Technicals: Check if 3320 is near a support zone. A bounce from support strengthens the setup.
Fundamentals: Watch for:
Fed announcements
US Dollar Index (DXY)
Inflation data (CPI, PPI)
Geopolitical risks (which can spike gold)
Would you like:
A chart analysis?
An updated gold price?
Risk/reward calculation for your capital?
Let me know how I can assist further.

Do you have a pet at home ?For as long as I remembered, when I was a kid, we were always catching little chicks from the village and keep as pets. Later, I had tortoise, a white parrot, a myna , some other birds kept by my late dad, angel fish etc. All these cramped in a tiny 1 room flat !
Fast forward 5 decades later, we are seeing a resurgence of furry pets entering into modern human lives more and more. From Korea to China to Jarkarta, we see a growing trend of young couples getting married but not wanting to have kids. Instead, they opt for pets and this can range from furry ones like bunnies, hamsters, guinea pigs, cats and dogs to exotic ones like reptiles and some even keep ants. Times have changed.......
These furry kids are now replacing human kids and I am of the opinion it will proliferate more and more as we witness the emergence of pet friendly cafes, parks for dogs, accessories sold online and in pet shops. The downside we are also seeing is abandonment by some of these paw parents who could not handle the stress of upkeeping these pets .
Before, it was all canned food but now they are going for fresh foods even curated by some chefs. Wouldn't you want to be reincarnated as a cute doggie in your next life ?
I first spotted this company i n late 2024 and nibbled some shares.
Fast forward 6-7 months later, I am so lucky to be blessed with more than 200% returns on my investment. Mind you , this is not even a tech companies with AI patents .........
Read this latest article here and you would be convinced how deep the penetration these pets have on human. Of course, the more they spend , the higher prices these companies will be.
What's next ?

NASDAQ Potential UpsidesHey Traders, in today's trading session we are monitoring NAS100 for a buying opportunity around 21,700 zone, NASDAQ is trading in an uptrend and currently is in a correction phase in which it is approaching the trend at 21,700 support and resistance area.
Trade safe, Joe.

XAUUSD SNIPER PLAN – TUESDAY, JUNE 10, 2025👋 Good evening traders!
After a choppy NY that faked both directions, Monday closed with gold stuck around 3325. But don’t be fooled — the real plays are coming Tuesday as we align with clean structure, trap logic, and real macro catalysts. Focus only on what matters.
Let’s prep with clarity and intent. 🎯
🌍 TUESDAY MACRO PREVIEW (JUNE 10)
📊 12:00pm – NFIB Small Business Index
🗣️ 10:00pm – President Trump speaks (market-moving risk)
🛢️ 10:30pm – API Weekly Oil Data (impacts USD sentiment)
No CPI or FOMC yet — but volatility is brewing. Trump + late-day oil stats = prime conditions for NY tricks or late-session moves.
🧠 TECHNICAL STRUCTURE
🔹 Last impulse: 3292 → 3338
🔹 Price now: 3325
🔹 Asia swept 3293 — partial gap fill
🔹 NY faked above 3338 → rejected → no follow-through
🔹 HTF still bullish but in pullback mode
📏 Fibonacci (3292–3338)
– 50% = 3315
– 61.8% = 3310
– 78.6% = 3303
📊 EMAs: 5/21 kissing → possible expansion
📉 RSI: Mid-range → clear room to move
🔐 STRUCTURE ZONES – CLEAN & ACTIVE
Price Zone Type Logic
3345–3354 SELL ZONE 1 HTF FVG + inducement trap
3362–3368 SELL ZONE 2 OB + liquidity clear above final highs
3329–3332 FLIP ZONE NY trap → could flip support or reject
3307–3310 BUY ZONE 1 61.8% + CHoCH potential + OB
3292–3296 BUY ZONE 2 Asia low + FVG + discount sweep
🎯 PLAN OF ATTACK
✅ Bullish Plan
– Hold above 3315–3320
– Break 3338 → retrace into 3310/3307 = sniper long
🎯 TP: 3354 → 3368
❌ Bearish Plan
– Fail under 3332 → tap 3345–3354 for reaction
– Rejection = sell into 3310–3296
🎯 TP: 3310 → 3292
⚠️ 3329–3332 = reaction zone only
Do not sell blindly — wait for confirmation.
👀 EYES ON:
– 3338 = intraday BOS point
– 3307 = sniper trigger if CHoCH
– Trump speech = high spike risk
– NY tends to reverse early Asia setups
🚀 FINAL WORD
We’re not here to chase noise — we’re here to execute with structure.
You’ve got two clean sells, two sniper buys, and real macro risk on the table.
No guesswork. Just precision.
💬 What’s your plan for Tuesday?
Do you see the 3362 trap playing out?
Are you waiting for the 3307 sniper?
👇 Drop your scenario in the comments — let’s compare setups and grow together.
📲 Follow @GoldFxMinds for daily sniper clarity
🎯 Let’s dominate CPI week. Together.
💬 Drop a 🚀 if you’re locked in for NY
🔥 Let’s make Tuesday count — clean, confident, and calculated.

BTC Macro Cycle Outlook (Log Chart)Bitcoin continues to respect its logarithmic ascending channel that has defined every major bull and bear cycle since 2015. Each cycle top has historically aligned with the upper blue trendline, marked by sharp rejections (red arrows 🔴).
Currently, BTC is pushing within a steep short-term channel, mirroring previous parabolic phases. If the structure holds, we could see a final push toward the $300,000 zone, which aligns with the channel resistance — potentially marking the next cycle top.
📈 This chart captures the bigger picture — filtering out short-term noise and focusing on the rhythm of Bitcoin’s long-term cycles.
Do you think this cycle will end like the last two? Or are we in for something different?
All Strategies Are Good; If Managed Properly!
~Richard Nasr

ETHUSD next move ETHUSD – 4H Chart Analysis
Structure: Downward Parallel Channel
Market Behavior: Price is respecting both support and resistance levels within the channel
Current Position: Price is testing the upper boundary / resistance zone
📉 Sell Bias – Potential rejection from resistance zone
Entry: 2559
Stop Loss: 2614
Target: 2379

USDCAD Hits Support as Fed-Hawkish & BoC Cuts! Big Bounce ComingUSDCAD ( OANDA:USDCAD ) is trading at the Potential Reversal Zone(PRZ) and near the important Support line and Support lines .
In terms of Elliott Wave theory , it seems that USDCAD has managed to complete 5 main down waves and we can expect more up waves .
Also, we can see the Regular Divergence(RD+) between Consecutive Valleys .
I expect USDCAD to rise to at least 1.37860 CAD.
Fundamental View:
The Bank of Canada initiated its rate-cutting cycle , while the Federal Reserve remains firm with no immediate plans to ease.
Strong NFP data on Friday reinforced USD ( TVC:DXY ) strength .
Oil prices( BLACKBULL:BRENT ) may offer temporary support to CAD , but macro divergences clearly favor the dollar .
Note: Stop Loss(SL)= 1.36110 CAD
U.S Dollar/Canadian Dollar Analyze (USDCAD), 4-hour time frame.
Be sure to follow the updated ideas.
Do not forget to put a Stop loss for your positions (For every position you want to open).
Please follow your strategy; this is just my idea, and I will gladly see your ideas in this post.
Please do not forget the ✅' like '✅ button 🙏😊 & Share it with your friends; thanks, and Trade safe.

$XRP - Falling Wedge Breakout is CookingRipple is forming a simple yet perfect setup
There is a strong horizontal support level of $2.11 that was established back in December of 2024 and has held the price perfectly (with only one breakdown) since then. Moreover, at that time a massive Falling Wedge started forming and is still doing it up to this day.
Talking about resistances, there is a $2.45 one. Not very strong, but solid enough to form a decent horizontal channel within which the price moves.
So, as the result we have the following structure: CRYPTOCAP:XRP has been consolidating above strong support for 6 months already and formed a pattern that suggest upcoming upward movement. The perfect entry spot in LONG will be at the breakout&retest of the both $2.45 resistance and Falling Wedge resistance (they perfectly correlate) .
Target zone of $3.5 - $4 can be reached within the next 3 - 5 months.

XRP: Bullish Breakout -> Short-Term Pullback Before Bigger GainsXRP: Bullish Breakout -> Short-Term Pullback Before Bigger Gains
Market Overview
XRP has broken out from a larger bullish pattern, signaling the end of its accumulation phase. However, with the market’s attention currently on the U.S.–China trade deal and the Trump–Musk developments, short-term uncertainty could push XRP lower, possibly toward 2.1700.
Bigger Picture Outlook
Despite potential near-term volatility, XRP's broader bullish structure remains intact, indicating a strong upside potential in the coming days or weeks.
Targets:
🎯 2.4000 🎯 2.6000 🎯 2.8000
You may find more details in the chart!
Thank you and Good Luck!
❤️PS: Please support with a like or comment if you find this analysis useful for your trading day❤️

WC: 29.58 Target: 1800-2400 MOASS: 47k-100K: Week Of 06/09Ok this is my last video on Gamestop
You will see less frequent posts going forward and they will be at the MACRO level and focused almost exclusively on the daily charts
Its been a ride covering this over the past year or so
True to my posting intention (I'm only here to help people trade better) this video is educational in nature
Its not hopium fueled at all...this is me, one last time...TEACHING YOU HOW TO FISH
First half of the video is setting your charts up for the squeeze
Second half of the video is showing you some new stuff around the 20 Week Cycle that you havent seen before
But yeah..no hype...just TA and some rambling..because as my Tagline on my X profile says i'm:
"Just a guy who likes to draw Elliott Waves on stock charts and ramble on about markets."
GOOD TRADING TO YOU ALL...SEE YOU ON THE OTHER SIDE!

Bitcoin Breaks Out: Bullish Momentum Builds Above Key LevelsHello guys!
The chart of Bitcoin reveals a significant bullish breakout, characterized by two key technical developments:
Broken Ascending Channel:
Bitcoin was trading within an ascending parallel channel, gradually making higher highs and higher lows. This channel was recently breached to the downside, suggesting a temporary weakening in momentum.
False Breakdown and Strong Reversal:
Despite the initial breakdown from the channel, Bitcoin swiftly reversed and surged upwards, reclaiming previous support levels with strong bullish candles. This “fake-out” move often traps bears and reinforces bullish sentiment.
Trendline Breakout:
More notably, BTC has broken above a descending trendline, which had acted as a resistance zone. This breakout, backed by strong volume and momentum, indicates a shift in market structure from consolidation to potential expansion.
Projected Upside Target:
Based on the breakout projection drawn on the chart, the next major resistance appears near the $109,600 level. This aligns with the upper purple dashed line, which may represent a historical resistance zone or a Fibonacci extension.

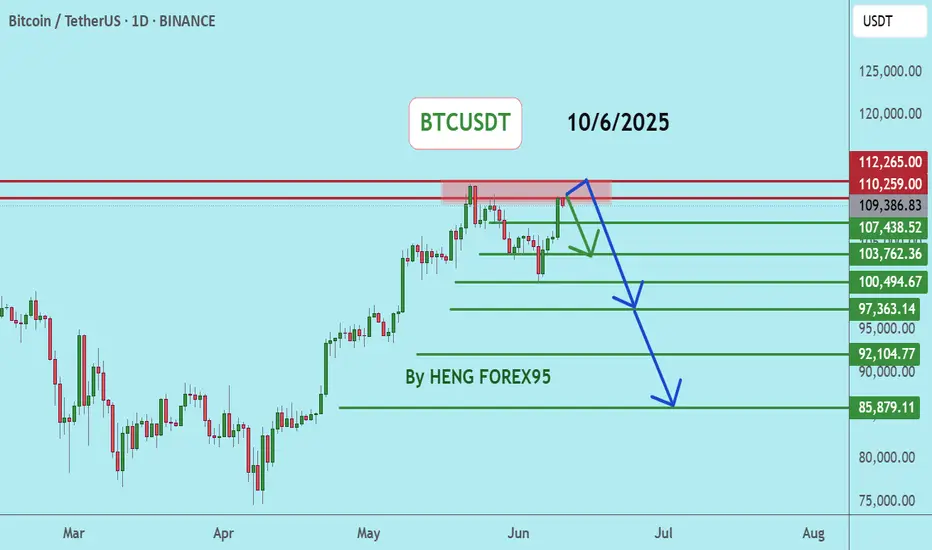
BTCUSDTBTCUSDT price is now near the resistance zone 110259-112265. If the price cannot break through the 112265 level, it is expected that the price will drop. Consider selling the red zone.
🔥Trading futures, forex, CFDs and stocks carries a risk of loss.
Please consider carefully whether such trading is suitable for you.
>>GooD Luck 😊
❤️ Like and subscribe to never miss a new idea!