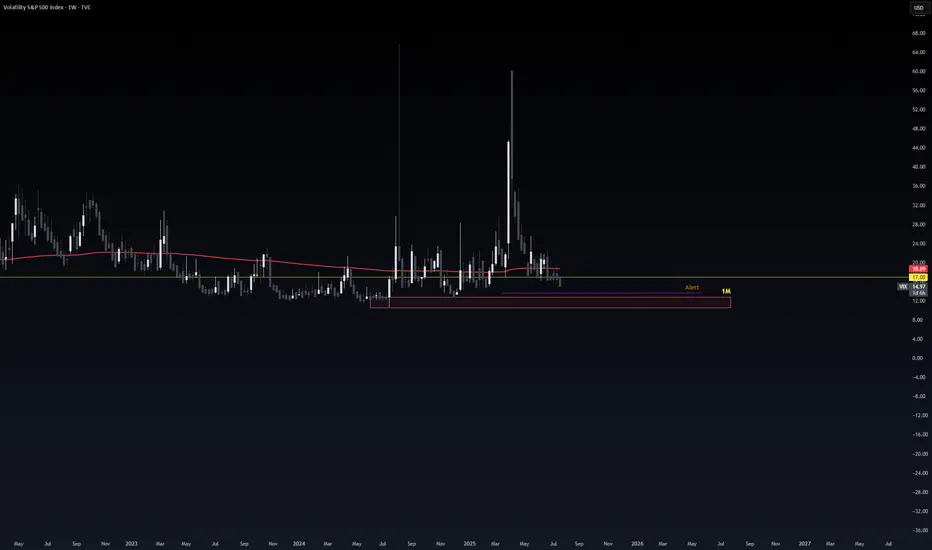
VIX Alarting !when VIX Reach Red Zone.
It consider as Extreeemeee Greeeed !!.
100% market will take U-Turn direction which will be Red in Up coming days !
although im day trading im good and never keep money in market after close.
Community ideas
SELL NZDUSDIn todays session we are actively monitoring NZDUSD for selling opportunity. Our first entry in ASIA session is at 0.60478 we anticipate a short rally up to our second re-entry at 0.60750. Our stops are above 0.6100 and our targets are at 0.59540. Use your own risk management and entry criteria and best of luck.
New algo entry model is under testing.

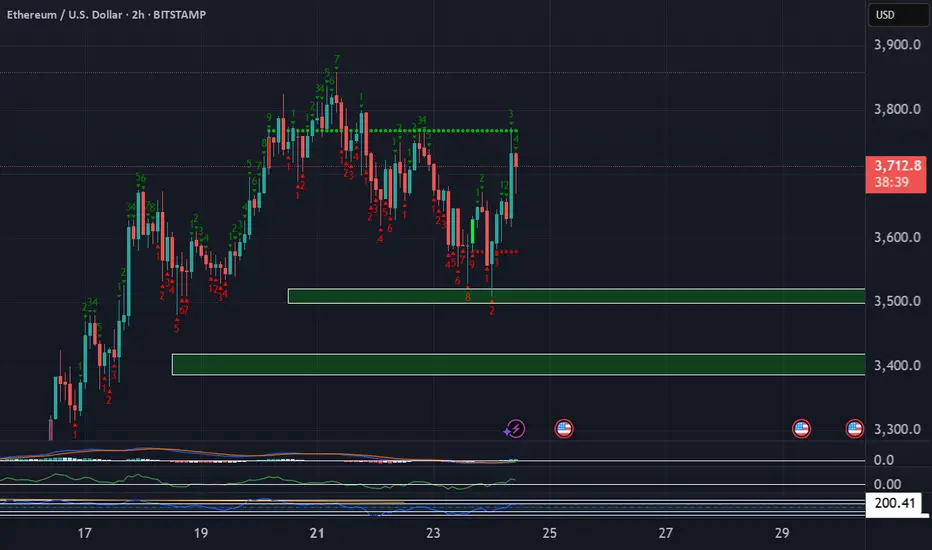
Ethereum Long These zones are significant because they represent areas where large institutions and professional traders are likely to be active, potentially causing strong price movements when those orders are triggered. We want to enter trades that have minimal drawdown to maximize our buying power.
USDCHF sellUSD/CHF is currently in a downtrend, with the US Dollar exhibiting weakness throughout the year. From a technical standpoint, the pair appears poised for further decline, given the formation of a bearish flag. If considering this trade, it's essential to prioritize risk management or look for a potential retest of the flag's resistance level (or the apex of an ascending wedge, if applicable) before entering a short position.

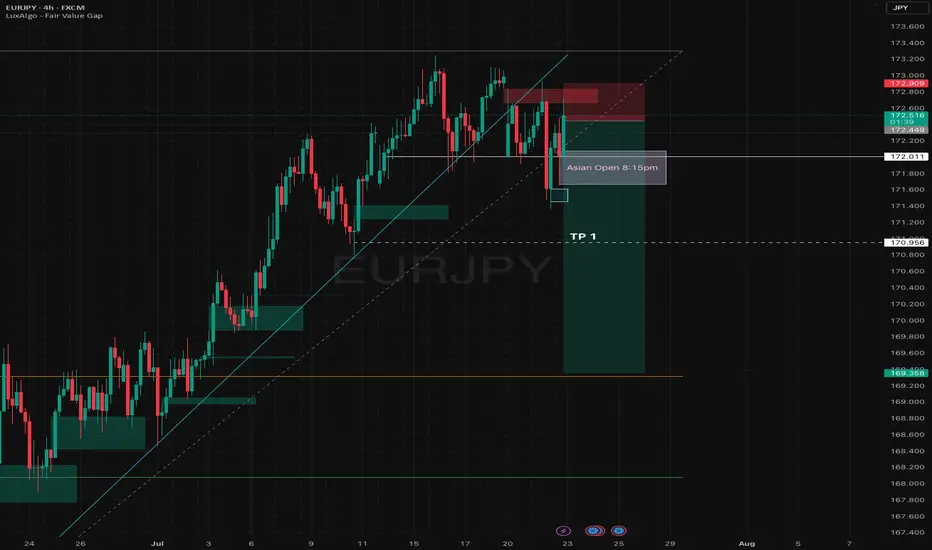
My outlook on EJJust my outlook so I can come back to this trade and see, I broke one rule here, so lets see if it plays out
Rule broken, didnt wait for Trend confirmation from London
Gold technical outlook – Signs of exhaustion at channel topOANDA:XAUUSD is climbing within a well-defined ascending channel, and price is now brushing up against the upper boundary, a dynamic resistance zone that has historically triggered pullbacks. If price gets rejected here, we may see a healthy correction toward the key support at 3,350, offering a potential reload point for bulls.
Should buyers step in and defend this level, the bullish structure remains intact, setting the stage for a renewed push higher. On the other hand, a clean break below 3,350 could open the door for a deeper retracement toward the lower edge of the channel, where more significant demand may lie.
All eyes should be on price action and volume in this regio, watch for reversal patterns like bullish pin bars or engulfing candles to confirm entries. As always, risk management comes first. Don't trade assumptions, trade confirmations.
What’s your take on this setup? Drop your thoughts below and let’s discuss!

EIGENUSDT 1D#EIGEN is pulling back to retest both the broken descending trendline and the daily SMA50, which are converging with a key support zone. So far, this level is showing signs of strength.
📌 We're entering a position here, and will add more near the $1.096 support level if price dips further.
In case of a successful bounce, the upside targets are:
🎯 $1.599
🎯 $1.957
🎯 $2.358
🎯 $2.758
🎯 $3.328
🎯 $4.055
⚠️ As always, use a tight stop-loss and follow proper risk management.

EURUSD Massive Bullish Breakout!
HI,Traders !
#EURUSD is trading in a strong
Uptrend and the price just
Made a massive bullish
Breakout of the falling
Resistance line and the
Breakout is confirmed
So after a potential pullback
We will be expecting a
Further bullish continuation !
Comment and subscribe to help us grow !

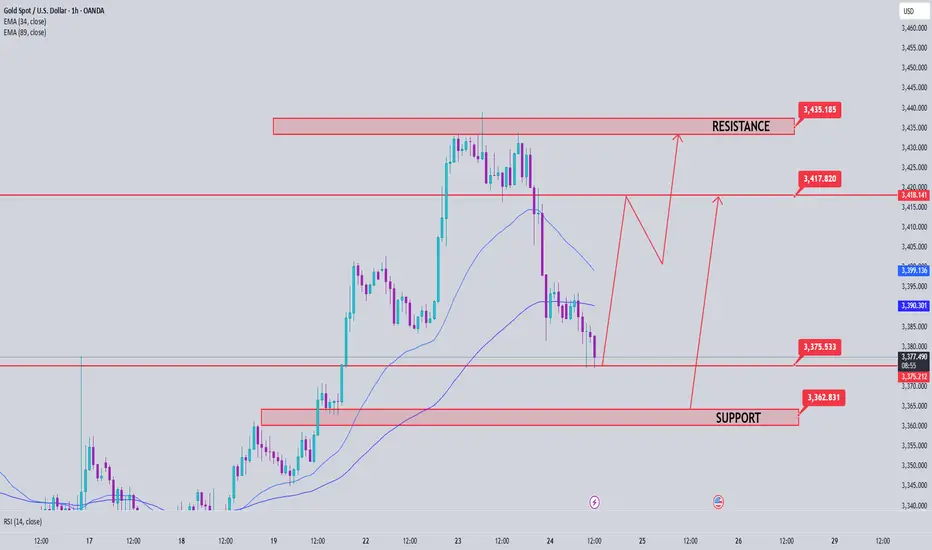
Gold Price Analysis July 24After a correction of about 50 prices in yesterday's session, gold is showing a necessary "breathing" in the long-term uptrend. This is a positive signal, showing that the market is accumulating before continuing its journey towards a new ATH around the 3500 area.
Currently, gold prices are fluctuating within the boundary zone limited by two upper/lower trendlines - creating a clear structure of support and resistance. Avoid trading against the trend if this boundary zone is broken.
📌 Trading plan:
Strategy: Prioritize BUY when price sweeps to support zone
Active buy zone: 3375 (reaction price)
Potential buy zone: 3363 (deep support)
Target: 3431 in the immediate future → further towards 3490
Support: 3375 – 3363
Resistance: 3418 – 3431 – 3490
AUD_USD BULLISH BREAKOUT|LONG|
✅AUD_USD is going up
Now and the pair made a bullish
Breakout of the key horizontal
Level of 0.6590 and the breakout
Is confirmed so we are bullish
Biased and we will be expecting
A further bullish move up
LONG🚀
✅Like and subscribe to never miss a new idea!✅
Disclosure: I am part of Trade Nation's Influencer program and receive a monthly fee for using their TradingView charts in my analysis.

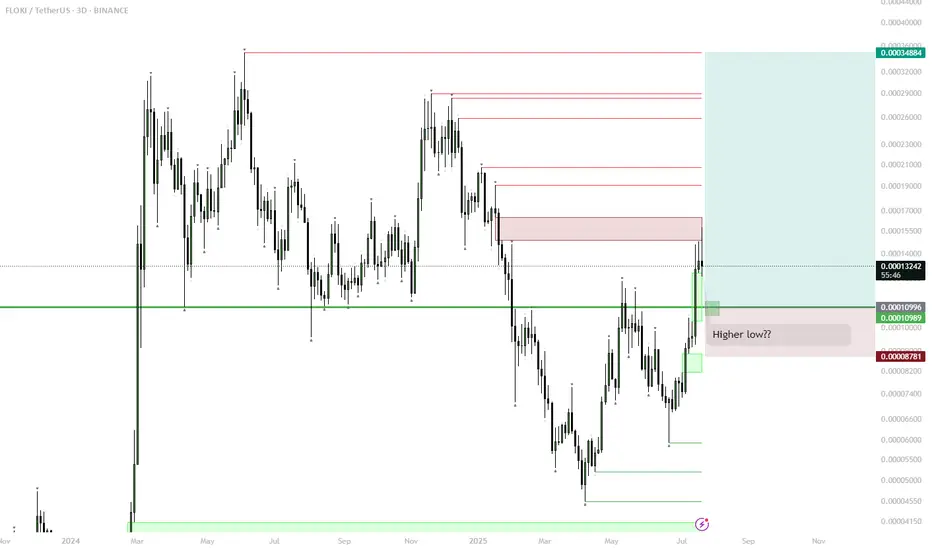
FLOKI – Range Low Setup for Next Big Move? (1D Plan)
FLOKI has reclaimed the key horizontal support, forming a possible higher low.
Currently watching the green box/range low for signs of accumulation (sideways price action) and support confirmation.
If FLOKI establishes a range or shows strength at this zone, look for a long entry with stop below the range.
Upside target is the range high and previous major resistance, offering a potential ~180% move.
Invalidation: clear breakdown and close below the green zone signals failed setup.
FLOKI is showing classic bottoming structure: reclaim of support and formation of a higher low after a prolonged downtrend. Range lows historically have provided major entries for explosive moves. If the green box zone acts as accumulation and price holds, it could set the stage for a rally back to the top of the range as seen before. This setup is favored in meme/altcoin cycles, especially when market sentiment improves. Risk is defined, reward is high.
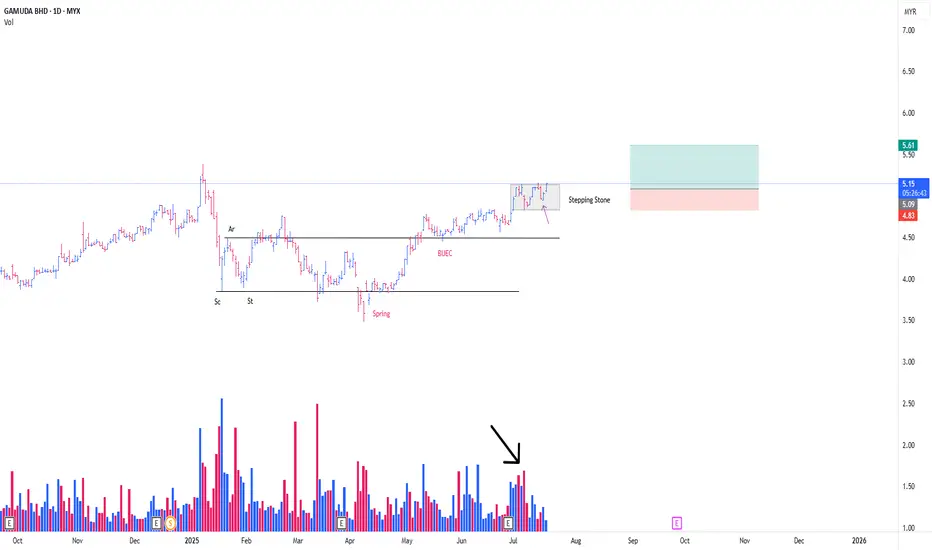
GAMUDA CONT MARKING UP PHASEThis is a continuation from my prev post
**Refer to the link below
This is a play coming from the Stepping Stone (SS)
-SS is a term, in wcykoff methode , particularly describing a momentarily 'pause' in between, consecutive mark up phase.
Absoprtion detected from the on going SS
*Black arrow
with the possibility of Trigger Bar today, in the background of SpringBoard Schematic #2 *Purple arrow
-Position initiated as attached
PureWyckoff
LCTITAN - The LOW is getting HIGHER !LCTITAN - CURRENT PRICE : RM0.470
The stock made a HIGHER LOW recently - this may consider as a half portion of new uptrend is completed. A breakout above RM0.630 will form the higher high structure - which confirm the new uptrend phase.
For short term trading purposes, short term traders may anticipate to buy if the stock breakout nearest resistance of RM0.520 - which will give an entry point at RM0.525. So this is a pending breakout stock. Nearest target will be RM0.580 and RM0.620. Take note that when the price breakout RM0.520 , it will also be above EMA 50 and ICHIMOKU CLOUD - which strengthening the bullish outlook.
ENTRY PRICE : RM0.525
TARGET : RM0.580 and RM0.620
SUPPORT : EMA 50
Notes : The higher low structure of LCTITAN looks like DRBHCOM - I share the link here for reading purposes.

XAUUSD BUY LONG XAUUSD BUY LONG FROM BULLESH OBI
- In Daily TF Market will bullesh
- In H1 TF market is stell fully bullesh
- Market is in Daliy , H4 , H1 , M15 BISI
- In H1 & M15 MSS then our entry in OBI in LTF Valid MSS then our Entry target H1 Nearest Liquidity with Tight SL
tradE anD enjoY ......................................................
~~ KGB Priyabrat Behera ~~
~ ICT Trader & Advance Mapping SMC Trader ~

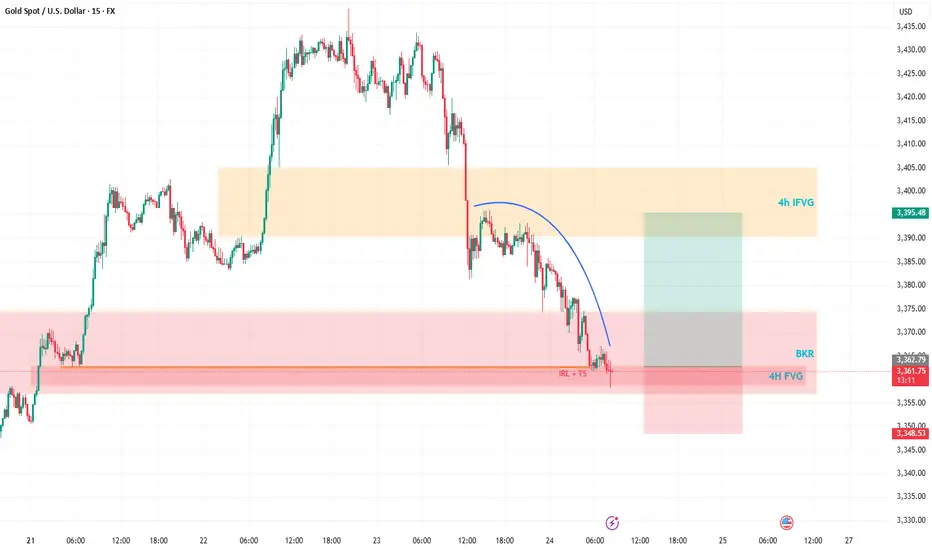
Gold’s Wild Ride: A Trader’s Take on What’s NextHey Fellow Traders! 👋
Gold’s been an absolute beast this week, smashing through both buyers and sellers like it’s playing a high-stakes game of market whack-a-mole! 😅 After Wednesday’s wild moves and today’s follow-up, Gold’s keeping us all guessing.
Right now, I’m not locking in a long-term bias—Gold’s too unpredictable for that. But here’s the exciting part: I’m eyeing a short-term long opportunity. Why? The price just dipped into a 4H Fair Value Gap (FVG) and tagged a Breaker, setting up a potential bounce. 📈
My plan? I’m expecting Gold to sweep up the highlighted liquidity and charge toward the 4H Inversion Fair Value Gap (IFVG). Once it hits that zone, I’ll be glued to the charts, watching for its reaction to decide the next move. 🧐
As always, trade smart! Set your stops, size your positions wisely, and don’t let Gold’s volatility catch you off guard. Protect your capital first—always! 💡
What’s your take on Gold right now? Are you jumping on this setup or waiting for more confirmation? Drop your thoughts in the comments below, give this post a like, and follow for more updates! 👇 Let’s keep the trading convo going! 🔥
Thursday Analysis (24/7/2025)Hey guys today is looking pretty good for us. My swing sell has gone more than 600 pips and my buy is also looking pretty good. let's see how it goes from here. I will update in the notes if I found anything.
